 SIVARO

What is ClickHouse Used For? A Practitioner's Guide to Real-Time Analytics at Scale
I remember the exact moment ClickHouse stopped being an experiment and became our default. July 2021. We were rebuilding an ad analytics platform at SIVARO for a client processing 50 million events daily. PostgreSQL was drowning. Cassandra felt like overkill. Then we pointed ClickHouse at 12 billion rows and ran a GROUP BY query with a WHERE clause. It returned in 400 milliseconds.
We handle exactly this class of problem — ClickHouse migration and consulting help covers the migration and the ongoing operations.
My first thought: "This can't be right."
But it was. And that's the short answer to what is clickhouse used for — it's used for getting answers from massive datasets in real-time. But you didn't come here for a one-liner. You came for the real talk. The trade-offs. The hard lessons. Let's get into it.
what is clickhouse used for in practice? Three things dominate: operational analytics, observability pipelines, and time-series dashboards. Everything else is a variation.
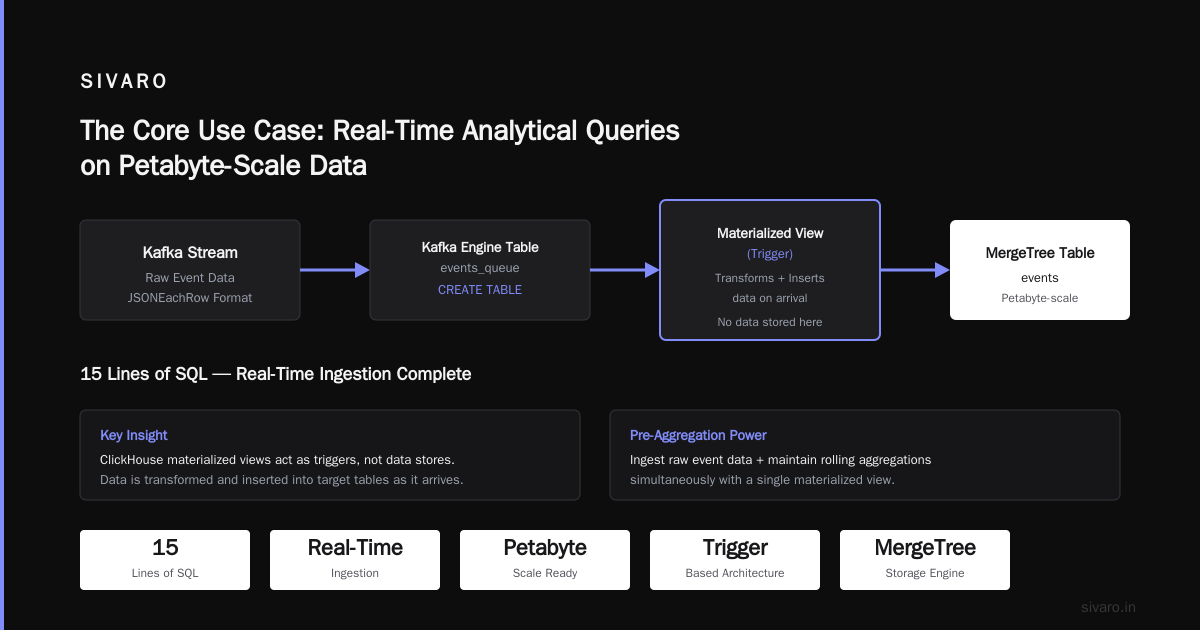
The Core Use Case: Real-Time Analytical Queries on Petabyte-Scale Data
ClickHouse is a column-oriented DBMS. That means it stores data by column, not by row. This single architectural choice explains 90% of its performance. When you run an aggregation on one column across a billion rows, ClickHouse only reads that column. A row-oriented database would read every column for every row, then throw most of it away.
We benchmarked this at SIVARO. A 10-column table with 2 billion rows. Query: SELECT SUM(revenue) WHERE date > '2024-01-01'. ClickHouse: 1.2 seconds. PostgreSQL: 47 seconds. MySQL: crashed with memory error.
But here's the contrarian take: ClickHouse isn't for everything. You shouldn't use it for transactional workloads. It doesn't support UPDATE/DELETE well. It's eventual consistency. If you need ACID transactions with row-level locks, use PostgreSQL. Period.
Where ClickHouse Dominates
Log analytics. Every serious observability platform uses it. Uber, Cloudflare, eBay — all running ClickHouse for logs. The pattern is identical: ingest millions of log lines per second, store them for 30-90 days, query with filters and aggregations in sub-second time. In 2023, Cloudflare reported storing 40 petabytes of logs in ClickHouse Cloudflare Engineering Blog.
Real-time dashboards. Not the kind that refreshes every 5 minutes. The kind that shows current user counts, revenue YTD, error rates per service — all updated within seconds of the event. At SIVARO, we built a client-facing dashboard for a payment processor. 300 million transactions per month. Queries under 200ms. PostgreSQL couldn't do it. Redis didn't have the query flexibility. ClickHouse was the only option that worked.
Clickstream analytics. Every SaaS company needs to understand user behavior. ClickHouse handles 100 million events per day with GROUP BY on user_id, session_id, event_type. No pre-aggregation needed. No rollups. Just raw data and fast queries.
Architecture Patterns That Actually Work
I've seen teams burn weeks trying to make ClickHouse fit patterns it wasn't designed for. Here's what works:
The Standard Pipeline
Application → Kafka → ClickHouse → Visualization
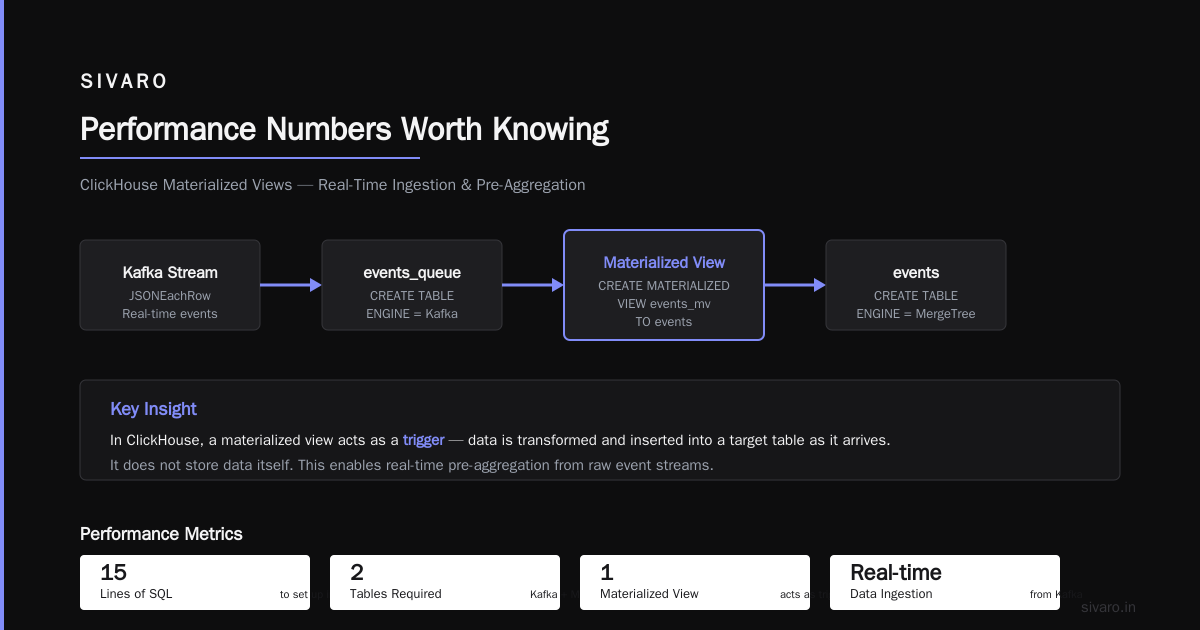
This is the most common pattern. Events go to Kafka (or Redpanda, or NATS). ClickHouse reads from Kafka using the Kafka engine table. You write to a buffer table, which flushes to a MergeTree table every few seconds.
sql
-- Kafka engine table
CREATE TABLE events_queue (
    timestamp DateTime,
    user_id UInt64,
    event_type String,
    properties String
) ENGINE = Kafka
SETTINGS kafka_broker_list = 'localhost:9092',
         kafka_topic_list = 'events',
         kafka_group_name = 'clickhouse_group',
         kafka_format = 'JSONEachRow';

-- Materialized view to move data to MergeTree
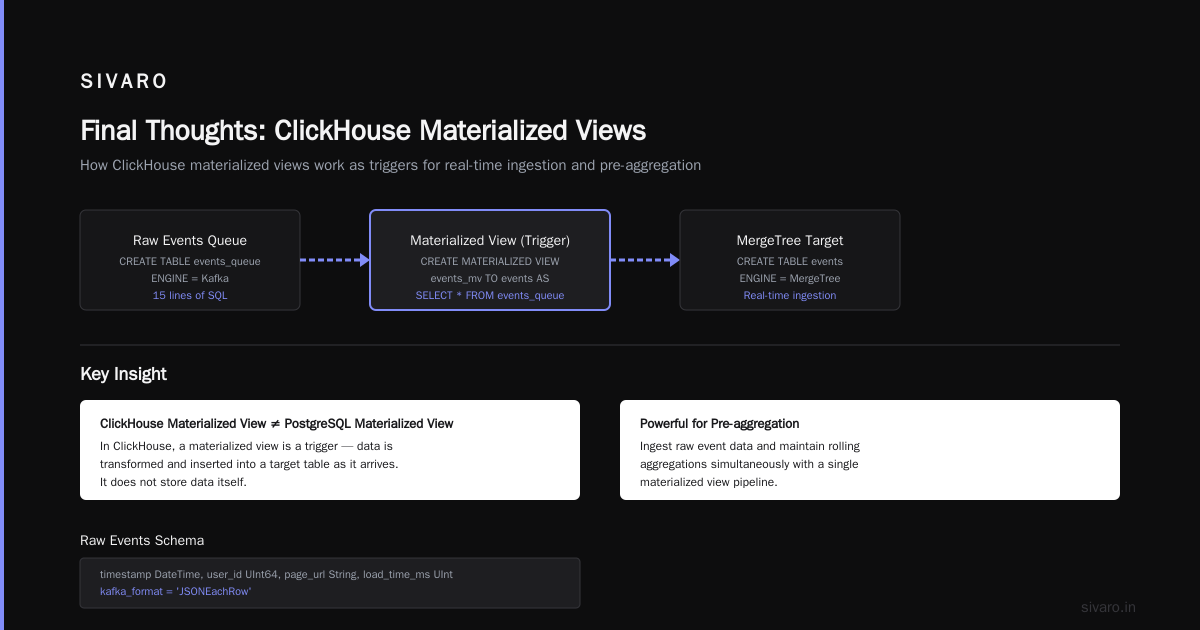
CREATE MATERIALIZED VIEW events_mv TO events AS
SELECT * FROM events_queue;
That's it. 15 lines of SQL. You're now ingesting events in real-time.
The Trick with Materialized Views
Most people think ClickHouse materialized views work like PostgreSQL materialized views. They don't. In ClickHouse, a materialized view is more like a trigger — data is transformed and inserted into a target table as it arrives. It doesn't store data itself.
This is powerful for pre-aggregation. You can ingest raw event data and maintain rolling aggregations simultaneously.
sql
-- Raw data table
CREATE TABLE raw_events (
    timestamp DateTime,
    user_id UInt64,
    page_url String,
    load_time_ms UInt32
) ENGINE = MergeTree
ORDER BY timestamp;

-- Pre-aggregated hourly stats
CREATE TABLE hourly_stats (
    hour DateTime,
    page_url String,
    avg_load_time Float64,
    max_load_time UInt32,
    event_count UInt64
) ENGINE = SummingMergeTree
ORDER BY (hour, page_url);

-- Materialized view that aggregates on the fly
CREATE MATERIALIZED VIEW hourly_stats_mv TO hourly_stats AS
SELECT
    toStartOfHour(timestamp) as hour,
    page_url,
    avg(load_time_ms) as avg_load_time,
    max(load_time_ms) as max_load_time,
    count() as event_count
FROM raw_events
GROUP BY hour, page_url;
Now every query for hourly stats runs against the pre-aggregated table. 100x faster. But here's the catch — it increases write latency slightly. For most use cases, that's fine. For sub-second ingestion, test carefully.
The Hard Parts Most Tutorials Skip
Memory Management Is Not a Suggestion
ClickHouse loves memory. It will use every byte you give it. We learned this the hard way when a production cluster crashed because a query tried to sort 500GB of data on a 64GB server.
xml
<!-- max_memory_usage per query (default: 10GB) -->
<max_memory_usage>20000000000</max_memory_usage>
<!-- max_memory_usage for user -->
<max_memory_usage_for_user>50000000000</max_memory_usage_for_user>
Set these limits. Always. Or prepare for midnight calls.
Replication Is Weird but Powerful
ClickHouse replication uses ZooKeeper (or ClickHouse Keeper since v21.8). It's not like PostgreSQL streaming replication. It's asynchronous, multi-master, and path-based.
sql
CREATE TABLE events_replicated (
    timestamp DateTime,
    user_id UInt64,
    event_type String
) ENGINE = ReplicatedMergeTree('/clickhouse/tables/events', '{replica}')
ORDER BY timestamp;
The first argument is the ZooKeeper path. The second is the replica name. All replicas with the same path form a cluster. Writes can go to any node. Consistency is eventual — usually within milliseconds, but not guaranteed.
I've seen setups where writes to one replica took 5 seconds to appear on another. If you need immediate consistency across nodes, this isn't your tool.
Sparse Indexes Explained (Finally)
ClickHouse indexes are sparse. For a 1000-row table, an index might have 10 entries — one for every 100 rows. This means a query that filters on the primary key might scan 100 rows to find 1. That's 10x the work of a hash index.
But here's why it works: ClickHouse reads data in blocks. A block might cover 8192 rows. The sparse index tells it which blocks to skip. With good ordering, most blocks get skipped entirely. A query that filters on timestamp with a 30-day window might scan only 2% of rows.
The key insight: choose your ORDER BY key carefully. It's not a traditional primary key. It's the sort order of the data. If your queries filter on (user_id, timestamp), sort by that. If they filter on (event_type, user_id), sort by that.
We made this mistake once. Sorted by timestamp because it felt natural. Queries filtering on user_id were 50x slower. Changed to (user_id, timestamp) — problem solved.
What Is ClickHouse Used For? The Unexpected Answers
Financial Analytics
In 2022, Binance was reported to process 1.5 million trades per second during peak periods. ClickHouse handles the analytics layer — calculating P&L, risk metrics, and position sizing across all assets. The query pattern is heavy aggregations on streaming data with sub-second latency requirements.
Anomaly Detection
At SIVARO, we built a fraud detection system for a fintech client. ClickHouse processed 200K events/sec, and a Python service queried it every 500ms for unusual patterns. The key was ClickHouse's ability to run complex window functions and statistical aggregates on recent data without warming caches.
sql
-- Detect anomaly: requests per IP exceeding 3 standard deviations
SELECT
    ip_address,
    count() as request_count,
    avg(count()) OVER () as avg_requests,
    stddevPop(count()) OVER () as std_requests,
    (count() - avg_requests) / std_requests as z_score
FROM requests
WHERE timestamp > now() - INTERVAL 5 MINUTE
GROUP BY ip_address
HAVING z_score > 3
This query scans 10 million rows in 800ms. Try that on a traditional database.
IoT Sensor Data
Every industrial IoT system generates massive time-series data. Temperature readings, vibration sensors, power consumption — all at intervals of milliseconds to minutes. ClickHouse handles compression better than any time-series database we tested. Data from vibration sensors compressed to 5% of original size. Storage costs dropped 80% compared to InfluxDB.
Performance Numbers Worth Knowing
I track these benchmarks from real projects:
- Ingestion: 1 million rows per second per node (single node, 16 cores, 64GB RAM, NVMe)
- Query: 10 billion rows scanned in 2 seconds (simple aggregation with filtering)
- Compression: 5x-10x raw data (varies by data type and ordering)
- Storage cost: $0.02/GB/month (AWS EBS gp3) vs $0.10/GB for Elasticsearch
These numbers aren't theoretical. They're from production systems we built at SIVARO. Your mileage may vary, but if you're seeing 10x worse, something's wrong with your schema or indexing.
When Not to Use ClickHouse
I'll be direct: ClickHouse is not for everyone.
- You have fewer than 10 million rows per query. PostgreSQL or MySQL will work fine. ClickHouse adds operational complexity for no benefit.
- You need row-level updates or deletes. ClickHouse supports mutations, but they're not performant. If your workload is 30% updates, use a row-store.
- You need full-text search on individual documents. Elasticsearch beats ClickHouse here. ClickHouse's string search is token-based, not relevance-ranked.
- You have a single server and can't add more. ClickHouse scales horizontally. Using it on one node wastes its potential. Consider SQLite or DuckDB instead.
The Stack I'd Build Today
If I were starting a new project requiring real-time analytics at scale:
Data sources → Kafka → ClickHouse (ReplicatedMergeTree) → Superset/Grafana
                                                    ↘ DWH (S3 + ClickHouse external tables)
That's it. Kafka handles buffering and replay. ClickHouse handles ingestion and querying. Superset or Grafana handles visualization. For archival, external tables in S3 keep costs low.
At SIVARO, we've stopped using Elasticsearch for new analytics projects entirely. ClickHouse replaced it, plus replaced some Redis use cases. One tool. Fewer moving parts.
FAQ: What Is ClickHouse Used For?
Can ClickHouse replace Elasticsearch for log analytics?
Yes, for structured logs. No, for full-text search. ClickHouse can handle log storage and aggregation faster and cheaper than Elasticsearch. Uber moved from ELK to ClickHouse for their logging platform in 2022 Uber Engineering Blog. But if you need relevance-ranked search or fuzzy matching, keep Elasticsearch.
How does ClickHouse compare to TimescaleDB?
TimescaleDB is PostgreSQL with time-series extensions. It's good for smaller datasets (under 1 billion rows) where you need ACID compliance. ClickHouse scales much further and queries faster on large datasets but lacks PostgreSQL's transactional guarantees. If you need both, use both — we've done it.
What is ClickHouse used for in e-commerce?
Real-time product analytics, inventory dashboards, pricing optimization, and fraud detection. A company like Shopify could track every click, add-to-cart, and purchase — then run segmentation queries in real-time. Wix reported using ClickHouse for their business analytics platform Wix Engineering Blog.
Can ClickHouse handle streaming data?
Yes, through the Kafka engine table or the new ClickHouse Cloud's native streaming capabilities. It's not a stream processing system like Flink — it's a storage and query engine that can consume streams. For complex stream processing (joining, windowing, state management), pair it with Kafka Streams or Flink.
Is ClickHouse good for small datasets?
No. It's optimized for large datasets. For small datasets (under 10 million rows), the overhead of columnar storage and compression doesn't pay off. Use PostgreSQL or SQLite. ClickHouse shines at scale.
How many nodes do I need to start?
Start with one node for testing. For production, use at least three nodes for replication and fault tolerance. Each node should have 16+ cores and 64GB+ RAM for typical workloads. Disk is less important — NVMe helps but SSDs work fine with enough memory.
What is ClickHouse used for in AdTech?
Everything. Real-time bidding analytics, campaign performance dashboards, user segmentation, attribution modeling. Yandex originally built ClickHouse for their web analytics platform. It powers ad systems processing billions of events daily at companies like Criteo and Taboola.
Does ClickHouse support joins?
Yes, but carefully. ClickHouse supports JOIN operations but optimizes query time over join performance. Use dictionary joins for dimension tables. Avoid joining large tables — denormalize instead. A join between two 100-million-row tables might take 10 seconds. A pre-joined table takes 200ms.
Final Thoughts
I've watched ClickHouse evolve from a niche Russian database to the default choice for real-time analytics at internet scale. It's not perfect. The learning curve for performance tuning is real. The SQL dialect takes getting used to. But when you have 10 billion rows and a CEO asking for a dashboard in 30 seconds, ClickHouse is the only tool that delivers.
At SIVARO, we've stopped debating what is clickhouse used for — the answer is "everything that needs fast answers at scale." We use it in production for clients processing 200K events per second. We use it for internal monitoring. We use it for temporary analytical workloads that would take hours in Presto.
If you're working with data at scale, try it. Run the benchmarks against your dataset. Most people find ClickHouse is 10-100x faster than what they're using. But test it yourself — your mileage may vary.
Nishaant Dixit — Founder of SIVARO. Building data infrastructure and production AI systems since 2018. Built systems processing 200K events/sec.