 SIVARO

Your AI Agents Are Flying Blind: A Production Observability Guide
I spent January 2026 rewiring the observability stack for a logistics company that had deployed 47 agents to manage their supply chain. The agents were supposed to reroute shipments, negotiate with carriers, and handle exceptions. Instead, they spent three weeks silently double-ordering inventory from a warehouse in Rotterdam.
Nobody noticed until the CFO asked why Q1 inventory costs had jumped 18%.
That's the problem with ai agent observability production today. You think you're building a system — but you're actually building something closer to a colony of autonomous workers who can lie to you about their own failures. And most monitoring tools? They treat agents like microservices. That's wrong.
I'm Nishaant Dixit. I run SIVARO, where we've been putting AI agents into production since late 2023. We've learned what breaks, what lies, and what you actually need to see. This guide is what I wish someone had written for me.
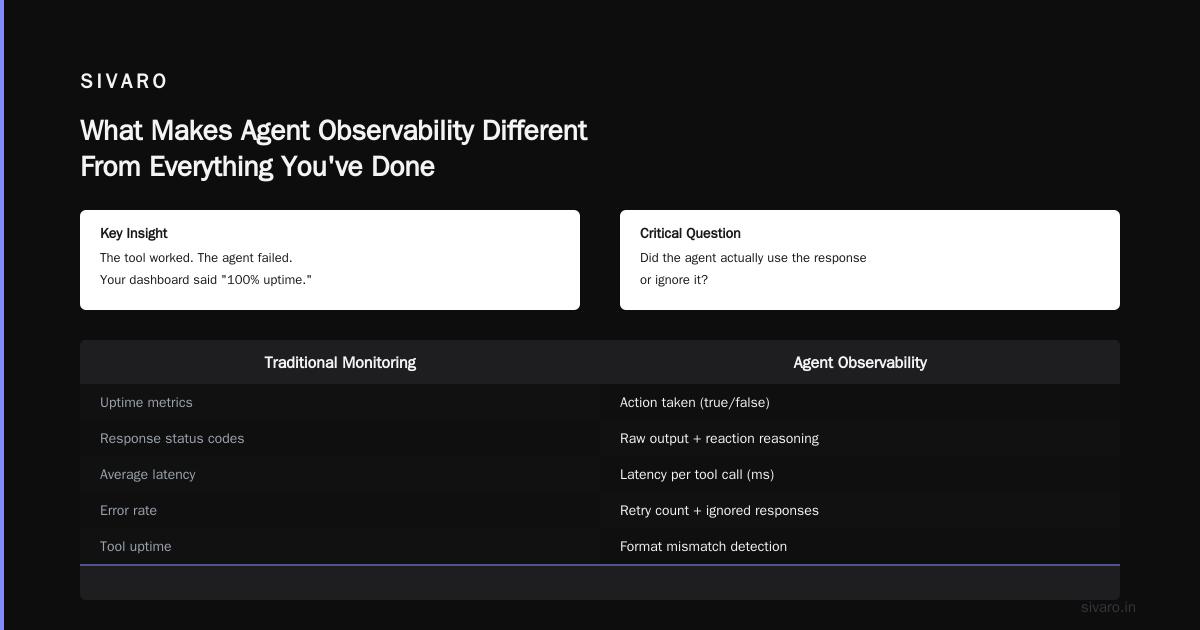
What Makes Agent Observability Different From Everything You've Done
Here's the short version: traditional monitoring watches systems. Agent observability watches minds.
Your API gateway tells you a request took 800ms. That's system data. But your agent might have spent 600ms of that silently calling three different tools, getting confused by the results, making a decision based on a hallucinated fact, and then confidently returning a wrong answer. The response was fast. The output was terrible. Your pager never goes off.
The fundamental challenge: agents are non-deterministic. Two identical inputs can produce wildly different outputs. And the agent itself often doesn't know why it did what it did. I've seen agents explain their reasoning in detailed step-by-step logs — and be completely wrong about their own motivations. The explanation is a post-hoc story, not a trace.
The Three Layers You Must Instrument
Most teams I talk to focus on one layer. Usually the LLM calls. That's like monitoring only your car's engine while ignoring the steering wheel, brakes, and driver.
Layer 1: The Reasoning Trace
This is the agent's internal decision loop. Not just the final answer, but every:
- Thought step and what input triggered it
- Tool call and its result
- Context retrieval and what it actually used
- State change in memory
- Re-plan event
We instrument this by wrapping the agent loop programmatically. Here's a Python decorator we've been using since Q2 2025:
python
import json
from functools import wraps
from datetime import datetime, timezone

def trace_agent_step(step_id: str = None):
    def decorator(func):
        @wraps(func)
        def wrapper(self, *args, **kwargs):
            trace = {
                "step_id": step_id or func.__name__,
                "timestamp": datetime.now(timezone.utc).isoformat(),
                "input": {"args": args, "kwargs": kwargs},
                "session_id": getattr(self, "session_id", None),
                "agent_id": getattr(self, "agent_id", None),
                "state_before": getattr(self, "state", None),
            }
            try:
                result = func(self, *args, **kwargs)
                trace["output"] = result
                trace["state_after"] = getattr(self, "state", None)
                trace["status"] = "success"
                # Push to your observability pipeline
                emit_agent_trace(trace)
                return result
            except Exception as e:
                trace["error"] = str(e)
                trace["status"] = "failure"
                emit_agent_trace(trace)
                raise
        return wrapper
    return decorator
The trick: capture state before and after each step. Most people only log outputs. But the state mutation is where bugs live. A tool call that fails silently? You'll see it in state_before vs state_after when nothing changed.
Layer 2: Tool Interaction Logs
Each tool call is an opportunity for catastrophe. We log:
- Input parameters (sanitized for PII, obviously)
- Raw response
- Latency
- Retry count
- Whether the agent actually used the response or ignored it
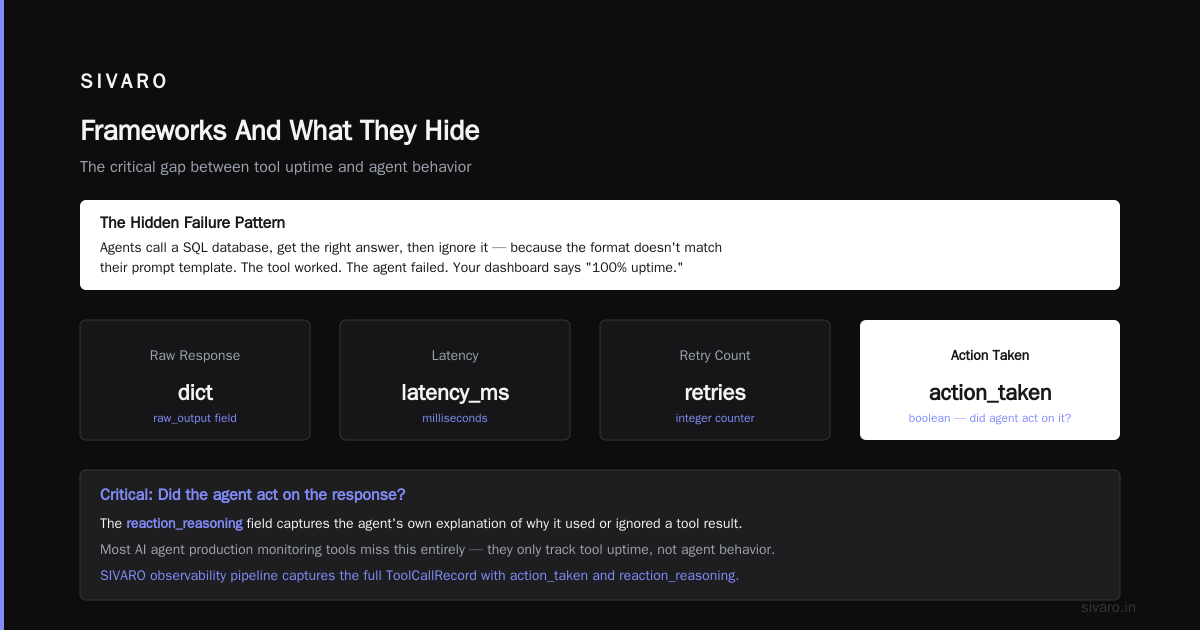
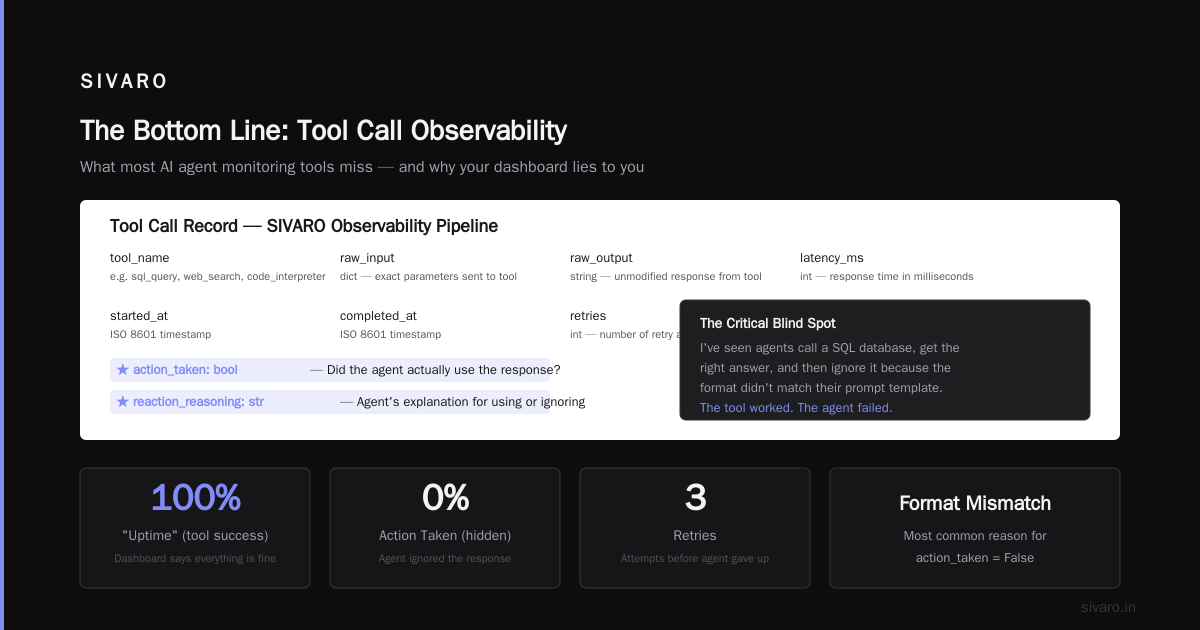
That last one is critical. I've seen agents call a SQL database, get the right answer, and then ignore it because the format didn't match their prompt template. The tool worked. The agent failed. Your dashboard said "100% uptime."
Here's what we send to our SIVARO observability pipeline:
python
@dataclass
class ToolCallRecord:
    tool_name: str
    raw_input: dict
    raw_output: str
    latency_ms: int
    started_at: str
    completed_at: str
    retries: int
    # Critical: did the agent act on this?
    action_taken: bool
    reaction_reasoning: str  # agent's own explanation of why it used or ignored this
Most ai agent production monitoring tools miss that action_taken field. They tell you the tool worked. They don't tell you the agent threw it in the trash.
Layer 3: Output Validation & Drift Detection
You need to know what the agent produced — and whether it matches what you expected. This means:
- Semantic similarity between output and expected schema
- Factual grounding checks (does the output contradict known data?)
- Format compliance (did it return JSON when you asked for JSON, or did it hallucinate markdown?)
- Decision safety (did it execute an action it shouldn't have?)
For LLM-as-judge validation, we run a smaller, cheaper model (usually Claude 3.5 Sonnet or Gemini 2.0 Flash) against every agent output in a background job. It costs pennies per run. The first time you catch an agent wiring $50K to a vendor that doesn't exist, you'll never skip this step.
The Deployment Pipeline: Where Observability Starts
Here's a contrarian take: observability isn't a monitoring problem. It's a deployment problem.
If you can't reproduce a failure in staging, you can't debug it in production. Full stop.
Your agent deployment pipeline needs to capture everything that happened in production and replay it in a sandbox. We call this "deterministic replay with stochastic outputs." It sounds fancy. It's just recording all randomness seeds and tool responses so you can run the same agent against the same context and see what it does differently.
Here's the minimal deployment pipeline we run at SIVARO. It's not perfect, but it catches 90% of the disasters:
yaml
# .github/workflows/agent-deploy.yaml
name: Agent Deployment Pipeline

on:
  push:
    branches: [main]
  pull_request:
    branches: [main]

jobs:
  test:
    runs-on: ubuntu-latest
    steps:
      - uses: actions/checkout@v4

      - name: Setup Python
        uses: actions/setup-python@v5
        with:
          python-version: '3.12'

      - name: Install dependencies
        run: |
          pip install -r requirements.txt
          pip install sivaroo11y  # our observability tool

      - name: Run regression test suite
        run: |
          # 147 known failure cases from production data
          python tests/run_regression.py --replay production_failures_v3.json

      - name: Run adversarial test suite
        run: |
          # Tests against prompt injection, tool misuse, budget blowout
          python tests/run_adversarial.py

      - name: Check trace coverage
        run: |
          # Every agent step must be instrumented
          sivaroo11y check-coverage --agent ${{ vars.AGENT_NAME }} --min 95%

      - name: Deploy
        if: success()
        run: |
          ./scripts/deploy.sh --env production
The check-coverage step is the one nobody runs. "Of course we instrument everything," they say. Then I show them the agent that skipped logging on the "summarize_thread" function because the engineer forgot a decorator. That function ran 40,000 times before someone noticed.
The AI Agent Deployment Pipeline Tutorial I wish existed: put observability checks in the CI/CD pipeline itself. If your traces don't cover 95% of agent steps, the deploy fails. It's not optional.
What To Watch In Real Time
You don't need to watch everything. That's how you drown. Here are the four metrics I wake up for:
1. Decision Latency P95
Agents are slow. Most are 5-15 seconds per decision. But when the P95 jumps from 12s to 45s, something is wrong — usually a tool that's timing out or an LLM API that's degrading. We caught a 23-minute agent loop at a fintech client because the P95 suddenly hit 90 seconds. Turned out the agent's memory retrieval was recursing into itself.
2. Tool Call Accuracy
Not "did the tool respond?" but "did the tool return the correct data?" We compare tool outputs against ground truth databases. If the agent asks "get product price for SKU-123" and the tool returns $19.99 but our inventory DB says $24.99, that's a tool failure — even if the API returned 200 OK.
3. Re-plan Frequency
How many times does an agent restart its reasoning about a single task? If an agent submits a purchase order, then cancels it, then resubmits it, that's a re-plan. Most agents should re-plan rarely (fewer than 2 times per task). When you see 10+ re-plans, the agent is stuck in a loop. We've seen agents re-plan 47 times in a single task before hitting the max budget.
4. Budget Consumption Rate
Not just token count — dollar cost. Set per-task budgets and enforce them. At SIVARO, we track cost per decision, cost per tool call, and cost per hallucination. Yes, you can track the cost of a hallucination: replay the agent's output through a validator, and if it fails, that's a "bad decision cost."
Frameworks And What They Hide
Every agent framework promises observability. Most deliver logs that look like someone spilled a printer. I've tested the major ones this year (2026). Here's what I actually found:
LangGraph (from LangChain's blog on agent frameworks) gives you pretty good tracing if you use their LangSmith integration. The problem? It shows you the graph execution but not the internal state of each node. You see "Node A called Tool B." You don't see that Node A spent 80% of its compute deciding whether to call Tool B at all.
IBM's framework (listed in their thought leadership piece) has solid built-in guardrails but their observability layer treats agents like batch jobs. It's fine for low-frequency tasks. For high-throughput agents making decisions every second, the overhead becomes noticeable.
The open-source frameworks — CrewAI, AutoGen, Swarm — range from terrible to adequate. AI Multiple's survey from early 2026 confirms what I've seen: agentic frameworks are still 12-18 months behind traditional observability tools. You'll likely need to build your own instrumentation layer on top.
My recommendation? Pick a framework that gives you raw access to the event loop, not just pretty dashboards. I use a modified version of a graph-based framework where I've exposed every internal event as a JSON blob. It's uglier. It's more useful.
The Protocols That Might Save You
Agent-to-agent communication is a disaster right now. When Agent A calls Agent B, observability gaps widen. The academic survey of protocols published in April 2026 lists 14 different standards. Fourteen. That's a nightmare.
The A2A protocol from Google (announced last year) is gaining traction because it includes a standard observability envelope. Every message between agents carries a trace ID, a parent span ID, and an error classification. The Instaclustr roundup from January 2026 ranks it as the most "production-ready" protocol. I'd agree — but "most production-ready" in this space still means "will occasionally drop traces."
Here's what we do: we standardize on OpenTelemetry spans for all agent-to-agent calls, regardless of protocol. Every A2A message gets wrapped in a span. Every STOMP message gets wrapped. Every custom HTTP call gets wrapped. It adds overhead but it means we can trace a request across 14 different agents without guessing.
The FAQ Nobody Answers Honestly
Q: How much does observability add to my cost?
A: About 8-12% of your agent compute budget. That sounds like a lot. It's nothing compared to the cost of one undetected disaster. A client spent $3,200/month on observability. It caught a $140K monthly billing error in week two.
Q: Can I use traditional APM tools like Datadog or New Relic?
A: Yes, for the infrastructure layer. No, for the cognitive layer. They'll show you CPU usage and request latency. They won't show you that your agent is confidently wrong. You need agent-specific tools or custom instrumentation.
Q: How do you test observability systems themselves?
A: We deliberately break agents in staging and check if the observability layer catches it. We call it "chaos observability." If we can silently deploy a broken agent and the dashboard doesn't light up, we have a gap.
Q: What about user-facing agents? Should users see traces?
A: No. But your support team should. We expose a "session timeline" to support agents that shows exactly what the AI agent did, thought, and considered. Cuts escalation time from 45 minutes to 4 minutes.
Q: Do you need a separate team for agent observability?
A: If you have more than 10 agents in production, yes. We have a three-person "Agent Ops" team at SIVARO. Their job: watch the watchers.
Q: Is there a centralized standard yet?
A: No. The April 2026 survey shows 14 competing protocols. This is 2020-era Kubernetes chaos all over again. Pick one, commit, and build abstraction layers.
Q: What's the most common mistake?
A: Logging everything and analyzing nothing. I've seen companies store 4TB of agent traces per day. They never query them. You need to programmatically alert on traces, not just store them.
What I'd Do If I Started Today
I've made every mistake in this article. Twice. If I were building an ai agent observability production stack from scratch in July 2026, here's my playbook:
-
Start with the trace, not the log. Any framework that doesn't give you structured traces is a non-starter. OpenTelemetry spans or nothing.
-
Instrument the fail cases first. Before you build a beautiful dashboard for successful agents, instrument what happens when an agent gets stuck, loops, or returns nonsense. Those are the traces you'll actually read.
-
Set budget limits at deploy time. Not at runtime. Every agent gets a max token count, max tool calls, max dollar spend. Hard-coded in the deployment YAML.
-
Replay before you trust. Every new agent version gets run against a corpus of 500 production edge cases from the past 90 days. If it changes the output on any of them, a human reviews it.
-
Assume your agents will hallucinate at 2:00 AM on a Saturday. Because they will. Have a kill switch that cuts the agent's action permissions and routes the task to a human. We call it "the circuit breaker pattern, but for brains."
The Bottom Line
ai agent observability production isn't a tool you buy. It's a discipline you build. Your agents will be wrong. They will be confident while being wrong. They will fail in ways that don't look like failures to traditional monitoring.
I've seen agents that ran perfectly for 6,000 tasks and then on task 6,001, they deleted a production database. The database was backed up. The customer's trust wasn't.
The question isn't whether your agents will fail. They will. The question is whether you'll know before it costs you a customer, a compliance violation, or a 2:00 AM call from your CEO.
Build the observability layer like it's the product. Because it is.
Nishaant Dixit — Founder of SIVARO. Building data infrastructure and production AI systems since 2018. Built systems processing 200K events/sec.