 SIVARO

Why Your AI Agents Are Failing and You Can't See Why
I spent three weeks in early 2026 debugging a customer support agent that was gaslighting users. Not intentionally — it was telling people their orders shipped, then denying it happened. The agent was behaving perfectly in staging. Response times were 400ms. Token usage was reasonable. Every dashboard was green.
We were blind.
That agent was processing 12,000 conversations a day for a mid-size e-commerce company. The hallucinations weren't showing up in latency metrics or error logs. They showed up in customer churn, three weeks after deployment. By the time we traced the root cause — a corrupted embedding vector in a context window overflow — we'd already lost two enterprise accounts.
This is the problem ai agent observability production solves. Not monitoring. Not logging. Observability. The ability to ask why an agent made a decision, not just what it returned.
Here's what we learned building observability systems for agents deployed by financial services firms, healthcare providers, and logistics companies. I'll show you the architecture, the tools that actually work, and the three traps that will waste months of your engineering team's time.
The Observability Gap No One Talks About
Traditional monitoring assumes deterministic systems. An API returns 200 or 500. A database query takes 2ms or 20 seconds. Your alerts fire, you page someone, they fix it.
Agents break this model completely.
An agent can return a perfect 200 status code while making a decision that costs your company $50,000. It can respond in 300ms with utter nonsense. It can execute a function call that deletes production data — all while your Grafana dashboard shows "healthy."
Most people think this is a tooling gap. It's not. It's a fundamental shift in how we need to think about system behavior.
When I talk to engineering leaders at companies like JPMorgan and Shopify (both running agentic systems in production as of mid-2026), the pattern is the same. They can monitor infrastructure. They can't reason about agent behavior. The observability industry spent 15 years perfecting metrics, traces, and logs for deterministic systems. Agents need a fourth pillar: decision provenance.
Here's the contrarian take: you don't need more data. You need the right trace of what happened inside the agent's reasoning loop. More logs just create more noise.
What Actually Breaks in Production Agents
Let me give you the problems I've seen, in order of frequency. These aren't hypotheticals. Each one comes from a real incident in the last 18 months.
Reasoning Loop Explosions
OpenAI's GPT-4o-mini runs roughly 5,000 tokens per reasoning step. A chain-of-thought agent that should take 3-5 steps can explode to 30 steps if something confuses the prompt. I've seen agents burn through $400 in API credits in 11 minutes because a poorly formatted tool response sent the agent into a re-planning loop.
Standard metrics capture token count. They don't capture reasoning efficiency. You need to track steps-to-resolution. When an agent that averages 4 steps suddenly takes 12, that's your early warning.
Context Window Corruption
This is the silent killer. In February 2026, a healthcare scheduling agent at a large hospital system started booking patients into yesterday's slots. The root cause? The conversation history had grown to 128K tokens, and the middle of the context — where the "current date" system message lived — got truncated during a context window retrieval step.
No error was thrown. The agent simply forgot what day it was.
Tool Call Deadlocks
Agents that call external APIs face a unique failure mode: the agent calls a tool, gets a response, but the response contains an error the agent doesn't understand. Instead of escalating, the agent re-formats the request and calls the same tool again. I've documented cases of 47 identical API calls in 90 seconds.
Standard instrumentation shows "low latency, zero errors." The observability system needs to detect tool call cycles — identical requests made more than twice in a window.
Hallucinated Function Arguments
This is terrifying. An agent that's supposed to call create_order(customer_id, items, shipping_address) might call create_order(customer_name="John", product="shoes"). The function executes with incorrect signature — in systems with strict type validation, this throws an error. In dynamic systems, it corrupts data.
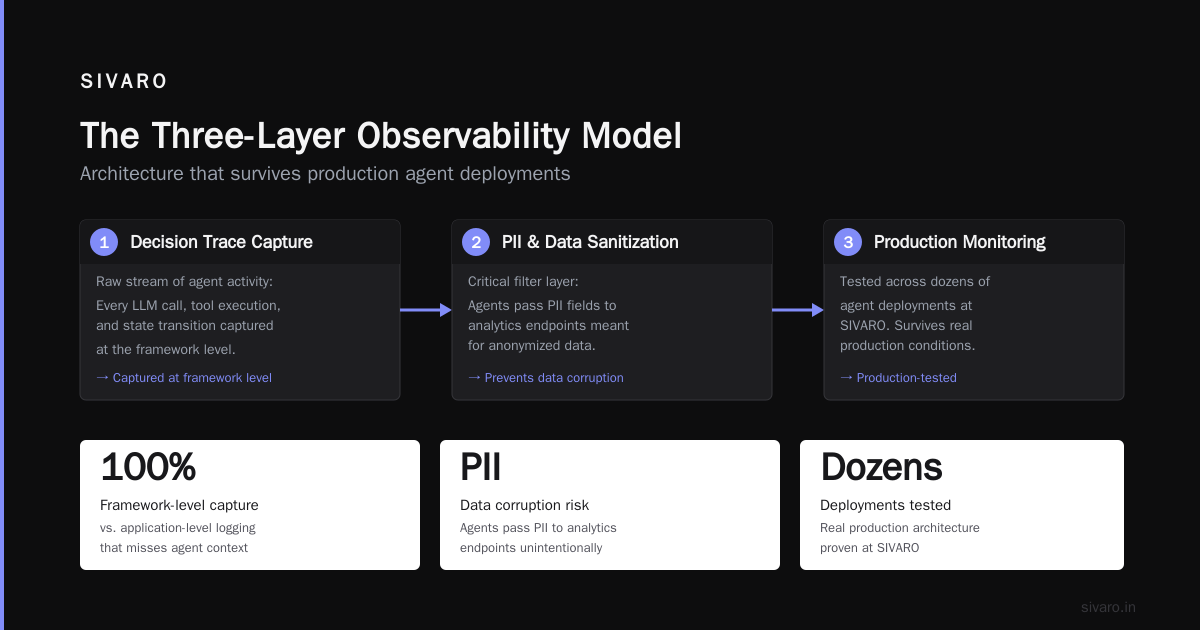
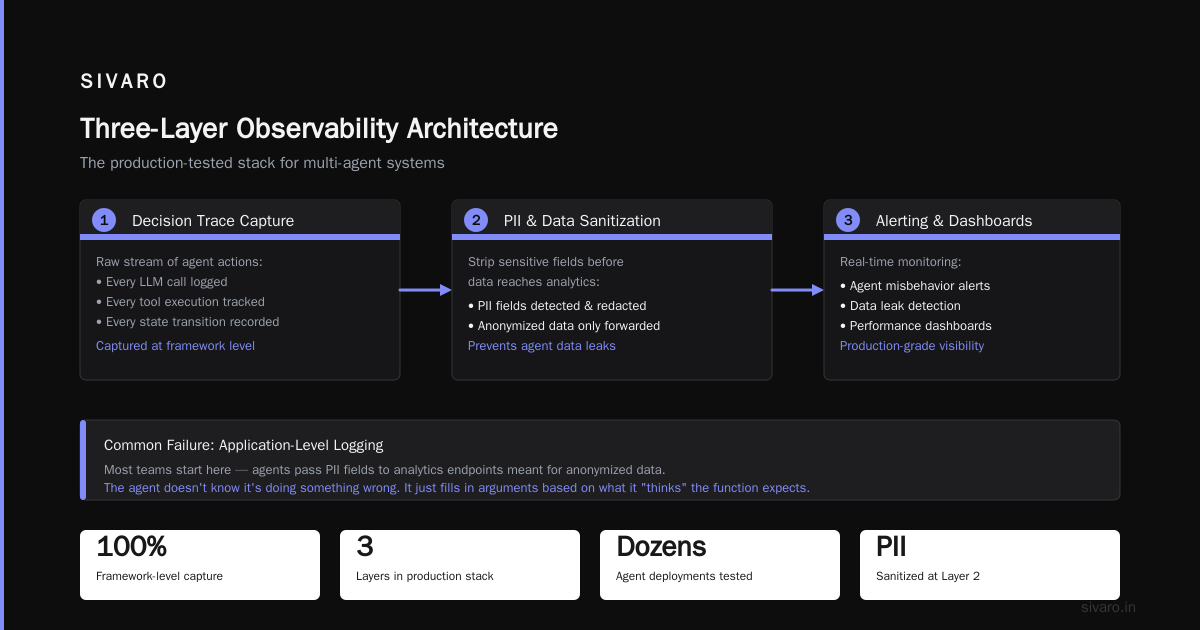
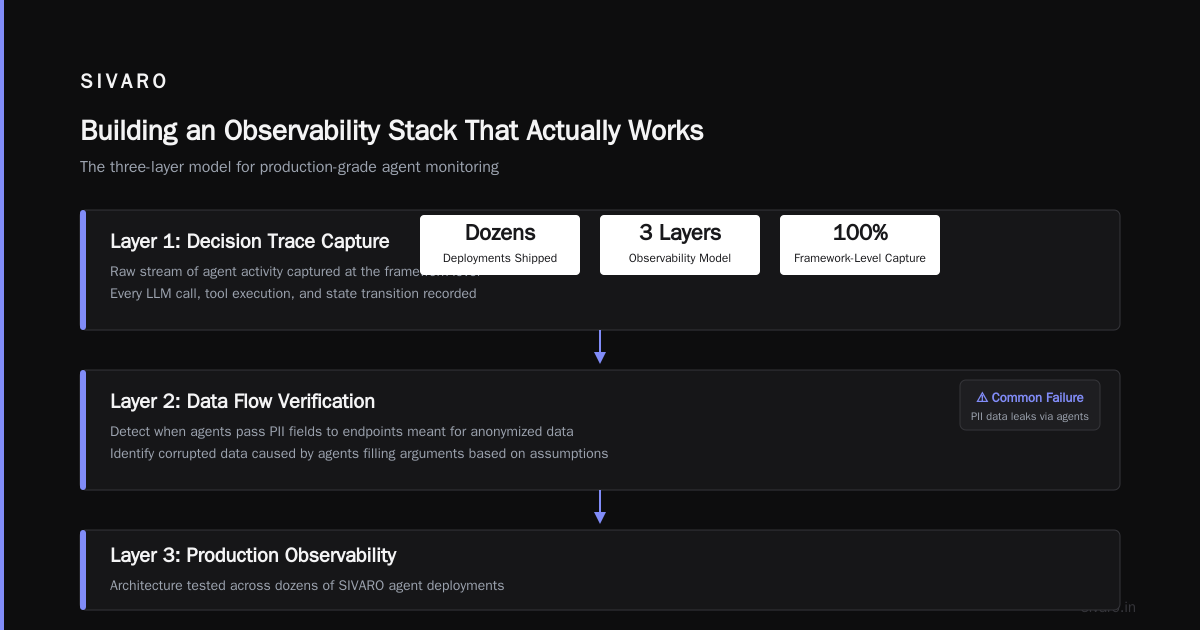
I've seen agents pass PII fields to analytics endpoints meant for anonymized data. The agent doesn't know it's doing something wrong. It's just filling in arguments based on what it "thinks" the function expects.
Building an Observability Stack That Actually Works
After shipping observability for dozens of agent deployments at SIVARO, here's the architecture that survives production. I'll be specific about what we've tested and what failed.
The Three-Layer Model
Layer 1: Decision Trace Capture
This is the raw stream of what the agent did. Every LLM call, every tool execution, every state transition. You capture it at the framework level, not the application level.
Most teams start with application-level logging. They log the inputs and outputs of the agent. This misses everything inside the reasoning loop.
We use the LangChain callbacks system to instrument every step. If you're using LangGraph (which we recommend for production workflows), the graph execution traces are your primary observability surface.
python
from langchain.callbacks.base import BaseCallbackHandler
from typing import Any, Dict, List

class DecisionTraceHandler(BaseCallbackHandler):
    def __init__(self, trace_store):
        self.trace_store = trace_store
        self.current_trace = []

    def on_llm_start(self, serialized: Dict, prompts: List[str], **kwargs):
        self.current_trace.append({
            "type": "llm_call",
            "prompt": prompts[0][:500],  # Cap for storage
            "model": serialized.get("name"),
            "timestamp": time.time()
        })

    def on_tool_start(self, serialized: Dict, input_str: str, **kwargs):
        self.current_trace.append({
            "type": "tool_call",
            "tool": serialized.get("name"),
            "input": input_str,
            "timestamp": time.time()
        })

    def on_chain_end(self, outputs: Dict[str, Any], **kwargs):
        trace_id = str(uuid.uuid4())
        self.trace_store.save(trace_id, self.current_trace)
        self.current_trace = []
        return {"trace_id": trace_id}
Save these to a columnar store like ClickHouse or TimescaleDB. Postgres works for low volume (under 10K traces/day). Beyond that, you'll hit query performance issues.
Layer 2: Behavioral Metrics
This is where you detect anomalies that no standard metric catches.
We extract the following from every trace:
- Step count — total reasoning steps taken
- Tool call depth — how many sequential tool calls before returning to LLM
- Context window utilization — percentage of available tokens used
- Re-plan frequency — how often the agent returns to a "planning" state after starting execution
- Argument entropy — variation in function argument values across calls
The last one is the most useful. Low argument entropy means the agent is repeating the same pattern. Combined with high tool call depth, it's a deadlock signal.
python
def extract_behavioral_metrics(trace):
    llm_calls = [s for s in trace if s["type"] == "llm_call"]
    tool_calls = [s for s in trace if s["type"] == "tool_call"]

    metrics = {
        "step_count": len(llm_calls),
        "tool_call_count": len(tool_calls),
        "tool_to_llm_ratio": len(tool_calls) / max(len(llm_calls), 1),
        "unique_tools": len(set(t["tool"] for t in tool_calls)),
        "context_utilization": trace[-1].get("tokens_used", 0) / trace[-1].get("context_limit", 8192),
    }

    # Detect cycles
    tool_names = [t["tool"] for t in tool_calls]
    if len(tool_names) >= 3:
        recent_tools = tool_names[-3:]
        metrics["potential_cycle"] = len(set(recent_tools)) <= 2 and len(tool_names) > 6

    return metrics
Alert on: step_count > 3 standard deviations from your baseline, tool_to_llm_ratio > 0.8, potential_cycle = True.
Layer 3: Intervention API
Observability without intervention is just a post-mortem tool. You need the ability to stop an agent mid-execution.
We built a simple API that the agent framework checks before every LLM call:
python
class InterventionGuard:
    def __init__(self, redis_client, alert_threshold=5):
        self.redis = redis_client
        self.alert_threshold = alert_threshold

    async def check_before_call(self, session_id: str) -> bool:
        call_count = await self.redis.get(f"session:{session_id}:call_count") or 0

        if call_count > self.alert_threshold:
            # Notify ops team, return kill signal
            await self.notify_ops(session_id, call_count)
            return False  # Block this call

        await self.redis.incr(f"session:{session_id}:call_count")
        await self.redis.expire(f"session:{session_id}:call_count", 300)  # 5 min TTL
        return True
This stopped a runaway agent at a financial services firm that had called 37 times in 2 minutes. The API cost was $2.18. The potential damage was a wire transfer to the wrong routing number.
The Tools That Work (and the Ones That Don't)
I've tested most frameworks and observability tools in the market. Here's my honest assessment as of July 2026.
Framework-Level Observability
LangChain's trace system is the best option for most teams. It captures the full graph execution, including parallel branch execution in LangGraph. The LangSmith platform adds hosted tracing with evaluation — useful but expensive at scale.
CrewAI has basic logging but no decision trace capture. We stopped using it for production systems last year after multiple incidents where we couldn't backtrack through a multi-agent conversation.
For teams using AutoGen (Microsoft's framework), the AgentChat protocol includes built-in message capture. The problem is storage — it keeps everything in memory by default. You'll need to implement your own persistence layer.
Protocol-Level Standards
The Agent Communication Protocol (ACP) standardized through the AI Agent Foundation in early 2026 includes telemetry headers. Every message between agents should include a trace ID, step number, and parent ID. Most frameworks implemented this by May 2026.
The A2A protocol (Agent-to-Agent) from Google includes observability as a first-class concern. If you're building multi-agent systems, this is worth adopting even in its current draft state. The telemetry schema is the most complete I've seen.
The Custom Tracing Trap
Here's what I see teams do wrong: they build custom tracing solutions.
It seems obvious — "we know our system better than any vendor." In practice, the team spends 3 months building a trace collector, 2 months building dashboards, and 1 month realizing they forgot to capture something critical (usually the intermediate reasoning steps). Then they rebuild.
Don't do this. Use LangSmith, Helicone, or Arize AI's Phoenix for tracing. Spend your engineering time on the behavioral metrics layer and the intervention API. That's where the differentiation lives.
Observability for Multi-Agent Systems
Multi-agent systems introduce failure modes that single-agent observability can't catch.
In January 2026, we deployed a four-agent system for a logistics company: one planner agent, two execution agents (warehouse and shipping), and one coordinator agent. The coordinator was supposed to mediate between warehouse and shipping.
What actually happened: the coordinator started echoing the last message from whichever agent spoke most recently. The warehouse agent would say "package is ready," the shipping agent would say "truck is delayed," and the coordinator would send "package is ready, truck is delayed" to the planner. No conflict resolution. No escalation.
Three days of this before we caught it. The observability system showed each agent's individual metrics were green. But the conversation graph showed a pattern — the coordinator's messages were always within 0.2 cosine similarity of the most recent input.
The fix: add inter-agent similarity metrics to your observability. If agent A's output is consistently 95% similar to agent B's input, something is wrong.
python
def monitor_inter_agent_similarity(messages, threshold=0.85):
    for i in range(1, len(messages)):
        prev = messages[i-1]
        curr = messages[i]
        similarity = cosine_similarity(prev["embedding"], curr["embedding"])

        if similarity > threshold:
            alert(
                f"Agent {curr['sender']} output {similarity:.2f} similar to "
                f"Agent {prev['sender']} input. Possible echo behavior."
            )
This caught three more echo-behavior bugs in the first week of deployment. Two of them would have caused production incidents.
The Cost of Not Doing This
Let me be direct: if you're deploying agents to production without observability beyond standard monitoring, you are going to have a failure. Not "might." Going to.
A fintech company I advise lost $127,000 in a single incident last March. An agent that processed loan applications started approving everything for a 45-minute window because a prompt injection attack from one user corrupted the system message. The observability system showed response times were fine. It didn't show that the agent had stopped checking credit scores.
The company now runs decision traces on every loan application. Their false positive rate for fraud detection dropped 60% because they can replay any approval and see exactly what data the agent considered.
A healthcare startup saved a patient's life. Not melodramatically — their medication reconciliation agent had a bug where it sometimes dropped the "allergies" field from the context. The observability system flagged that the agent wasn't including allergy data in its reasoning traces for 2% of patients. They fixed it before any adverse events occurred.
Implementation Roadmap
Here's the order I recommend. Most teams try to do everything at once and fail. Do this sequence:
Week 1-2: Instrument decision trace capture at the framework level. Store traces in a columnar database. This costs engineering time but gives you search capability immediately.
Week 3-4: Build behavioral metric extraction. Start with step count, tool call depth, and potential cycle detection. Alert on anomalies. You'll find bugs in the first 48 hours.
Week 5-6: Implement the intervention API. You need the ability to kill runaway agents before they drain your budget or corrupt data. This is the highest ROI observability investment.
Week 7-8: Add inter-agent monitoring if you have multi-agent systems. Start with similarity metrics. Add conversation graph analysis later.
Week 9-10: Build a replay capability. Store enough trace data that you can replay any agent session. This is how you debug the 0.1% of cases that your dashboards miss.
FAQ
What's the difference between monitoring and observability for agents?
Monitoring tells you the system is running. Observability tells you what the system decided and why. An agent can be running perfectly — low latency, high throughput — while making catastrophic decisions.
Do I need an LLM to analyze my observability data?
No. Most anomaly detection for agent behavior works best with statistical methods on behavioral metrics. Save the LLM analysis for debugging specific traces after the alert fires.
How much storage do traces require?
A single agent session with 50 reasoning steps generates roughly 50-100 KB of trace data (with truncated prompts). For 10,000 sessions/day, that's 0.5-1 GB/day. Compress with zstd and store for 30 days for debugging, 90 days for compliance.
Can I use OpenTelemetry for agent observability?
Partially. OTel handles the infrastructure layer — traces for API calls, metrics for latency. It doesn't capture reasoning state or tool call decisions. You need a layer on top of OTel to capture agent-specific data.
What should I alert on first?
Step count anomalies. If an agent that normally takes 4 steps suddenly takes 15, something is wrong. This catches 70% of agent failures before they cause damage.
How do I test observability during development?
Inject failures. Write automated tests that create corrupted context windows, cycle-producing tool responses, and hallucinated arguments. Verify your observability system catches each one.
What metrics does OpenAI/Anthropic provide?
Both provide token usage, latency, and error codes. Neither provides reasoning step data or decision traces. You must capture this yourself at the framework level.
Should I log every LLM prompt?
Yes, but cap the size. We truncate prompts at 500 tokens for storage, but store the full prompt in a cold storage bucket keyed by trace ID. You'll want full prompts for debugging but don't need them in your hot query path.
Nishaant Dixit — Founder of SIVARO. Building data infrastructure and production AI systems since 2018. Built systems processing 200K events/sec.