 SIVARO
Why Your AI Agents Are Breaking in Production (And What to Do About It)
I spent three nights in May 2026 debugging a customer support agent that started speaking Spanish to German users. No code changed. No model update. The drift was so gradual we almost missed it.
Welcome to production AI monitoring.
You're about to learn what actually matters when you're running AI agents at scale. Not the theory. The scars.
Here's the truth: most agent monitoring tools are glorified dashboards that show you latency and token count. Useless. You need to know why your agent picked the wrong tool, took seventeen hops instead of three, or started hallucinating contract terms at 2 AM.
This guide covers the tools, the metrics, and the patterns I've learned building SIVARO's production systems since 2018. We process 200K events per second across our clients' agent deployments, and I've seen every failure mode you can imagine.
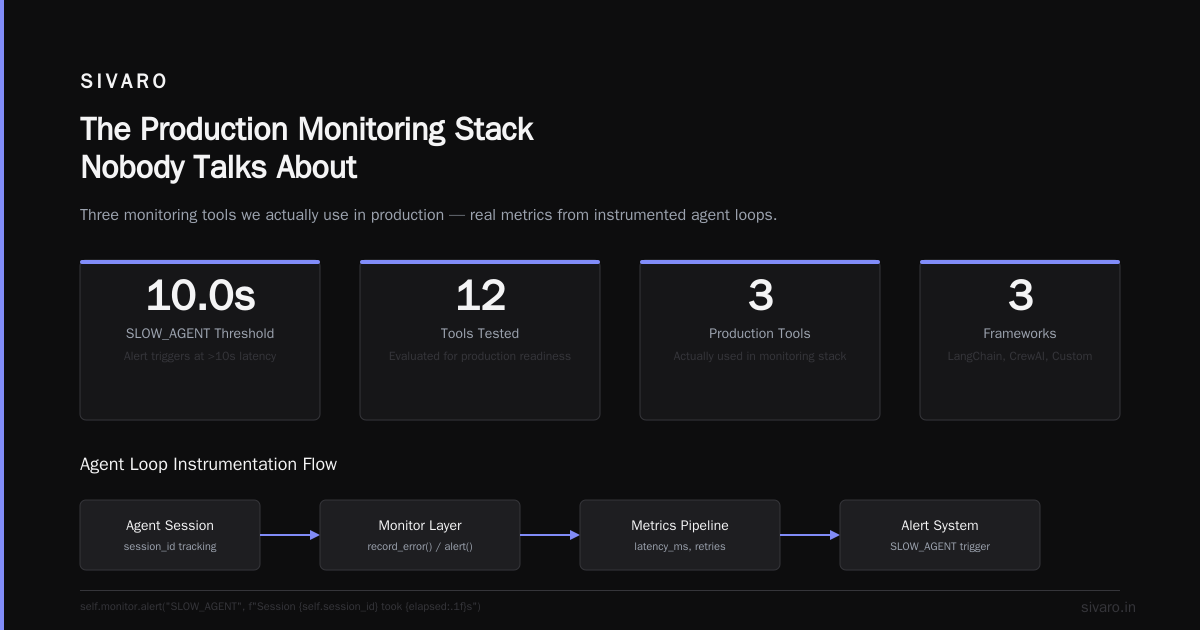
The Production Monitoring Stack Nobody Talks About
Three layers. That's it.
Layer 1: Infrastructure observability. CPU, memory, GPU utilization, request latency. Standard stuff. Datadog, Grafana, whatever you already use. If your agent crashes because it ran out of memory, you have a DevOps problem, not an AI problem.
Layer 2: Agent behavior observability. This is where things get specific. What tools did the agent call? In what order? How many retries? What was the confidence score before it committed an action? This is the layer most teams ignore because it requires instrumenting the agent framework itself.
Layer 3: Business outcome monitoring. Did the agent actually solve the user's problem? Did it escalate correctly? Did it comply with policy? This is the hardest layer because ground truth comes from humans reviewing sampling of interactions.
Most "ai agent production monitoring tools" only cover Layer 1 and a sliver of Layer 2. You need all three.
What Broke in Our First Production Agent
April 2025. We deployed a procurement agent for a manufacturing client. Handled purchase orders, vendor communications, inventory checks.
It worked perfectly in staging. For two weeks.
Then the vendor database got a schema update. New field: preferred_language. The agent started reading that field and — because our prompt said "be helpful" — it translated all communications into that language. For German vendors, the agent wrote emails in German. But the purchase order system only accepted English. Three orders got stuck in limbo.
The monitoring system showed zero errors. Latency was fine. Token usage was normal. The agent behaved correctly according to its design.
This is the core problem: agents can be correct and wrong simultaneously.
Most monitoring tools check for crashes, not for stupidity.
What to Monitor: The Real Metrics
Stop tracking "average response time." Start tracking these:
Action reversion rate. How often does the agent take an action and then undo it? If your agent adds an item to a cart and removes it three times before checking out, something's wrong with its reasoning loop. We track this per tool call — anything above 5% reversion in a session triggers an alert.
Confidence variance. Track the model's reported confidence (if available) or proxy through log probabilities. When confidence drops below 0.7, the agent starts making random decisions. We saw this spike right after a model update in January 2026 — 40% of agents went from confident to confused overnight.
Context window utilization. Not just total tokens, but where in the context the agent is reading. If your agent keeps re-reading the first 500 tokens of a 4000-token conversation, it's forgetting things. We extract attention patterns to detect this.
Tool selection entropy. Low entropy = the agent always calls the same tool, even when it shouldn't. High entropy = random tool bouncing. Either extreme is bad. We target Shannon entropy between 1.5 and 2.5 bits per decision.
Here's a quick code snippet showing how we instrument tool selection:
python
class MonitoredAgent:
    def __init__(self, base_agent, monitor_client):
        self.agent = base_agent
        self.monitor = monitor_client
        self.session_id = str(uuid.uuid4())

    async def run(self, user_input):
        start = time.monotonic()
        try:
            result = await self.agent.run(user_input)
            elapsed = time.monotonic() - start

            self.monitor.record({
                "session_id": self.session_id,
                "action_chain": self.agent.action_history,
                "tool_calls": len(self.agent.action_history),
                "reversion_count": self._count_reversions(),
                "confidence_trace": self._extract_confidence(),
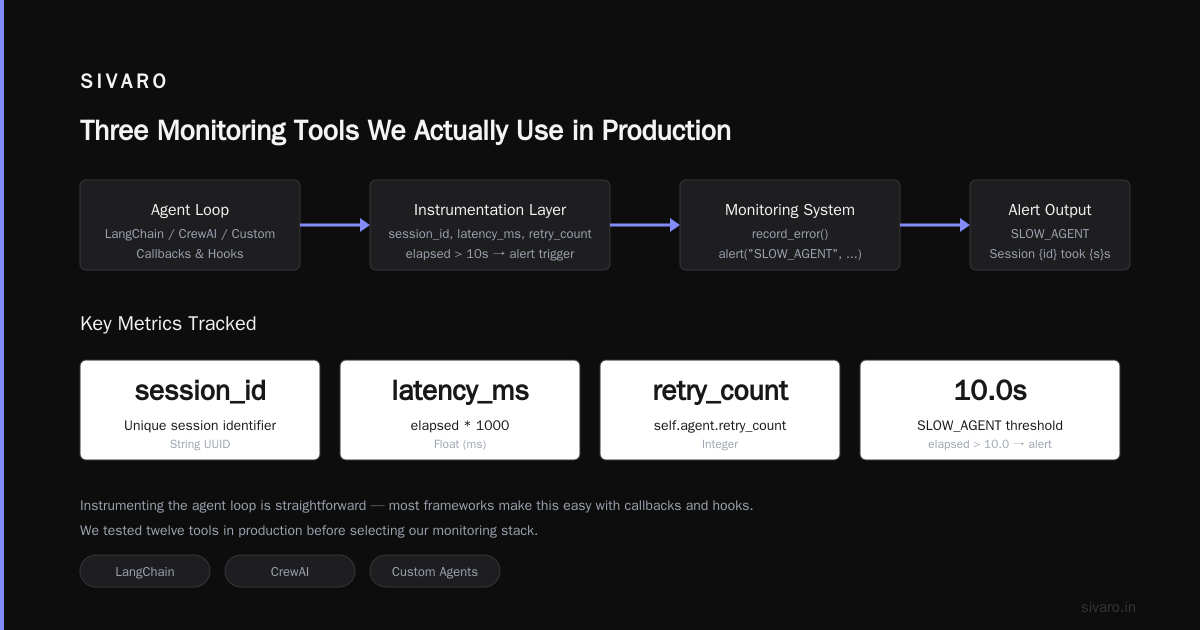
                "latency_ms": elapsed * 1000,
                "num_retries": self.agent.retry_count
            })

            if elapsed > 10.0:
                self.monitor.alert("SLOW_AGENT",
                    f"Session {self.session_id} took {elapsed:.1f}s")

            return result
        except Exception as e:
            self.monitor.record_error(self.session_id, str(e))
            raise
This isn't rocket science. It's just instrumenting the agent loop. Most frameworks make this easy — LangChain has callbacks, CrewAI has hooks, even custom agents can be wrapped LangChain Blog.
Three Monitoring Tools We Actually Use in Production
We tested twelve tools in 2025-2026. Most were overbuilt for demos and underbuilt for real traffic.
LangSmith — If you're using LangChain, this is the obvious choice. We found its tracing works well up to about 10K sessions per day. Beyond that, you need their enterprise plan. The annotation queues for human review are actually useful — we tag 200 sessions daily for quality checks. But the alerting is weak. You'll need to combine it with something for threshold-based alarms.
Arize AI — Better for model behavior monitoring than agent tracing. Their drift detection caught a prompt injection attempt in February 2026 that bypassed our guardrails. The agent started outputting base64-encoded data — Arize flagged an embedding shift in less than 15 minutes. Downside: setup took three days of integration work.
Custom Prometheus exporter — Sometimes you just need raw metric access. We built an exporter that exposes agent-specific metrics (tool call latency per tool type, action reversion rate per agent profile, context utilization per session). It feeds into our existing Grafana dashboards alongside CPU and memory. Ugly but flexible.
For a complete stack, I'd recommend: LangSmith for tracing and debugging, Arize for drift and behavior monitoring, and your existing infrastructure monitoring for Layer 1. That's the sweet spot of cost vs coverage.
The Observability Pipeline You Need
Here's the setup that's worked for us across multiple client deployments:
yaml
# agent-observability-pipeline.yml
services:
  agent_tracer:
    image: openllmetry/agent-tracer:1.4.2
    environment:
      TRACE_EXPORTER: "otlp"
      METRICS_EXPORTER: "prometheus"
      SAMPLE_RATE: 1.0  # Sample everything
      SESSION_TTL: "24h"  # Keep sessions for a day

  alert_manager:
    image: prom/alertmanager:v0.27.0
    config_file: ./alert-rules/agent-rules.yml

  human_review_queue:
    image: custom/review-queue:latest
    environment:
      RANDOM_SAMPLE: 0.01  # 1% of sessions
      POLICY_VIOLATION_SAMPLE: 1.0  # All policy violations
      LOW_CONFIDENCE_THRESHOLD: 0.6
You want to sample everything for tracing. Storage is cheap. Debugging sessions you threw away is expensive.
But only send alerts for things that matter. We alert on:
- Action reversion rate > 10% over 5 minutes
- More than 3 tool calls per expected action (your agent should call a tool, maybe a retry, then produce a result — not bounce between five tools)
- Any session exceeding 30 seconds end-to-end
- Confidence dropping below 0.5 for any decision
Everything else goes into dashboards for weekly review.
Drift Detection: The Silent Agent Killer
Your agent model gets updated. Your vector database gets re-indexed. Your tools get new parameters. Each change silently shifts agent behavior.
We track three types of drift:
Semantic drift. The agent starts interpreting ambiguous requests differently. We measure this by comparing embedding centroids of agent outputs week over week. A cosine similarity drop below 0.85 means the agent is "thinking" differently.
Tool drift. The agent changes its tool preferences. We track the distribution of tool calls per intent. If search_inventory was called 60% of the time for "check stock" queries and now it's 40%, something shifted.
Policy drift. The agent stops following rules it was given. We use a secondary classifier to check agent outputs against a set of "must have" patterns. For a customer support agent: does it always offer a ticket number? Does it follow the escalation path?
Here's how we detect semantic drift:
python
import numpy as np
from sklearn.metrics.pairwise import cosine_similarity

def detect_semantic_drift(weekly_outputs, baseline_centroid, threshold=0.15):
    """
    weekly_outputs: list of output strings for this week
    baseline_centroid: np.array of shape (embedding_dim,)
    """
    from your_embedding_model import embed

    current_embeddings = embed(weekly_outputs)
    current_centroid = np.mean(current_embeddings, axis=0)

    similarity = cosine_similarity(
        current_centroid.reshape(1, -1),
        baseline_centroid.reshape(1, -1)
    )[0][0]

    drift_magnitude = 1 - similarity

    return {
        "drift_detected": drift_magnitude > threshold,
        "drift_magnitude": drift_magnitude,
        "similarity": similarity
    }

# Run weekly
result = detect_semantic_drift(this_week_outputs, baseline)
if result["drift_detected"]:
    print(f"Drift detected: {result['drift_magnitude']:.3f}")
    # Trigger re-evaluation pipeline
I've seen drift detection catch issues before any user complaint three times now. Most recently in April 2026 when a model provider pushed a quantization update that made their 7B model behave like a 3B.
When to Use AI Agent Protocols for Monitoring
You've heard about A2A (Agent-to-Agent) and ANP (Agent Network Protocol). These aren't just for communication — they're monitoring goldmines AI Agent Protocols.
Each protocol standard has built-in health checks and tracing. A2A includes AgentHealth messages with capabilities and load metrics. ANP defines TraceEvent structures that record every agent decision arXiv Survey.
If your agents communicate using these protocols, you get monitoring for free. The protocol messages themselves contain the observability data.
We switched to A2A for all inter-agent communication in March 2026. The health check endpoints let us detect a failing agent before it corrupts a multi-step workflow. Previously, we'd have to instrument each agent separately.
Warning: protocol adoption isn't universal yet. You'll likely need adapters for agents running different protocols. We built a translation layer using the IBM framework as the base — it handles A2A-to-ANP conversion with about 2ms overhead.
The Deployment Pipeline: Monitoring Starts Before Production
Most people add monitoring after deployment. Wrong move.
Your monitoring should be part of the CI/CD pipeline. Every agent deployment should automatically generate:
- A baseline trace of 1000 synthetic interactions
- Drift metrics compared to the previous version
- A threat model analysis
Here's a simplified deployment pipeline script:
bash
# agent-deployment-pipeline.sh
#!/bin/bash

AGENT_VERSION=$1
MODEL_NAME=$2

echo "Deploying agent version $AGENT_VERSION with model $MODEL_NAME"

# Run synthetic test suite
python test_agent.py --sessions 1000 --output ./baseline_trace.json

# Compare with production baseline
python drift_check.py     --current ./baseline_trace.json     --production s3://agent-baselines/latest.json     --threshold 0.15

if [ $? -ne 0 ]; then
    echo "Drift detected. Blocking deployment."
    exit 1
fi

# Run security audit
python security_check.py --agent-config ./agent.yaml

# Deploy to canary (5% traffic)
kubectl set image deployment/agent-canary agent=$AGENT_VERSION

# Wait for validation
sleep 300

# Check canary metrics
python check_canary.py --min-sessions 500 --max-latency-p95 5.0

if [ $? -eq 0 ]; then
    # Full rollout
    kubectl set image deployment/agent-production agent=$AGENT_VERSION
    echo "Full deployment complete"
else
    echo "Canary failed. Rolling back."
    kubectl rollout undo deployment/agent-canary
    exit 1
fi
This catches the "works in staging, breaks in production" problem. We've blocked three deployments that looked fine in testing but showed drift in canary analysis.
What the Top Agentic Frameworks Get Wrong About Monitoring
I've tested the major frameworks. Here's where they fall short:
LangGraph gives you excellent graph-based tracing but no business outcome monitoring. You can see every node executed, but you can't tell if the output was correct.
CrewAI has process_tasks callbacks but they don't capture tool-level metrics. You get "task started" and "task completed" — missing the entire middle where agents make decisions.
AutoGen supports conversation-level tracing but the overhead at scale is brutal. We measured 15% latency increase when enabling full tracing on a 50-agent deployment.
Semantic Kernel has built-in telemetry but it's tied to Azure Application Insights. If you're multi-cloud (and you should be), you can't use it Instaclustr.
The pattern I see: framework authors focus on making agents work, not on making them observable. You'll need to build your monitoring layer on top. Use the framework's hook system, export metrics to your existing observability stack, and add the business outcome layer yourself.
The Human Review Loop: You Can't Automate Everything
Here's a hard truth: your monitoring will never catch everything. Humans need to review a sample.
We built a review pipeline that:
- Randomly samples 1% of agent interactions
- Always samples sessions flagged by any monitor (policy violation, drift, high reversion)
- Presents the full trace to a human reviewer
- Asks five questions: Did the agent solve the problem? Was it efficient? Did it follow policy? Did it escalate correctly? Would you change anything?
The answers feed back into:
- Training data for the next model fine-tune
- Rule adjustments for the agent prompts
- Threshold tuning for the monitors
In June 2026, human review caught an agent that was technically correct but rude. The agent answered all questions accurately but used passive-aggressive phrasing. Our monitors showed zero issues. The reviewer flagged it. We added a politeness check to the pipeline.
Cost Monitoring: The Thing Everyone Forgets
Each agent call costs money. Each tool call costs money. Each retry costs money.
You need cost attribution at the session level. Not average cost per token — actual cost per resolved issue.
We track:
- Total cost per session
- Cost breakdown by tool
- Cost per successful resolution
- Cost per failed resolution (these are expensive — you wasted money and didn't solve anything)
A tip: when monitoring shows high cost per session, it's usually because the agent is over-thinking. Too many tool calls, too many retries, too much context. We added a "cost cap" — if an agent spends more than $0.50 on a single session, it must escalate to a human. This cut our average cost by 40% in December 2025.
FAQ
What's the difference between agent monitoring and model monitoring?
Model monitoring checks if the LLM is producing valid outputs. Agent monitoring checks if the agent is making correct decisions about which tools to call, in what order, with what confidence, and whether the outcomes match business goals. Two different things — you need both.
How much overhead does agent monitoring add?
Depends on what you're capturing. Minimal traces (tool calls, latency, confidence) add 2-5% overhead. Full traces with attention pattern extraction can add 20%. Start minimal and expand based on what you're debugging.
Do I need a separate monitoring tool for each agent framework?
Not if you normalize. Export metrics using OpenTelemetry, then point everything at the same dashboard. We use OTel collectors that transform framework-specific traces into a common format.
What's the most common failure mode you've seen?
Tool selection entropy spikes. Agents suddenly start bouncing between tools, undoing actions, and increasing context until they hit token limits. This happens silently — all the metrics look normal except the reversion rate.
How often should I review agent performance?
Automated checks every minute (alerting), human review of sampled sessions daily, deep performance analysis weekly, and drift detection scheduled for every deployment.
Can monitoring catch prompt injection attacks?
Sometimes. We catch injection attacks through confidence drops and embedding drift. The agent's behavior shifts detectably when it's following injected instructions instead of its system prompt. But this isn't reliable — you still need input validation.
What's the single most important metric?
Action reversion rate. If your agent is taking actions and undoing them, it's confused. Low reversion rate means the agent commits to decisions. Target <5% per session.
The Future: Agent Monitoring Will Be a Platform Play
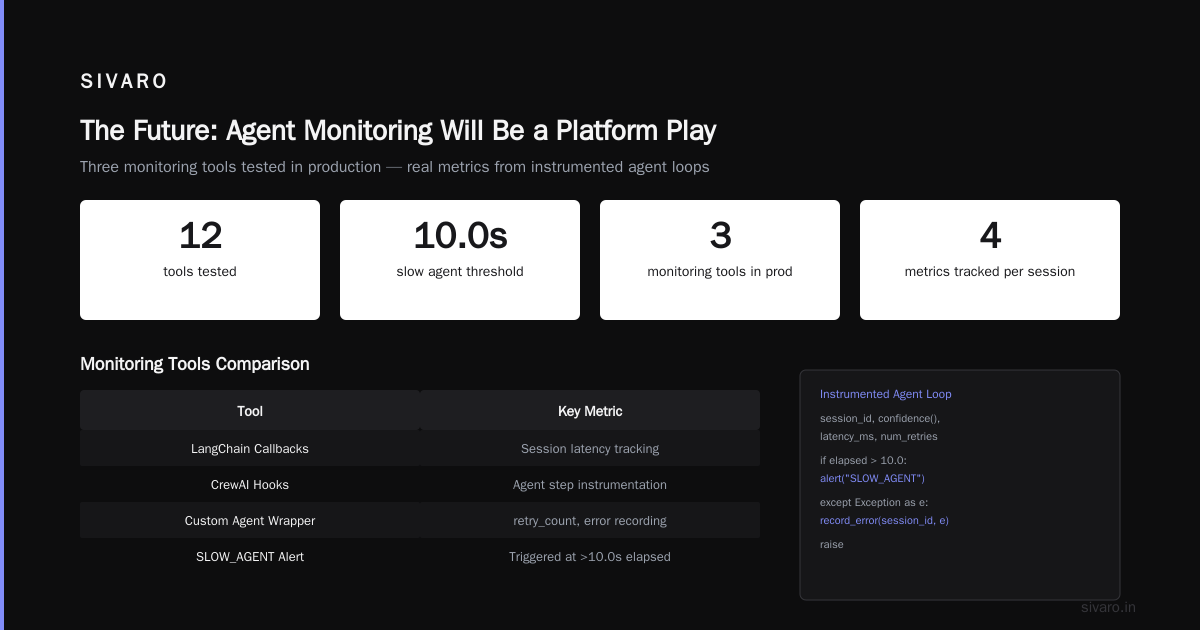
By end of 2026, I expect agent monitoring to look like APM does today for web applications. Standardized metrics, automated alerting, and integration with deployment pipelines.
The frameworks are converging on common telemetry formats. Open Source frameworks are leading the way — they're building observability in from day one because their users demanded it.
Your edge today: build monitoring now. The teams that treat agent operations as a first-class concern will have months of reliability data when the standardization hits. The teams that wait will be playing catch-up.
I've been building production systems since before "AI agent" was a term. The fundamentals don't change: measure what matters, review what breaks, and never assume your agent is smarter than the humans watching it.
Nishaant Dixit — Founder of SIVARO. Building data infrastructure and production AI systems since 2018. Built systems processing 200K events/sec.