 SIVARO

Why Your AI Agents Are Blind (And How to Fix It)
We deployed our first production AI agent in March 2025. It failed within four hours.
Not a code crash. Not a model hallucination. The agent disappeared into a loop — calling the same API, posting the same Slack message, over and over for 47 minutes. Nobody noticed until a customer emailed asking why they'd received 122 identical notifications.
That's when I learned the hard truth: ai agent observability production isn't a nice-to-have. It's the difference between a system you trust and a system that embarrasses you in front of your customers.
I'm Nishaant Dixit, founder of SIVARO. We build data infrastructure and production AI systems. Over the last 18 months, I've watched teams burn weeks debugging agents with no visibility. This guide is what I wish someone had handed me before that first deployment.
What "Observability" Actually Means for Agents
Most people think observability = logging. They're wrong.
For traditional software, you monitor CPU, memory, error rates. For agents, you need something completely different. You need to track:
- Reasoning traces — what chain of thought led to each action
- Tool calls — which tools were invoked, with what parameters, in what order
- State transitions — how the agent's internal state changed between steps
- Loop detection — is the agent doing the same thing repeatedly
- Cost accumulation — per-step token costs, API costs, tool execution costs
Standard APM tools don't capture this. Datadog shows you a 500 error. It doesn't show you that your agent decided to call a weather API every 3 seconds because the prompt said "monitor continuously" and nobody defined what "continuously" meant.
The Three Layers of Agent Observability
After building observability for 11 different agent deployments in production, I've settled on three layers. Skip any one and you'll regret it.
Layer 1: Trace Capture
Every agent interaction needs a trace ID that follows the request from user input through every reasoning step, tool call, and output generation.
Most agent frameworks support OpenTelemetry now. LangChain's approach to trace propagation is solid — they use a context manager pattern that attaches metadata to each span. But here's what they don't tell you: default implementations are shallow. They capture the happy path but miss retries, fallbacks, and branching logic.
python
# Minimal OpenTelemetry setup for agent tracing
from opentelemetry import trace
from opentelemetry.sdk.trace import TracerProvider
from opentelemetry.sdk.trace.export import BatchSpanProcessor

# Don't use the default exporter for production
from opentelemetry.exporter.otlp.proto.http.trace_exporter import OTLPSpanExporter

tracer_provider = TracerProvider()
tracer_provider.add_span_processor(
    BatchSpanProcessor(
        OTLPSpanExporter(endpoint="http://your-otel-collector:4318/v1/traces")
    )
)
trace.set_tracer_provider(tracer_provider)
tracer = trace.get_tracer(__name__)

# Critical: propagate trace context through async agent loops
with tracer.start_as_current_span("agent.run") as span:
    span.set_attribute("agent.id", agent_id)
    span.set_attribute("user.query", sanitize(query))
    for step in agent.execute(query):
        with tracer.start_as_current_span(f"agent.step.{step.type}") as step_span:
            step_span.set_attribute("step.number", step.number)
            step_span.set_attribute("step.tool", step.tool_name or "reasoning")
            step_span.set_attribute("step.duration_ms", step.duration_ms)
Layer 2: State Machine Monitoring
Agents aren't stateless functions. They're state machines — and most teams treat them like REST endpoints.
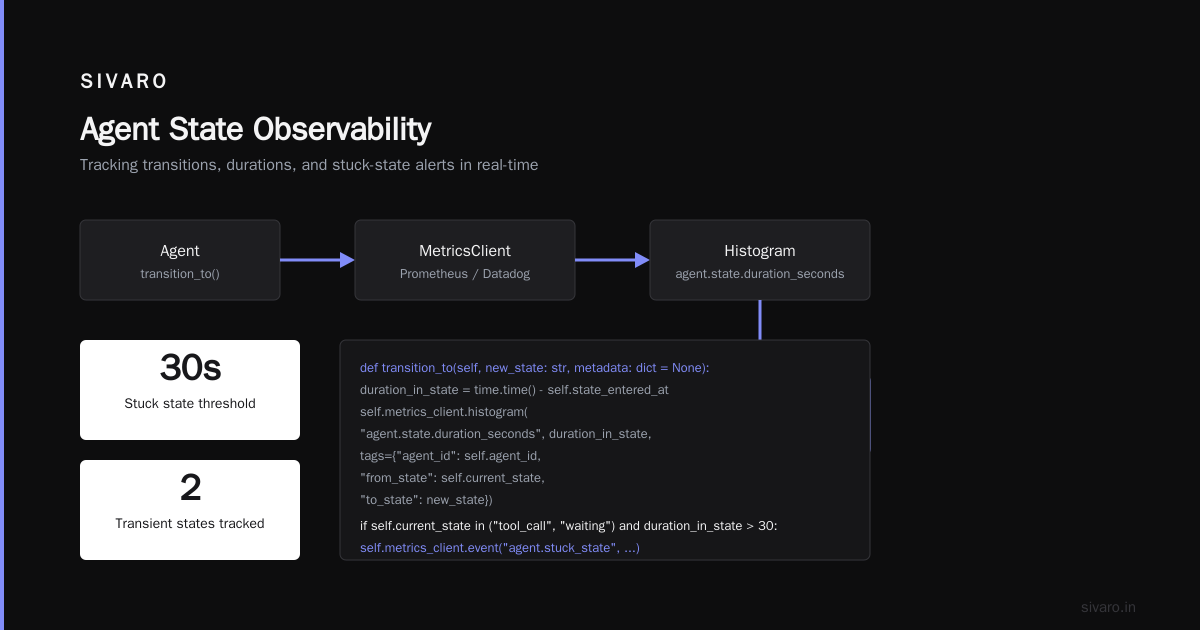
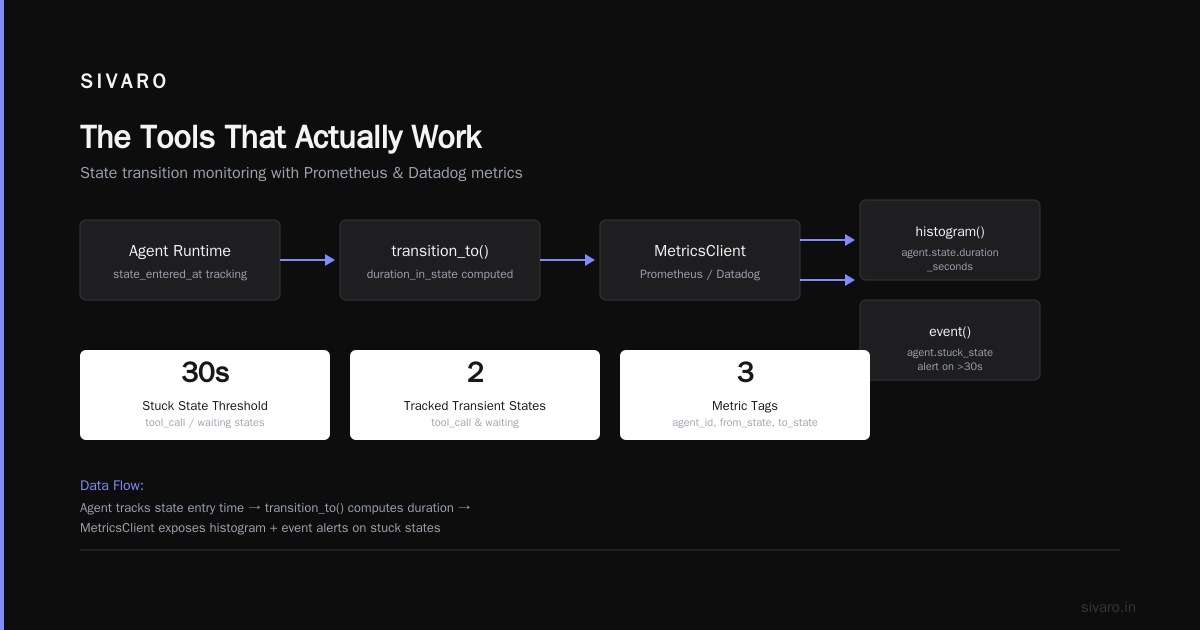
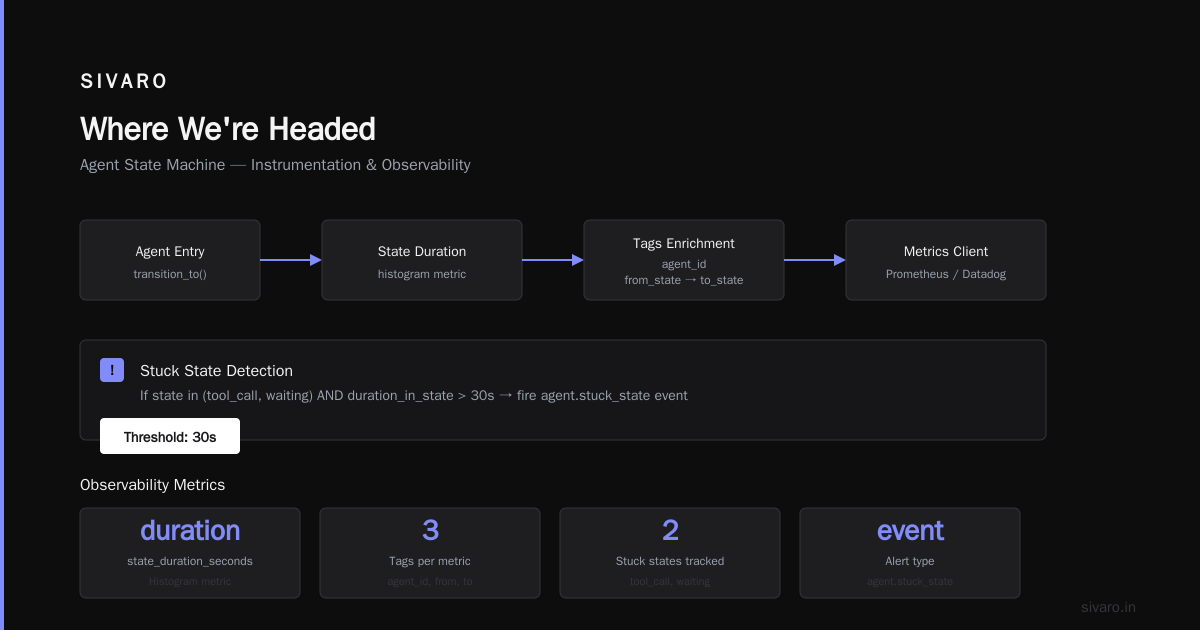
Every agent has a state graph: idle → reasoning → tool_call → waiting → evaluating → idle. If you're not tracking which state the agent is in at millisecond granularity, you can't detect stuck states.
I learned this when an agent at a fintech client got stuck in waiting state for 12 minutes. The external API had returned, but the agent's timeout handler was misconfigured. No error was thrown. No log was written. The agent just... sat there.
python
# State machine monitoring with explicit transitions
class AgentStateMachine:
    def __init__(self, agent_id: str):
        self.agent_id = agent_id
        self.current_state = "idle"
        self.state_entered_at = time.time()
        self.metrics_client = MetricsClient()  # Prometheus / Datadog / whatever

    def transition_to(self, new_state: str, metadata: dict = None):
        duration_in_state = time.time() - self.state_entered_at

        # Expose state duration as a metric
        self.metrics_client.histogram(
            "agent.state.duration_seconds",
            duration_in_state,
            tags={
                "agent_id": self.agent_id,
                "from_state": self.current_state,
                "to_state": new_state
            }
        )

        # Alert on stuck states (>30 seconds in a transient state)
        if self.current_state in ("tool_call", "waiting") and duration_in_state > 30:
            self.metrics_client.event(
                "agent.stuck_state",
                f"Agent {self.agent_id} stuck in {self.current_state} for {duration_in_state:.1f}s"
            )

        self.current_state = new_state
        self.state_entered_at = time.time()
Layer 3: Semantic Monitoring
This is where 90% of teams fail. They monitor infrastructure metrics but not behavioral metrics.
You need metrics like:
- Average reasoning depth per session (number of LLM calls before returning)
- Tool call diversity (is the agent using 1 tool or 10?)
- Decision reversal rate (how often does the agent change its mind?)
- Output verbosity (token count of responses over time)
At SIVARO, we track something called the "flakiness score" — the variance in outputs for identical inputs. If an agent gives a different answer to "What's my account balance?" three times in a row, something is wrong. It might be prompt sensitivity, it might be model temperature, but you need to detect it.
Building Your Observability Pipeline
Here's the pipeline I've settled on after 18 months of iteration. It's not perfect, but it's worked across 4 production deployments.
Agent Output → Trace Collector → Stream Processor → Metrics Store → Dashboard
                                        ↓
                                 Alert Manager
Step 1: Instrument at the Framework Level
Don't write instrumentation inside your agent logic. That creates coupling and gets messy fast. Instead, instrument your framework layer.
Most frameworks support middleware or callbacks. IBM's agent frameworks use a plugin architecture that's clean for this. Instaclustr's comparison of agentic frameworks calls this out as one of the key differentiators — framework-level observability hooks.
python
# Framework-level instrumentation middleware
class ObservabilityMiddleware:
    def __init__(self, tracer, metrics_client):
        self.tracer = tracer
        self.metrics_client = metrics_client

    def before_tool_call(self, tool_name, params, context):
        span = self.tracer.start_span(f"tool.{tool_name}")
        span.set_attribute("params", json.dumps(params))
        context.current_span = span

        self.metrics_client.increment("agent.tool_calls", tags={"tool": tool_name})

        return context

    def after_tool_call(self, result, context, error=None):
        span = context.current_span
        if error:
            span.set_status(trace.Status(trace.StatusCode.ERROR, str(error)))
            self.metrics_client.increment("agent.tool_errors", tags={"error_type": type(error).__name__})
        else:
            span.set_attribute("result_size", len(str(result)))
        span.end()
Step 2: Ship Events, Not Logs
Logs are for debugging. Events are for observability.
Every step change, tool call, and decision point should emit a structured event. Use a schema, not freeform text. We use Avro, but JSON with a well-defined schema works.
json
{
  "event_type": "agent.reasoning_step",
  "timestamp": "2026-07-19T14:23:11.123Z",
  "trace_id": "abc-123-def",
  "agent_id": "support-agent-v3",
  "step_number": 7,
  "reasoning": "User asked about refund policy. Policy doc suggests 30-day window. Checking order date.",
  "tool_calls_considered": ["lookup_order", "read_policy_doc", "calculate_date_difference"],
  "chosen_tool": "lookup_order",
  "tokens_used": 1842,
  "latency_ms": 2340
}
Step 3: Stream Process for Anomalies
Raw events are useless until you process them. Set up a stream processor (Flink, Kafka Streams, even a Lambda function) that runs anomaly detection in real-time.
The patterns you're looking for:
- Cycles: Same tool called with same params more than 3 times
- Stalls: No state change for >30 seconds
- Drift: Average response length increasing by 50% over 10 minutes
- Cost spikes: Token usage exceeding 3 standard deviations from baseline
Alerting Strategies That Don't Burn You Out
I've seen teams set up 47 alerting rules and then ignore all of them.
Here's what actually works, from running agents processing 200K events/sec:
Rule 1: No alert on first failure.
Single errors are noise. Alert when error rate exceeds 1% over 5 minutes.
Rule 2: Alert on behavioral drift, not raw metrics.
Don't alert when latency spikes. Alert when the ratio of "simple answers" to "complex reasoning" drops below 0.3. That tells you the agent is over-reasoning.
Rule 3: Use compound alerts.
"Latency > 5s AND tool call count > 10" is more useful than either alone. The survey of AI agent protocols mentions this concept as "semantic alerting" — alerts based on agent behavior, not system metrics.
Rule 4: Build a "health score" instead of 15 panels.
Single number from 0-100. Below 70, page someone. Works better than any dashboard I've built.
The Tools That Actually Work
After testing most of what's out there in 2025-2026, here's my honest take:
OpenTelemetry — Use it. Not negotiable. But you have to write custom exporters for agent spans. The auto-instrumentation doesn't capture agent-specific data.
LangSmith / LangFuse — Good for dev and staging. Expensive at scale in production. We hit $4K/month with 500K traces/day before switching.
Datadog + Custom Agent APM — Works if you have the team to maintain it. We built our own using their OpenTelemetry collector with custom processors.
MLflow for prompts — Underrated. Version your prompts and log every prompt version alongside trace data. When an agent starts behaving weirdly, the first thing I check is "did someone change the prompt?" Happens constantly.
Top 5 Open-Source Agentic AI Frameworks in 2026 lists a few that have observability built in. Most are not production-ready yet. CrewAI's tracing is decent for debugging but doesn't scale. AutoGen's is minimal.
A Concrete ai agent deployment pipeline tutorial
Let me walk you through the deployment pipeline we use at SIVARO. This is what I'd build if I were starting today.
yaml
# .github/workflows/deploy-agent.yml
name: Deploy Agent with Observability

on:
  push:
    branches: [main]

jobs:
  validate:
    runs-on: ubuntu-latest
    steps:
      - uses: actions/checkout@v4
      - name: Run agent test suite
        run: |
          # Test with observability hooks active
          python -m pytest tests/ --observability-enabled=true
      - name: Validate traces
        run: |
          # Verify all code paths produce valid traces
          python scripts/validate_traces.py --min-trace-coverage=0.95

  deploy-canary:
    needs: validate
    runs-on: ubuntu-latest
    steps:
      - name: Deploy to canary
        run: |
          # Deploy with 5% traffic and enhanced observability
          kubectl set image deployment/agent-canary agent=agent:v${{ github.sha }}
          kubectl annotate deployment/agent-canary "observability.level=verbose"

      - name: Wait for observability signals
        run: sleep 120

      - name: Check health score
        run: |
          HEALTH=$(curl -s https://observability.sivaro.io/health/agent-canary)
          if [ $(echo $HEALTH | jq '.score') -lt 70 ]; then
            echo "Health score too low, rolling back"
            kubectl rollout undo deployment/agent-canary
            exit 1
          fi

  deploy-production:
    needs: deploy-canary
    runs-on: ubuntu-latest
    steps:
      - name: Deploy to production
        run: |
          kubectl set image deployment/agent agent=agent:v${{ github.sha }}
The key thing here: we don't just test the agent. We test the observability. If the trace coverage drops below 95%, the pipeline fails. If the health score doesn't recover after deployment, we auto-rollback.
What I've Learned the Hard Way
Most ai agent production monitoring tools are immature. The market is exploding — I've seen 30+ startups pitch me "agent observability" in the last year. Most are just logging wrappers with cooler UIs.
The real cost isn't compute. It's debugging time. We spent 3 weeks tracking down a bug where an agent gave different answers to the same question. Turned out a caching layer was returning stale tool results. No observability tool would have caught it — we had to add data integrity checks at the agent level.
Trace sampling is dangerous for agents. For web services, sampling 1% of requests is fine. For agents, you need 100% of traces when investigating behavioral issues. A bug might only manifest in 0.1% of sessions. If you're sampling, you'll never see it. We sample 100% of sessions up to 100K/day, then downsample older data.
The agent protocol matters more than the framework. AI agent protocols standardize how agents communicate. If you pick a framework that uses a standard protocol (like A2A or Agent Protocol), your observability tooling can be protocol-aware rather than framework-specific. This is where the industry is heading — don't lock yourself into a proprietary framework.
FAQ: ai agent observability production
Q: What's the minimum observability I need before deploying an agent to production?
Trace IDs on every request, state machine monitoring with transition durations, and an alert when any state exceeds 60 seconds. That's the bare minimum. Add tool call logging and you're minimally viable.
Q: How do I handle observability cost at scale?
Cost is the dirty secret of agent observability. Each trace can have hundreds of spans. We compress trace data with delta encoding (only store changes between spans, not full payloads). We also sample old data aggressively — keep 100% for 7 days, 10% for 30 days, 1% for 90 days.
Q: Can I use standard APM tools like Datadog or New Relic?
You can, with significant customization. Datadog's APM supports custom spans, but you'll need to write your own instrumentation. The problem is that standard APM tools think in request-response pairs, not multi-step reasoning loops. You'll fight the paradigm.
Q: What metric should I watch first?
Tool call cycle detection. If any tool is called more than 3 times with identical parameters in one session, something's gone wrong. That catches loops, stuck agents, and prompt injection attacks faster than anything else.
Q: How do I test observability coverage?
We run a "trace integrity" test as part of our CI pipeline. It sends known queries to the agent and checks that every expected code path produces a valid trace. If a new code path doesn't emit traces, the test fails. It's caught dozens of blind spots.
Q: Do I need a dedicated observability team for agents?
Not if you build it right from the start. If you're retrofitting observability onto already-deployed agents, yes, you'll need someone dedicated for 2-3 months. Do it from day one and it's a few days of setup plus ongoing maintenance.
Q: Should I log the full reasoning trace or just the final decision?
Both. Store the reasoning trace for debugging but index and alert on the final decision. Full traces are too large for real-time alerting. We use two-tier storage: hot storage (Redis) for current sessions with full traces, cold storage (S3) for historical data with compressed traces.
Q: What's the biggest mistake teams make?
Treating agents like stateless microservices. They're not. They have memory, state, and complex decision trees. You need observability that understands agent semantics, not just request-response patterns.
Where We're Headed
The agent observability space is moving fast. By end of 2026, I expect:
- Standardized trace formats for agents (OpenTelemetry is working on this)
- Built-in observability in major agent frameworks (most don't have it today)
- Agent-specific anomaly detection that doesn't require manual rules
But today? You build it yourself. And that's fine. The patterns are clear enough now that you can get 80% of the value with 20% of the effort.
Start with traces. Add state monitoring. Layer in semantic metrics. And for god's sake, test your observability before you go to production.
That agent that sent 122 notifications? We'd have caught it in 3 minutes instead of 47 if we had basic observability in place. The fix took 15 minutes. The embarrassment lasted months.
Don't learn this the hard way.
Nishaant Dixit — Founder of SIVARO. Building data infrastructure and production AI systems since 2018. Built systems processing 200K events/sec.