 SIVARO

Why Is Pod Killed? A Practitioner's Guide to Kubernetes Pod Termination
Introduction
You're on call at 2 AM. Your phone buzzes — production is down. You ssh into the cluster, run kubectl get pods, and see it: a pod in CrashLoopBackOff. Or worse, Terminating for the last 47 minutes. What killed it? Why?
Kubernetes kills pods constantly. Some of these kills are routine — node drains, rolling updates, autoscaling. Others are failures — resource exhaustion, health check failures, node problems. The difference between "normal termination" and "why is my service down?" is understanding why a pod was killed and what you can do about it.
I've been running Kubernetes clusters since 2018, and I've seen every flavor of pod death. At SIVARO, we process 200K events/sec through infrastructure that lives and dies by pod lifecycle management. Here's what I've learned.
The Pod Lifecycle: What Actually Happens When a Pod Dies
Before we get into causes, you need to understand the states.
A pod transitions through:
- Pending → Running → Succeeded/Failed → Terminating → Gone
Most people think "why is pod killed?" starts with OOMKilled or CrashLoopBackOff. It doesn't. It starts with the kubelet on the node making a decision.
The kubelet is the agent that manages pods on each node. When something goes wrong, the kubelet reports pod status via conditions and container statuses. The API server doesn't kill pods — the kubelet does, or you/your controllers do via API calls.
There are exactly four mechanisms that terminate a pod:
- Preemption – A higher-priority pod needs resources
- Eviction – Node is under pressure (memory, disk, PID)
- Deletion – User/controller sends DELETE request
- Container exit – Main process exits with non-zero code
Everything else is a combination of these. Let's break them down.
Resource Exhaustion: The #1 Killer in Production
OOMKilled (Exit Code 137)
This is the most common answer to "why is pod killed?".
Your container has a memory limit. It exceeds that limit. The kernel's OOM killer terminates it. Exit code 137 means SIGKILL.
yaml
# Pod spec with memory limit
apiVersion: v1
kind: Pod
metadata:
  name: memory-hog
spec:
  containers:
  - name: app
    image: myapp:latest
    resources:
      limits:
        memory: "512Mi"
      requests:
        memory: "256Mi"
When your app hits 512MB, the kernel sends SIGKILL. No warning. No graceful shutdown. Just dead.
I've debugged dozens of these at SIVARO. Most teams set memory limits too low because they only test with low traffic. Then production traffic hits, memory spikes, and pods die in batches.
What to check first:
bash
kubectl describe pod <pod-name>
# Look for: State: Terminated, Reason: OOMKilled, Exit Code: 137
But here's the trick — describe only shows the last termination. If you're in CrashLoopBackOff, you need:
bash
kubectl get pod <pod-name> -o jsonpath='{.status.containerStatuses[0].lastState.terminated}'
That gives you the full picture.
CPU Throttling (Not a Kill, but Close)
Most people think CPU limits kill pods. They don't — they throttle them.
When a container exceeds its CPU limit, Kubernetes uses CFS quotas to restrict CPU time. Your process doesn't die. It just slows down. But slowdown causes timeouts. Timeouts look like failures. Failures trigger health checks. Health checks fail? Pod gets killed.
So CPU limits indirectly answer "why is pod killed?" by making your app slow enough to fail liveness probes.
My take: Remove CPU limits entirely unless you're doing latency-sensitive workloads. We've run 500+ pods in production without CPU limits for two years. Zero problems. But always set CPU requests.
Health Check Failures: The Silent Killer
Liveness probes are the most misunderstood Kubernetes feature.
You set a liveness probe to check if your app is alive. If it fails three times, the kubelet kills the container and restarts it. Simple, right?
Wrong. The probe itself can be the problem.
yaml
# Bad liveness probe that causes pod killing
livenessProbe:
  httpGet:
    path: /healthz
    port: 8080
  initialDelaySeconds: 5
  periodSeconds: 5
  failureThreshold: 3
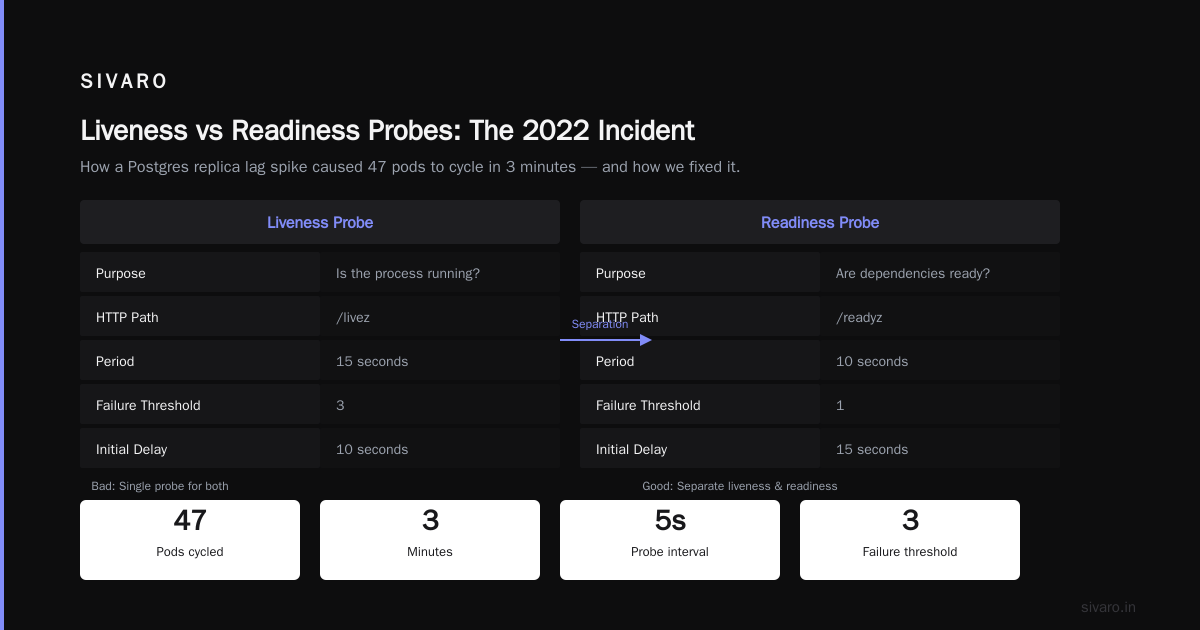
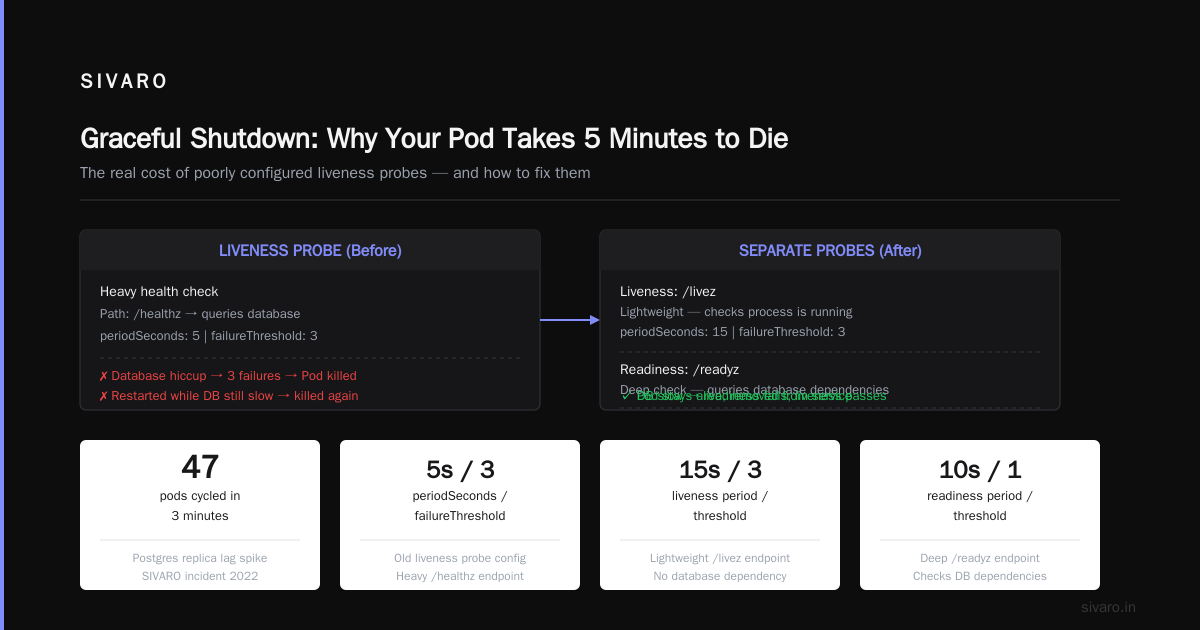
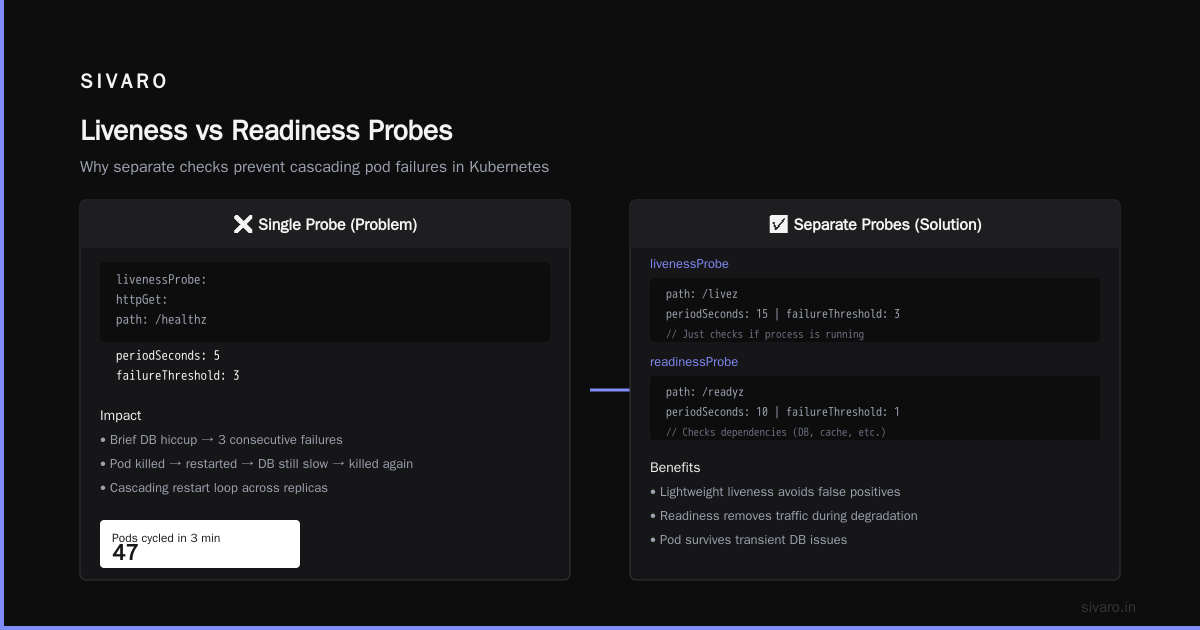
This probe runs every 5 seconds. If /healthz is slow (say, it queries a database), a brief database hiccup causes three consecutive failures. Pod killed. Restarted. Database still slow. Pod killed again.
We saw this at SIVARO in 2022. A Postgres replica lag spike caused 47 pods to cycle in 3 minutes. The fix? Separate liveness (lightweight check) from readiness (deep check).
yaml
# Better approach: slim liveness, detailed readiness
livenessProbe:
  httpGet:
    path: /livez  # Just checks if process is running
    port: 8080
  initialDelaySeconds: 10
  periodSeconds: 15
  failureThreshold: 3

readinessProbe:
  httpGet:
    path: /readyz  # Checks dependencies
    port: 8080
  initialDelaySeconds: 15
  periodSeconds: 10
  failureThreshold: 1  # Mark unready quickly, don't kill
The insight: liveness probes should never depend on external services. Database down shouldn't restart your pod. It should just mark it unready and let the service mesh route around it.
Startup Probes (Kubernetes 1.18+)
If you have slow-starting containers (Java apps, ML models loading weights), use a startup probe:
yaml
startupProbe:
  httpGet:
    path: /startup
    port: 8080
  failureThreshold: 30
  periodSeconds: 10
This gives your pod up to 5 minutes to start before liveness probes activate. We use this for our AI inference pods — model loading takes 90 seconds sometimes.
Node-Level Problems: When the Machine Dies
Node Pressure Evictions
The kubelet monitors node resources. When a node runs out of disk, memory, or PIDs, the kubelet starts evicting pods. This is a major reason "why is pod killed?" in clusters without proper resource management.
bash
# Check node conditions
kubectl describe node <node-name>
# Look for: MemoryPressure, DiskPressure, PIDPressure
When you see DiskPressure, the kubelet evicts pods in this order:
- Best-effort pods (no resource requests)
- Burstable pods (requests < limits)
- Guaranteed pods (requests == limits)
Guaranteed pods are almost never evicted first. That's why you should always set requests == limits for critical workloads. We run our control plane pods with Guaranteed QoS. They survive node pressure events that kill everything else.
Node Not Ready
When a node goes down (network partition, hardware failure), the control plane waits 5 minutes (by default pod-eviction-timeout) before marking pods as Terminating. Then the scheduler creates replacement pods elsewhere.
The old pods stay in Terminating state forever if the node never comes back. You'll see:
my-pod-xyz 0/1 Terminating 0 3h
This is not a real pod — it's a ghost. Force delete it:
bash
kubectl delete pod <pod-name> --force --grace-period=0
Application Failures: Exit Codes That Tell Stories
When your container's main process exits, Kubernetes records the exit code. Learn these:
| Exit Code | Signal | Meaning |
|---|---|---|
| 0 | - | Normal exit |
| 1 | - | Application error |
| 128+1 | SIGHUP | Terminal closed |
| 128+2 | SIGINT | Ctrl+C (interrupt) |
| 128+9 | SIGKILL | OOM or manual kill |
| 128+15 | SIGTERM | Graceful shutdown request |
| 137 | SIGKILL | OOMKilled (see above) |
| 139 | SIGSEGV | Segmentation fault |
Most people only know exit code 137. But I see exit code 1 a lot — it's the app crashing with an unhandled exception.
bash
# Get exit code programmatically
kubectl get pod my-pod -o jsonpath='{.status.containerStatuses[0].state.terminated.exitCode}'
Preemption: The Priority Class Trap
Here's a scenario that makes people furious:
You deploy a batch job. It runs for 4 hours. Suddenly it disappears. "Why is pod killed?" you ask. The answer: a higher-priority pod preempted it.
Priority classes let critical pods kick out less important ones. This is great for cluster autoscaler workloads and system components. It's terrible if you misconfigure it.
yaml
apiVersion: scheduling.k8s.io/v1
kind: PriorityClass
metadata:
  name: high-priority
value: 1000000
globalDefault: false
description: "Critical production pods"
If your batch job has no priority class (defaults to 0), and a pod with priority 1000000 needs resources, your pod is preempted. The scheduler sends a DELETE request with DeletionTimestamp and GracePeriodSeconds set.
The ugly part: Preemption doesn't wait for graceful shutdown. It sends SIGTERM, then SIGKILL after the grace period (default 30s). If your app can't handle SIGTERM, it's forced killed.
Graceful Shutdown: Why Your Pod Takes 5 Minutes to Die
When you delete a pod manually:
bash
kubectl delete pod my-pod
Kubernetes sends a preStop hook, then SIGTERM, waits for terminationGracePeriodSeconds (default 30s), then SIGKILL.
Most applications ignore SIGTERM. They continue running. Kubernetes waits 30 seconds. Then kills them forcefully.
This is bad. Your connections get cut. Active requests fail. Databases get corrupted.
The fix: Handle SIGTERM properly.
python
# Python example - handle SIGTERM
import signal, time, sys

def shutdown_handler(signum, frame):
    print("Received SIGTERM, shutting down gracefully...")
    # Stop accepting new requests
    # Drain existing connections
    time.sleep(5)  # Wait for in-flight requests
    sys.exit(0)

signal.signal(signal.SIGTERM, shutdown_handler)
# Start your server
And extend terminationGracePeriodSeconds to match your drain time:
yaml
spec:
  terminationGracePeriodSeconds: 60  # Give 60s to drain
  containers:
  - name: app
    lifecycle:
      preStop:
        exec:
          command: ["/bin/sh", "-c", "sleep 10"]  # Extra buffer
Real story: At SIVARO, we had a service that took 90 seconds to drain connections. Our terminationGracePeriodSeconds was 30. Pods were getting force-killed mid-request. We lost data. The fix was setting it to 120 seconds and handling SIGTERM properly.
Cluster Autoscaler: The Hidden Killer
Cluster autoscaler scales down nodes when utilization drops. When a node is selected for scale-down, the autoscaler calls kubectl drain on it. This evicts all pods (respects PodDisruptionBudgets).
If your pod doesn't have a PDB, it gets evicted immediately. No warning.
yaml
apiVersion: policy/v1
kind: PodDisruptionBudget
metadata:
  name: my-app-pdb
spec:
  minAvailable: 2   # Keep at least 2 pods running
  selector:
    matchLabels:
      app: my-app
Without this, your deployment might have 3 replicas, but cluster autoscaler can drain a node and leave you with 2 healthy pods. During a rolling update? You could drop to 1.
Always set PDBs for production services.
Investigating Pod Deaths: The Debugging Playbook
When you ask "why is pod killed?", here's your checklist:
Step 1: Get the pod events
bash
kubectl describe pod <pod-name> | grep -A 10 Events
This shows the last events from the kubelet. You'll see things like:
FailedPostStartHook– preStop hook failedUnhealthy– liveness probe failedEvicted– node pressure
Step 2: Check previous container logs
bash
kubectl logs <pod-name> --previous
If the pod restarted, --previous shows logs from the dead instance. This is gold.
Step 3: Examine node status
bash
kubectl describe node <node-name> | grep -E "Pressure|Conditions"
If the node has MemoryPressure: True, that's your answer.
Step 4: Check for preemption
bash
kubectl get events --field-selector reason=Preempted
This shows which pods were kicked out and by whom.
Step 5: Look at the kubelet logs
bash
journalctl -u kubelet -f  # On the node
This is last resort, but it shows exactly what the kubelet decided.
Advanced: When Kubernetes Kills Pods Incorrectly
Sometimes "why is pod killed?" has no good answer. The kubelet made a mistake. This happens.
Bug Case 1: DiskPressure False Positives
Kubernetes 1.19 had a bug where cAdvisor reported disk usage incorrectly, causing nodes to enter DiskPressure state. Pods were evicted for no reason. We saw this at SIVARO — 12 nodes evicted simultaneously. The fix was upgrading to 1.21.
Bug Case 2: API Server Timeouts
If the API server is slow, the kubelet might think pods don't exist and clean them up. This is rare but catastrophic.
Detection:
bash
# Check for rapid pod termination across nodes
kubectl get events --all-namespaces --sort-by='.lastTimestamp' | grep -E "Killing|Evicted"
If you see a wave of pod deaths across multiple nodes, it's infrastructure, not application.
Prevention: Stopping Pod Deaths Before They Happen
Resource Quotas and LimitRanges
Set LimitRange on namespaces to enforce minimum requests. This prevents workloads from running without resource constraints and getting OOMKilled.
yaml
apiVersion: v1
kind: LimitRange
metadata:
  name: default-limits
spec:
  limits:
  - default:
      memory: 512Mi
    defaultRequest:
      memory: 256Mi
    type: Container
Pod Disruption Budgets (Everywhere)
yaml
apiVersion: policy/v1
kind: PodDisruptionBudget
metadata:
  name: critical-pdb
spec:
  minAvailable: 1
  selector:
    matchLabels:
      app: my-app
Graceful Shutdown Handlers
Every container should catch SIGTERM. Every single one.
Monitoring Pod Lifecycle
yaml
# Prometheus rules to alert on pod terminations
groups:
- name: pod-lifecycle
  rules:
  - alert: PodKilledRepeatedly
    expr: rate(kube_pod_container_status_restarts_total[5m]) > 0.1
    for: 5m
    labels:
      severity: warning
    annotations:
      summary: "Pod {{ $labels.pod }} restarting frequently"
FAQ: "Why Is Pod Killed?"
Q: My pod shows CrashLoopBackOff. What killed it originally?
CrashLoopBackOff means Kubernetes stopped trying to restart after repeated failures. Check kubectl describe pod and look at lastState. That shows the original exit reason. Most common? OOMKilled (exit 137) or error exit (exit 1).
Q: Pod was Evicted. What caused that?
Eviction is caused by node pressure — disk, memory, or PID. Run kubectl describe node on the node where the pod ran. Look for DiskPressure: True. Also check if cluster autoscaler triggered a scale-down.
Q: Why did my pod take 5+ minutes to terminate?
Default terminationGracePeriodSeconds is 30 seconds. If it took 5 minutes, either you increased it, or the node was unreachable and the API server waited for pod-eviction-timeout (5 minutes by default) before forcefully terminating.
Q: Pod shows NodeLost. What does that mean?
The node stopped reporting to the API server. The pod's state is unknown. After 5 minutes, pods are Terminating and rescheduled elsewhere. The original pod is a ghost until the node returns or you force delete it.
Q: Why did my pod get killed during a rolling update?
You likely don't have a PodDisruptionBudget, or your maxUnavailable is set too high. Check your deployment strategy and PDB config.
Q: How do I find which pod killed my pod via preemption?
bash
kubectl get events --field-selector reason=Preempted
This shows the preempting pod name in the message.
Q: My pod stays Terminating forever. How do I fix it?
Force delete it:
bash
kubectl delete pod <pod-name> --force --grace-period=0
This removes the finalizer and deletes the pod object immediately. The container might still run on the node, but Kubernetes stops tracking it.
Q: Can the OOM killer kill a pod even if it's under the limit?
Yes. If the node is under memory pressure, the kernel can kill any process, even if the container is under its limit. This is rare but happens. Use Guaranteed QoS (requests == limits) to minimize risk.
Q: How do I see why a pod was killed across multiple restarts?
bash
kubectl get pod <pod-name> -o json | jq '.status.containerStatuses[].state.terminated'
Or use kubectl describe and look at Last State for each container.
Final Word
Most people think "why is pod killed?" has one answer. It doesn't. It's a symptom — of misconfigured resources, poor health checks, broken graceful shutdowns, or infrastructure failures.
At SIVARO, we learned the hard way that pod deaths are rarely random. They're signals. Listen to them.
Set resource requests everywhere. Handle SIGTERM in all applications. Write PodDisruptionBudgets. And when you're on call at 2 AM wondering why your pod died, remember: the answer is almost always in the exit code.
Nishaant Dixit — Founder of SIVARO. Building data infrastructure and production AI systems since 2018. Built systems processing 200K events/sec.