 SIVARO
What Does It Mean When Data is Disaggregated?
I got a call from a FinTech startup in late 2025. Their fraud detection system kept missing attacks. The data team showed me aggregated transaction totals per hour. Everything looked normal. I asked to see the disaggregated logs – individual transactions, per user, per device. That's when we found the pattern. 200 identical micro-transactions from a single IP, hidden in a sea of averages. So what does it mean when data is disaggregated? It means you stop looking at the ocean and start examining the drops.
Disaggregated data is raw, atomic, granular. It's the unrolled version of your data before you sum it, average it, or bucket it into summary tables. Every row, every event, every interaction preserved as-is. No grouping. No aggregation. Just the truth at its most detailed level.
This guide covers three things. First, what disaggregation actually means in practice – not the textbook definition, but how it changes your systems. Second, why your latency depends on it more than you think. Third, when disaggregation hurts you and you should stop doing it.
Let's get specific.
The Worst Mistake I See in Data Pipelines
Most engineering teams think disaggregation is about storage. They're wrong. It's about query semantics.
Here's what I mean. You have a table called user_sessions. Someone aggregated it by hour because the dashboard "only needed hourly data." Six months later, a data scientist needs to debug a model that failed on a specific user at 3:47 PM on a Tuesday. That person's data is gone. Not lost – destroyed by aggregation.
Disaggregated Data Explained Clearly puts it bluntly: aggregation is destruction. Once you sum, you can't un-sum. Once you average, you lose variance. You can't ask new questions of old data if you've already thrown away the details.
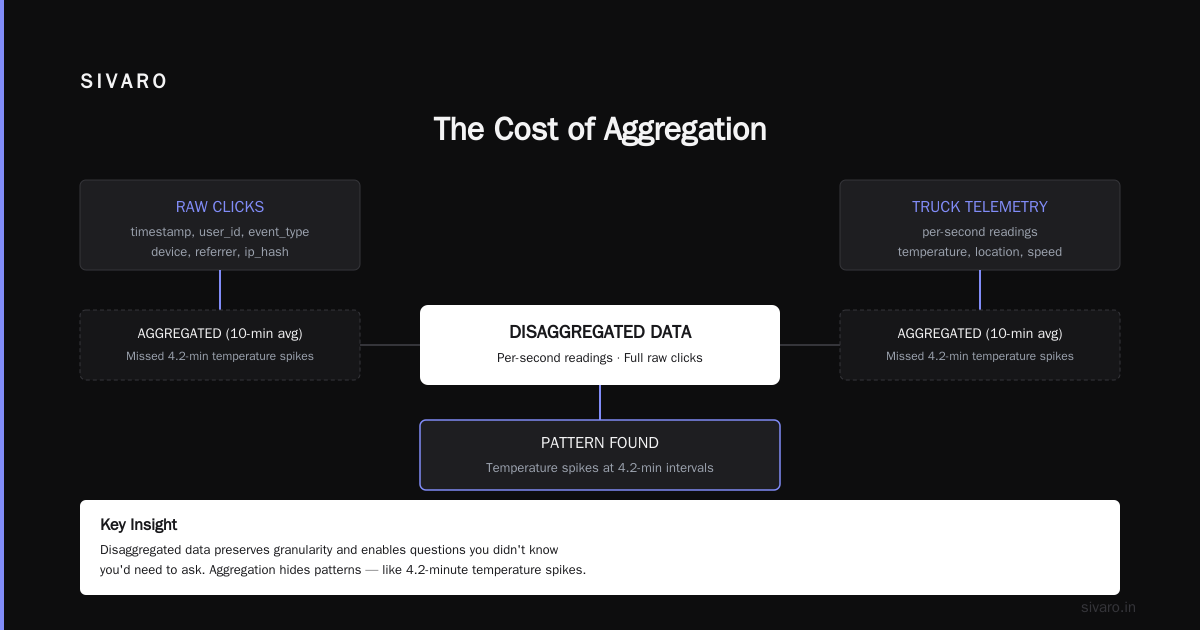
I've seen this pattern at a dozen organizations. Marketing teams roll up click data by campaign. Great for the dashboard. Terrible when someone wants to build a real-time personalization engine. The engineer building that engine needs every click, with timestamps, user IDs, referrer headers, device fingerprints. They need disaggregated data.
The alternative? Keep the raw data in a separate table. Run your aggregates on a materialized view. Don't lose the source of truth. Aggregation and Disaggregation calls this "preserving granularity while enabling summary queries." That's the right design.
What Does It Mean When Data is Disaggregated in Practice?
Let's get concrete. Disaggregation happens in three dimensions.
Compute disaggregation separates storage from processing. Your data lives in object storage (S3, GCS). Compute engines spin up only when querying. This isn't new – Snowflake popularized it in 2014, ClickHouse took it further in 2019. But most teams still don't architect for it correctly. They put compute and storage together and wonder why scaling costs explode.
Storage disaggregation breaks tables into smaller physical chunks. Partitioning by date is the simplest form. But real disaggregation goes deeper – each row stands alone, with its own schema evolution, its own lifecycle. You can delete one bad user's data without touching anything else.
Time disaggregation is the one nobody talks about. Data isn't a snapshot – it's a stream. Disaggregated by time means every event carries its own timestamp, and you never batch them into 5-minute windows unless you absolutely must.
Here's what time disaggregation looks like in practice:
python
# Wrong: aggregated by 5-minute window
def log_event_bad(user_id, event_type, timestamp):
    window_start = floor_to_5_min(timestamp)
    clickhouse.execute(
        f"INSERT INTO aggregated_clicks VALUES ({window_start}, {user_id}, '{event_type}', 1)"
    )
    # This destroys all sub-5-minute temporal patterns

# Right: disaggregated, raw event
def log_event_good(user_id, event_type, timestamp, device, referrer, ip_hash):
    clickhouse.execute(
        f"INSERT INTO raw_clicks VALUES ({timestamp}, {user_id}, '{event_type}', '{device}', '{referrer}', '{ip_hash}')"
    )
    # This preserves everything
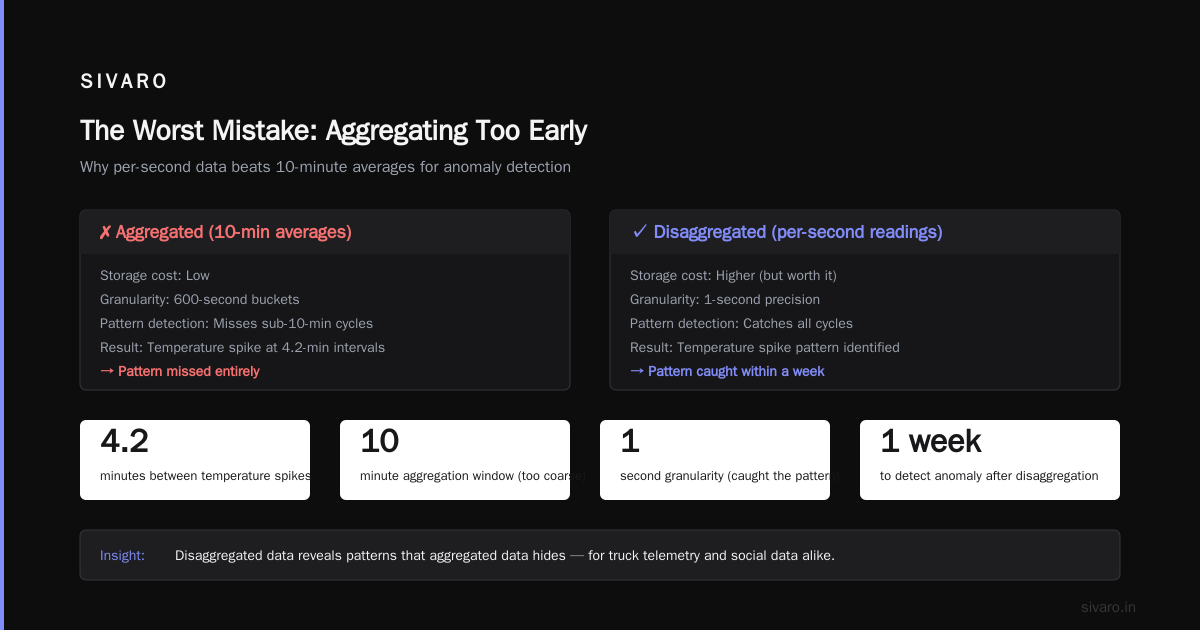
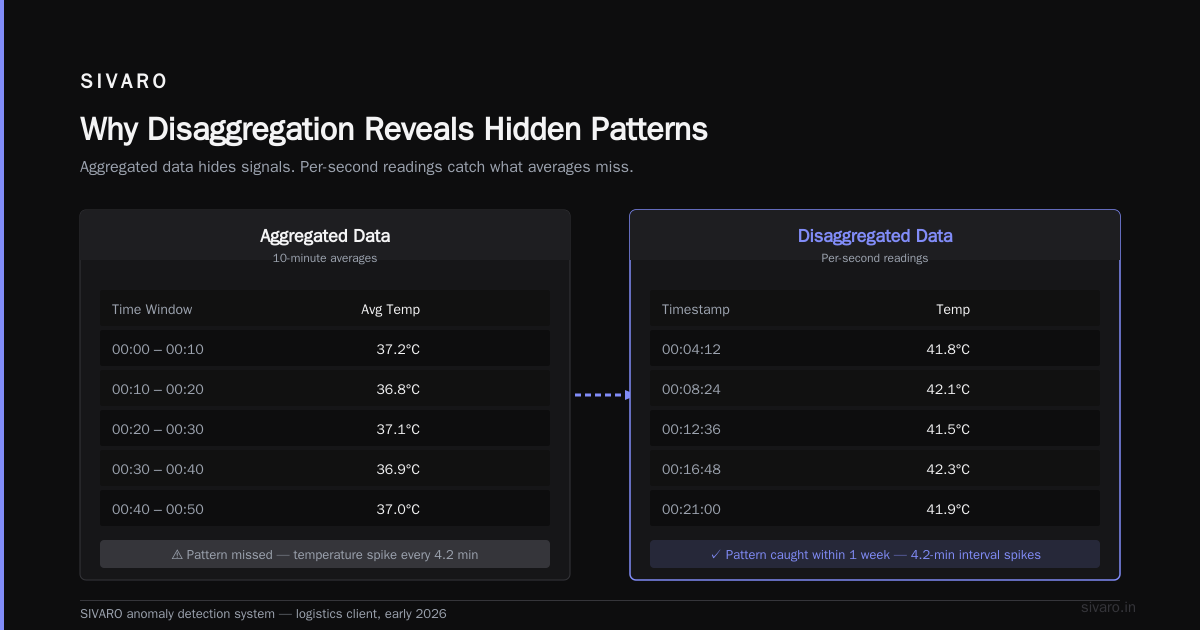
The second version costs more storage. It also enables questions you didn't know you'd need to ask. At SIVARO, we built a real-time anomaly detection system for a logistics client in early 2026. They had aggregated truck telemetry into 10-minute averages. Missed a pattern where temperature spikes happened at exactly 4.2-minute intervals. Disaggregating to per-second readings caught it within a week.
Why do we disaggregate data and how can it help people? makes a similar point for social data: "Disaggregated data can reveal patterns that aggregated data obscures, particularly for smaller groups." The principle is universal.
The Difference Between Aggregated and Disaggregated Data Systems
Two system designs. One works for dashboards. The other works for everything.
Aggregated system: Pre-compute summary tables. Query them instantly. Four queries total: daily active users, revenue by region, sessions per browser, churn rate. Great for a static CEO report. Terrible for anything involving "why."
Disaggregated system: Store every event. Use a query engine that can scan billions of rows fast (ClickHouse, DuckDB, or a well-indexed Postgres with partitioning). Ask any question – "show me users who visited the pricing page three times but never converted, filtered by cohort from last month." That query is impossible on aggregated data.
Here's the tradeoff: aggregated systems return results in 50ms. Disaggregated systems might take 2 seconds. But the aggregated system can't answer your second question. The disaggregated system can answer all of them.
Disaggregating data and assessing inequities from Massachusetts government gives a concrete example: "Aggregated data on student performance may show an overall pass rate of 80%. But disaggregating by race, income, and disability status may reveal that certain groups have pass rates below 50%." That insight is invisible without granularity.
Which system should you build? Both. Store disaggregated raw data. Build materialized aggregates on top. Set TTL on the aggregates to expire faster than the raw data. You get speed for common queries and flexibility for everything else.
What happens when you disaggregate your student success data shows this exact pattern for education analytics. Keep the raw transcripts, build aggregated dashboards on top. Discover that Pell Grant recipients have different dropout patterns than non-recipients. That finding came from disaggregation.
The Social Equity Imperative: It's Not Just About Speed
Here's where most engineers tune out. They shouldn't.
Disaggregated data isn't just a technical choice. It's a fairness choice. Race data disaggregation: What does it mean? Why does it matter? states clearly: "Aggregated data can hide significant disparities between subgroups. A single 'Asian American' category masks differences between Chinese, Vietnamese, Hmong, and Indian populations."
This applies to your product data too. "All users" averaged might look fine. But disaggregate by device type, and Android users have a 40% higher error rate. Disaggregate by network type, and 5G users have perfect latency while 4G users time out. Disaggregate by app version, and version 2.3.1 crashes on login.
I've seen this kill products. A SaaS company in 2024 aggregated all crash reports. Overall crash rate: 0.3%. Looked great. They disaggregated by browser extension – one specific ad blocker caused 60% of crashes for 2% of users. Those users churned because nobody fixed the bug they couldn't see.
Glossary: Disaggregated data | Monitoring Guide defines disaggregation as "the breaking down of data into smaller units to reveal patterns and trends." That's the technical half. The ethical half is: patterns you can't see hurt real people.
WHAT IS DATA DISAGGREGATION? from SEARAC adds: "Communities that are small in number are often rendered invisible when their data is lumped into larger categories." Your users in Rural Wyoming with slow DSL are a community too. Aggregate them into "United States" and they vanish.
The Contrarian Take: What Does It Mean When Data is Disaggregated and You Shouldn't Do It
Most people think disaggregation is always better. They're wrong.
Disaggregation carries real costs.
Storage cost. Raw data is bigger. Columnar compression helps – ClickHouse can compress some data 10x. But it's still more expensive than storing only aggregates. At SIVARO, we estimate disaggregated storage costs 3-5x more than aggregated for the same data volume.
Query performance. Scanning billions of rows takes time. If you need sub-50ms responses on every query, you can't query raw data directly. You need pre-computed aggregates or an OLAP cube. Disaggregated Data Explained Clearly warns: "Disaggregation without proper indexing or materialization can lead to query times that frustrate users."
Engineering complexity. Raw schemas change. Events drift. Timestamps have timezone issues. Nulls propagate. You need schema-on-read, schema evolution handling, and robust data quality checks. Aggregated pipelines are simpler.
Privacy risk. Disaggregated data is more identifiable. A single row with user ID, timestamp, and IP address is PII. Aggregate that same data by hour and you've reduced privacy risk significantly. GDPR and CCPA compliance gets harder with disaggregation.
So when should you NOT disaggregate?
Real-time dashboards that need single-digit millisecond responses. Billing systems that only need monthly totals. Compliance reports where granular data adds liability without value. Initial MVPs where you don't yet know which patterns matter.
Here's a practical filter: if you can't name three queries you'd run on disaggregated data that aggregates can't answer, you probably don't need it yet. Add it when the questions emerge.
How to Implement Disaggregation Without Blowing Up Your Costs
I've learned this the hard way. Four patterns that work.
Pattern 1: Tiered storage with automatic aggregation
Store raw events in object storage (S3, GCS). Run hourly aggregation jobs that produce materialized views. Query the views for dashboards, scan the raw data for ML training.
sql
-- Create materialized view for common queries
CREATE MATERIALIZED VIEW hourly_user_stats
ENGINE = AggregatingMergeTree
PARTITION BY toYYYYMM(hour)
ORDER BY (hour, user_id)
AS SELECT
    toStartOfHour(timestamp) AS hour,
    user_id,
    countState() AS event_count,
    avgState(duration_ms) AS avg_duration
FROM raw_events
GROUP BY hour, user_id;
This gives you both. Raw data keeps disaggregated. Common queries hit the view and return in 10ms.
Pattern 2: Partitioning that matches query patterns
Don't partition randomly. Partition by the columns you filter on most. Date range queries need date partitions. Tenant ID queries need tenant partitions.
sql
CREATE TABLE raw_events (
    tenant_id UInt32,
    timestamp DateTime,
    event_type String,
    payload String
)
ENGINE = MergeTree
PARTITION BY (tenant_id, toYYYYMMDD(timestamp))
ORDER BY (tenant_id, timestamp);
This is disaggregated but optimized for your access pattern. Each partition is small. Queries only scan relevant data.
Pattern 3: Sampling for exploration, full data for production
Data scientists don't always need full granularity for exploratory analysis. Give them sampled disaggregated data. They can iterate hypotheses on 1% of events. Only use full data when they need to deploy.
python
# Create a 1% sample table for exploration
# Use the hash-based sampling trick
CREATE TABLE raw_events_sample AS raw_events
ENGINE = MergeTree
ORDER BY (tenant_id, timestamp);

INSERT INTO raw_events_sample
SELECT * FROM raw_events
WHERE cityHash64(user_id) % 100 = 0;
Pattern 4: TTL-based pruning
Not all disaggregated data needs to live forever. Set time-to-live on raw data.
sql
ALTER TABLE raw_events
MODIFY TTL timestamp + INTERVAL 90 DAY;
90 days disaggregated. After that, it hits aggregation tier. After 2 years, it's gone. This balances cost with flexibility.
Real-World Example: Fixing a Broken Recommendation System
Here's a concrete case from my work. A media streaming company in early 2026 had a recommendation engine that worked terribly for first-time users. They stored aggregated "watch history" – total minutes per genre, per user, per week.
Disaggregated to per-second viewing events.
Found the pattern immediately: new users watched 47 seconds of content on average before abandoning. Aggregated data showed "2.3 minutes watched" because they were averaging in users who'd been on the platform for years. Disaggregating by account age revealed the truth.
They fixed onboarding in two weeks. Watch completion for new users went from 12% to 41%.
Disaggregation didn't just reveal the problem – it enabled the solution. They could build a model that predicted abandonment at the 45-second mark and dynamically inserted a hook. The model needed per-second event data. Aggregates were useless.
FAQ: What Does It Mean When Data is Disaggregated?
Q: What's the simplest definition?
Disaggregated data is data that hasn't been summed, averaged, or grouped. Each individual record exists as its own row. No pre-computation.
Q: How do you actually do it in a database?
Stop running GROUP BY in your ingestion pipeline. Store raw events in a columnar format (Parquet, ClickHouse, DuckDB). Run queries with GROUP BY at read time, not write time.
Q: Does disaggregation always mean more server cost?
Initially yes. But columnar compression narrows the gap significantly. ClickHouse stores raw event data at roughly 1-3 bytes per event after compression. For most workloads, the storage cost is negligible compared to the engineering cost of recovering lost data.
Q: Can you over-disaggregate?
Yes. Don't store individual keystrokes when you only need page-level events. Disaggregation has diminishing returns. Ask: "What's the smallest unit of data I will ever query?" Disaggregate to that level, not below.
Q: How does this relate to data mesh?
Data mesh is an organizational pattern for disaggregation. Each domain owns its finest-grained data and exposes aggregated views to other domains. The principle is the same: keep raw data with the team that understands it.
Q: What's the difference from data partitioning?
Partitioning splits data by a key (usually date). Disaggregation preserves individual records. You can have partitioned disaggregated data – that's the ideal state.
Q: Is disaggregation a feature of specific databases?
Some enforce aggregation (most time-series DBs before 2020). Modern systems support both. ClickHouse, DuckDB, Snowflake, and Databricks all handle disaggregated data well. The question isn't database support – it's workflow design.
Final Take
What does it mean when data is disaggregated? It means you've chosen flexibility over convenience, truth over speed. You accept that queries might take 2 seconds instead of 50ms, but you can ask any question. You accept that storage costs more, but you never destroy information that took real effort to collect.
I've learned this the hard way across a dozen production systems. Every time I've aggregated early, I've regretted it. Every time I've kept data disaggregated, I've found patterns I would have otherwise missed.
Store it raw. Build aggregates on top. Never destroy the source of truth.
Your future self – the one debugging a production incident at 3 AM – will thank you.
Nishaant Dixit — Founder of SIVARO. Building data infrastructure and production AI systems since 2018. Built systems processing 200K events/sec.