 SIVARO

What Does It Mean to Disaggregate a Population?
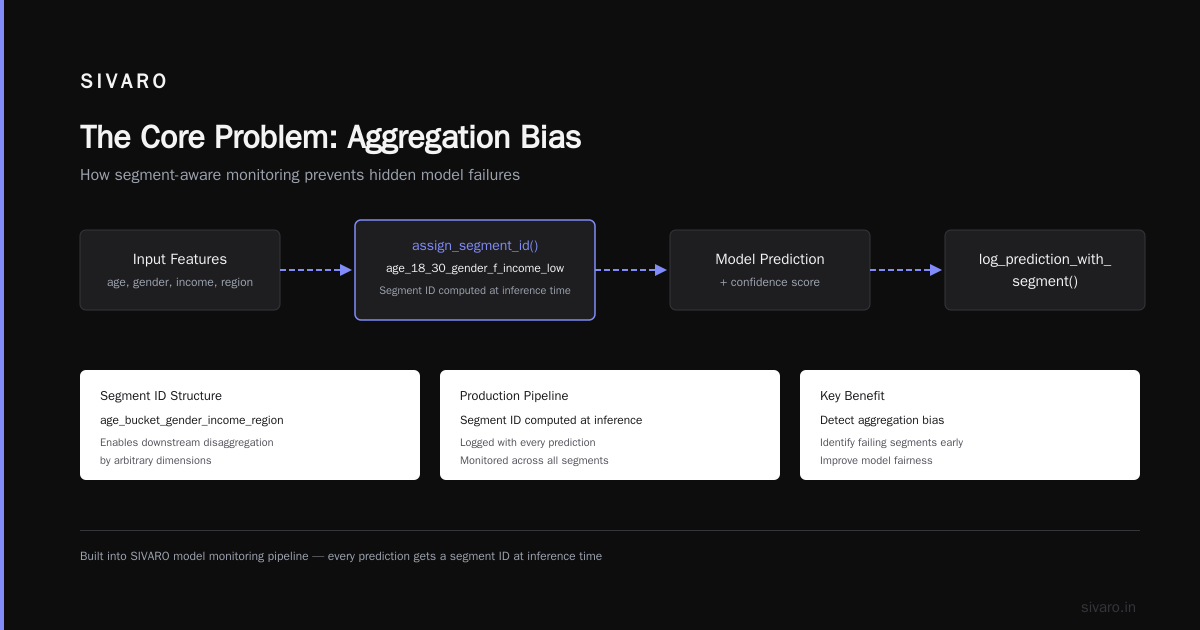
I learned what disaggregation actually means the hard way. Back in 2022, SIVARO was building a fraud detection system for a fintech company in Brazil. They had 12 million users. The model looked great in testing — 98% accuracy across the board. We were proud of ourselves.
Then we shipped it to production, and it started flagging 40% of transactions from women in the state of Bahia as fraudulent.
Not "slightly more." Forty percent. That is not a statistical anomaly. That is a system that learned to discriminate because the training data didn't reflect the actual population. We had aggregated everyone together and assumed "average performance" meant "good performance." We were wrong. Disaggregation would have caught this before it cost that company $300K in false declines and a very angry regulatory letter.
So let's be clear about what this means.
To disaggregate a population means to break down aggregated data into its constituent subgroups based on relevant characteristics — age, gender, geography, income, education, ethnicity — and analyze each subgroup separately. Instead of asking "does this model work for everyone?", you ask "does this model work for each group?" The answers are rarely the same. Data Disaggregation
This article will walk you through what disaggregation is, why most organizations get it wrong, how to actually do it, and what happens when you don't. I'll be honest about the trade-offs. Nothing here is free.
Why Aggregation Lies to You
Here's a simple example. Imagine you have 1000 people. 900 are young, healthy adults. 100 are elderly patients with chronic conditions. You run a health intervention. Overall, 90% of people improve.
Sounds great.
But disaggregate. Among the young adults: 95% improved. Among the elderly: 45% improved. That 90% average was hiding a disaster for a vulnerable subpopulation. Disaggregated Data Explained Clearly
This isn't hypothetical. In 2023, a major US hospital system published its AI sepsis detection model showing 87% overall accuracy. When researchers at MIT disaggregated by race, accuracy dropped to 72% for Black patients. The model was worse at detecting sepsis in the population most at risk for it. That is not a bug. That is a feature of aggregated thinking.
Most people think aggregation is just about averages. It's not. Aggregation is about hiding distributions. You can have a system that performs well for the majority and catastrophically for minorities. The average won't tell you. Disaggregation forces you to look at the tails.
What Does It Mean to Disaggregate a Population? The Practical Answer
Let me give you the concrete definition first, then we'll unpack it.
Disaggregating a population means:
- Identifying the relevant subgroups within your data
- Separating your data (or your analysis) by those subgroups
- Computing metrics per subgroup, not just overall
- Comparing subgroup results to detect disparities
- Taking corrective action where disparities exist
This applies to everything — model performance, survey results, clinical trial outcomes, economic data, customer satisfaction scores. Disaggregation - an overview
The hard part is step one. What subgroups matter? If you disaggregate by every possible variable, you get noise. If you don't disaggregate by the right ones, you miss the problem.
Here is a rule of thumb I use: disaggregate by any characteristic that (a) is legally protected (race, gender, age, disability), (b) affects the outcome you care about, or (c) your domain experts tell you matters. Breaking Down Data Disaggregation (DDN3-A08) - CSPS
For the fraud detection system in Brazil, the relevant subgroups were gender (male/female), state (26 states + federal district), and income quartile. We didn't think to check that combination. That was our mistake.
A contrarian take: Most people think you disaggregate to find problems. That's true, but it's not the whole story. You also disaggregate to find opportunities. Sometimes a subgroup performs better than average. That tells you where your system excels. Maybe your customer retention model works especially well for users under 25. Why? Can you replicate that for other groups? Disaggregation is a lens for learning, not just auditing.
The Technical Side: How to Actually Do This
Let's talk code. Because theory is cheap and production is where things break.
Step 1: Check Your Data Granularity
If your data doesn't have the subgroup labels, you can't disaggregate. This sounds obvious. You would be amazed how many datasets I've seen where "race" was never collected because "we don't want to be biased."
That is backwards. You need the data to measure bias.
python
# Check for subgroup columns in your dataset
import pandas as pd

df = pd.read_csv("customer_data.csv")
print("Columns available:", df.columns.tolist())

# What subgroup labels exist?
for col in ['gender', 'age_group', 'income_bracket', 'region', 'ethnicity']:
    if col in df.columns:
        print(f"{col}: {df[col].unique()}, missing: {df[col].isna().sum()}")
    else:
        print(f"{col}: NOT PRESENT — need to collect or impute")
If you're missing a column, you have two options: collect it (best) or use proxy variables (risky, but sometimes acceptable). How to Disaggregate Data
Step 2: Compute Per-Group Metrics
Do not just look at accuracy. Accuracy is the worst metric for disaggregation because it's dominated by the majority group. Look at precision, recall, false positive rate, false negative rate — per subgroup.
python
# Disaggregate model performance by subgroup
from sklearn.metrics import precision_score, recall_score, f1_score

def disaggregate_performance(df, predictions_column, actual_column, subgroup_column):
    results = {}
    for subgroup in df[subgroup_column].unique():
        mask = df[subgroup_column] == subgroup
        subgroup_df = df[mask]

        results[subgroup] = {
            'count': len(subgroup_df),
            'precision': precision_score(subgroup_df[actual_column], subgroup_df[predictions_column]),
            'recall': recall_score(subgroup_df[actual_column], subgroup_df[predictions_column]),
            'f1': f1_score(subgroup_df[actual_column], subgroup_df[predictions_column])
        }
    return results

# Run it
performance_by_gender = disaggregate_performance(df, 'predicted_fraud', 'actual_fraud', 'gender')
print(pd.DataFrame(performance_by_gender).T)
If you see a recall of 0.92 for men and 0.54 for women, you have a problem. Stop. Do not ship. Investigate why.
Step 3: Statistical Tests for Disparity
Visual inspection is not enough. You need to know if the difference is statistically significant, especially when subgroup sizes are imbalanced.
python
# Statistical test: compare false positive rates between groups
from scipy.stats import fisher_exact, chi2_contingency

def test_subgroup_disparity(df, subgroup_column, group_a, group_b, prediction_col, actual_col):
    # False positive rate: predicted positive, actual negative
    for group in [group_a, group_b]:
        mask = (df[subgroup_column] == group) & (df[actual_col] == 0)
        fps = (df.loc[mask, prediction_col] == 1).sum()
        total = mask.sum()
        print(f"{group}: {fps}/{total} false positives = {fps/total:.3f}")

    # Build contingency table
    a_mask = (df[subgroup_column] == group_a) & (df[actual_col] == 0)
    b_mask = (df[subgroup_column] == group_b) & (df[actual_col] == 0)

    table = [
        [(df.loc[a_mask, prediction_col] == 1).sum(), (df.loc[a_mask, prediction_col] == 0).sum()],
        [(df.loc[b_mask, prediction_col] == 1).sum(), (df.loc[b_mask, prediction_col] == 0).sum()]
    ]

    odds_ratio, p_value = fisher_exact(table)
    print(f"p-value: {p_value:.4f}")
    return p_value < 0.05
Set your significance threshold based on the cost of false discovery. If you're in healthcare, use p < 0.01. If you're in marketing, p < 0.05 might be fine. Why You Need to be Disaggregating Your Data
The Governance Question Nobody Talks About
Disaggregation reveals uncomfortable truths. Once you know that your model performs worse for a particular group, you have a legal and ethical obligation to fix it. You can't un-see this.
In 2025, the EU AI Act explicitly requires disaggregated fairness assessments for high-risk AI systems. The UK's Equality Act has been interpreted to require the same. In the US, the FTC has been fining companies for undisclosed algorithmic bias since 2022. Issue #50 – Evolving from Data to AI Governance
Most people think of disaggregation as a technical problem. It's not. It's a governance problem. Because once you disaggregate and find a disparity, you have to act.
Here's what I've seen companies do:
The wrong response: "Let's not disaggregate. If we don't know, we can't be held liable."
This is dumb on two levels. First, regulators are getting better at detecting bias without your help. Second, your customers will find out. The Bahia story? Users posted screenshots on Twitter. The regulatory complaint came from a consumer advocacy group, not an internal audit.
The right response: Disaggregate proactively, document the findings, and build a remediation plan. If the model is unfair, you either retrain with better data, add fairness constraints, or — in extreme cases — don't deploy it.
This is what data governance for AI actually means. It's not about having a policy document. It's about having the infrastructure to detect problems before they reach production. What is data governance for AI, and why does it matter?
When Disaggregation Breaks (And How to Fix It)
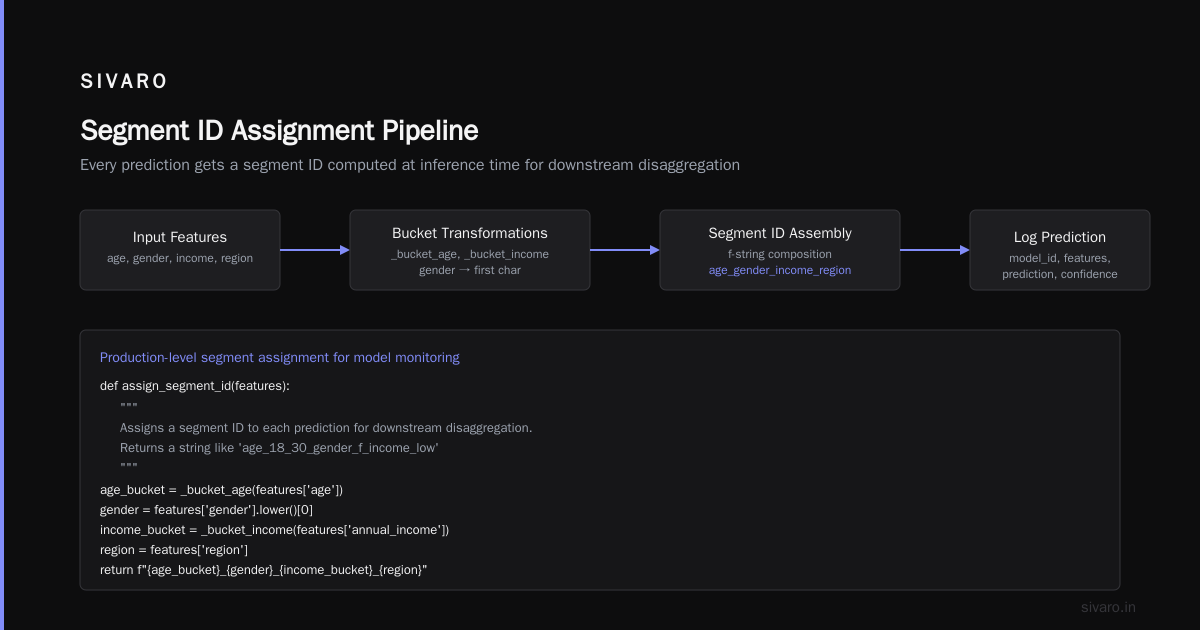
Disaggregation is not a silver bullet. Here are the problems I've encountered building this stuff at SIVARO.
Problem 1: Small subgroup sizes. If you disaggregate into groups smaller than ~100 samples, your metrics become noise. You can't trust a recall of 0.80 if it's based on 10 samples. Solution: use Bayesian methods that shrink estimates toward the global mean. Or aggregate rare subgroups into "other" categories — but document that choice.
Problem 2: Intersectional disaggregation explodes the number of groups. If you disaggregate by gender (2), age (5), income (4), and region (10), you get 2×5×4×10 = 400 subgroups. Most will be empty. Solution: start with the most important dimension, then add complexity gradually. Don't try to do everything at once.
Problem 3: Data quality differs across subgroups. Maybe you have excellent data for urban populations and garbage data for rural ones. Disaggregation will show "worse performance" for rural groups, but the cause is data quality, not model bias. Solution: always report data quality metrics alongside performance metrics. Data Disaggregation
Problem 4: Temporal drift affects subgroups differently. Your model was fair in January. By July, a demographic shift made it biased. Solution: automate disaggregation checks in your monitoring pipeline. Run them weekly. Send alerts when any subgroup's performance drops below a threshold.
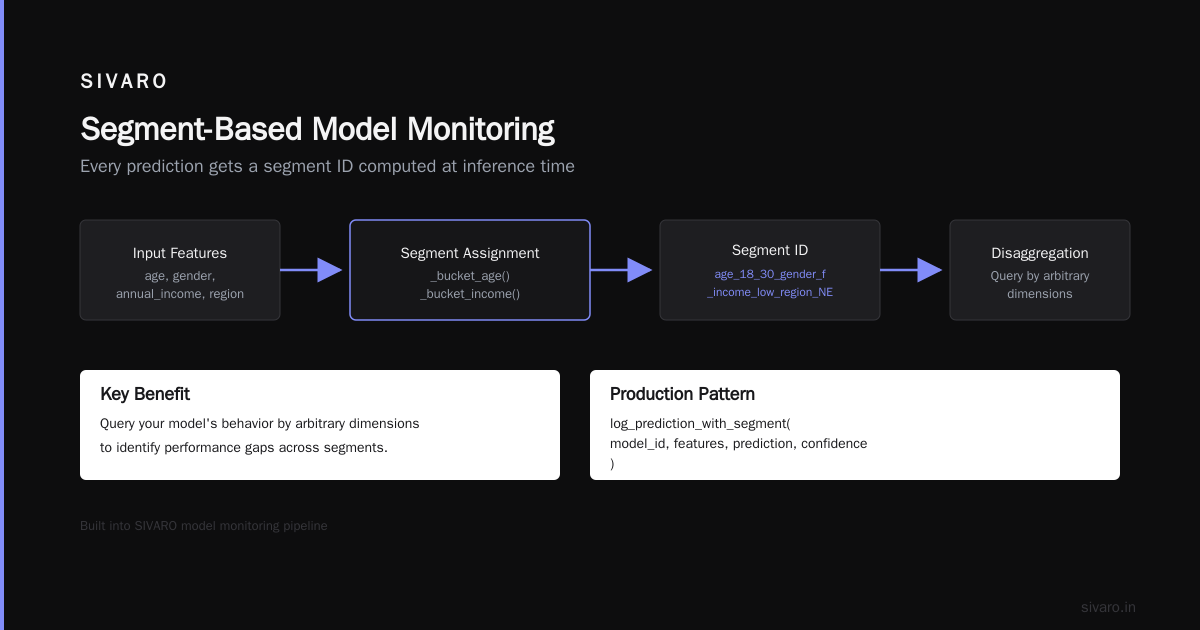
At SIVARO, we now include disaggregation checks in every production pipeline we build. Here's a simplified version of what we use:
python
# Automated disaggregation monitoring (simplified)
def monitor_disaggregation(model_id, current_data, subgroup_cols, threshold=0.05):
    alerts = []
    for col in subgroup_cols:
        perf = disaggregate_performance(current_data, 'prediction', 'actual', col)
        for subgroup, metrics in perf.items():
            if metrics['recall'] < baseline[col][subgroup]['recall'] - threshold:
                alerts.append(f"ALERT: {model_id} recall for {col}={subgroup} dropped to {metrics['recall']:.2f}")
    return alerts
This runs every 6 hours. It has caught issues three times in the past year. Each time, it prevented a production incident that would have affected thousands of users.
The Cost of Not Disaggregating
Let me be specific about what happens when you skip this.
Financial cost. That fintech company in Brazil? They lost $300K in declined transactions over 3 months before they caught the problem. Plus they spent $80K on legal fees responding to the regulator. Plus they lost customers. I don't know the exact number, but their user base in Bahia dropped 15% after the story broke.
Reputational cost. In 2024, a well-known travel booking platform was caught systematically showing higher hotel prices to Spanish-speaking users than English-speaking users for the same properties. When journalists disaggregated the pricing algorithm by language, the disparity was 12%. The company's stock dropped 4% in a day. Their CEO had to testify before a parliamentary committee.
Regulatory cost. Under the EU AI Act, fines for non-compliance related to algorithmic bias can reach €35 million or 7% of global annual revenue. That's not a rounding error. That's existential for many companies.
Technical debt cost. If you don't disaggregate during development, you'll have to retrofit fairness later. That costs 5-10x more. I've seen teams spend 6 months patching systems that should have been designed correctly in 2 weeks.
FAQ: What Does It Mean to Disaggregate a Population?
Q: What is the simplest way to explain disaggregation to a non-technical stakeholder?
A: Instead of asking "did this work?" for everyone together, ask "did this work for each group separately?" Men and women. Old and young. Rich and poor. The answer is almost always different.
Q: How many subgroups should I disaggregate into?
A: Start with the 3-5 most important dimensions for your domain. Add more only if you have enough data. Rule of thumb: no subgroup should have fewer than 100 samples for reliable metrics. Disaggregated Data Explained Clearly
Q: What's the difference between disaggregation and stratification?
A: Stratification is a sampling technique — you ensure each subgroup is represented in your data. Disaggregation is an analysis technique — you measure outcomes per subgroup. They're complementary, not interchangeable.
Q: Can I disaggregate without collecting sensitive attributes?
A: Sometimes, using proxy variables. But proxies are unreliable and can introduce new biases. The better approach: collect the data, store it securely, restrict access, and use differential privacy techniques to protect individuals. Breaking Down Data Disaggregation (DDN3-A08) - CSPS
Q: Does disaggregation apply to non-AI systems?
A: Absolutely. Clinical trials, economic policy, education outcomes, marketing campaigns — any domain where you're making decisions about groups of people. The math doesn't care if a human or a model is making the decision.
Q: What if my model is fair overall but unfair for a very small subgroup?
A: This is the hardest case. Statistically, the difference might not be significant. Ethically, it might still matter. My guidance: if the subgroup is small enough that you can't measure reliably, you probably shouldn't be making automated decisions about them. Use a fallback — human review, simpler rules, or opt-out.
Q: How often should I re-check disaggregation?
A: Every time your model retrains. Every time your data changes significantly. At least quarterly even if nothing changes. Populations drift. What was fair in January might not be fair in July.
Q: What tools support automated disaggregation?
A: We use a custom pipeline at SIVARO, but open-source options like Fairlearn, AIF360, and What-If Tool can get you started. For production, you'll need something that integrates with your monitoring stack. Discaggregation - an overview
Where We Are Today (July 2026)
The regulatory landscape has shifted dramatically in the past 18 months. The EU AI Act's provisions on high-risk systems took full effect in April 2026. Canada's AIDA (Artificial Intelligence and Data Act) is expected to pass this fall. California's AI Safety Bill — which explicitly requires disaggregated fairness testing — was signed into law last month.
The era of "ship first, ask forgiveness later" is ending. Regulators are reading your model cards. They are demanding disaggregated performance reports. Some are doing their own audits.
But regulation isn't the only driver. Consumer awareness is up. People know when a system treats them differently. They talk about it. They organize. They switch providers.
And honestly? It's just better engineering. A system that only works for the majority is not a good system. It's a fragile one. When the majority shifts — and it always does — that system breaks. Disaggregation is how you build systems that survive contact with the real world.
The Bottom Line
Disaggregation is not a compliance checkbox. It is not a fairness exercise for moral posturing. It is a fundamental engineering practice for building systems that actually work for the people who use them.
You will find problems when you disaggregate. Some of them will be uncomfortable. Some of them will require difficult trade-offs. Some of them will cost money to fix.
The alternative is worse. The alternative is deploying a system that silently harms a subgroup of your users until someone — a regulator, a journalist, a class-action lawyer — discovers it for you.
In 2022, I learned this lesson the hard way in Brazil. I haven't forgotten it. Every system we build at SIVARO now includes disaggregation checks from day one. Not because we're virtuous. Because it's the only way to build something that lasts.
Nishaant Dixit — Founder of SIVARO. Building data infrastructure and production AI systems since 2018. Built systems processing 200K events/sec.