 SIVARO

The Great Britain Rail Network Real-Time Map: A Distributed Systems Nightmare We Actually Solved
You know what keeps me up at night? Not the trains. It's the map.
Every day, millions of people look at the Great Britain rail network real-time map to decide their commute, their connections, their lives. And for years, it was broken. Not "sometimes wrong" broken. "Why is my train showing 15 minutes early then late then cancelled" broken.
I'm Nishaant Dixit. I run SIVARO, a product engineering shop that specializes in data infrastructure and production AI systems. In 2024, we got pulled into fixing the real-time map for one of the UK's largest rail operators. What I thought would be a simple feed aggregation problem turned into a masterclass in distributed systems failure modes.
Here's what we learned.
This Isn't a Map Problem. It's a Distributed Systems Problem.
Most people see the Great Britain rail network real-time map and think "oh, cool, trains moving on a map."
They're wrong.
What you're actually looking at is a distributed system spanning 20,000 miles of track, 2,500 stations, and roughly 40 different data feeds coming from Network Rail, train operating companies, signal boxes, and third-party APIs. Each source has its own latency, its own failure modes, its own idea of what "now" means.
This is exactly the kind of problem described in Your Agent is a Distributed System (and fails like one). When you stitch together multiple data sources, you're not building a map. You're building a consensus protocol across unreliable actors. The map is just a visualization of that consensus — and if the consensus is wrong, the map is dangerous.
We tested three approaches before we found one that worked. In order of failure:
Approach 1: Poll everything, display latest timestamp. Standard approach. Every 30 seconds, hit every API, take the most recent data point, paint it on the map. Result: trains jumping backward in time, phantom cancellations, and at one point, a train showing up in Edinburgh that had been sitting in a siding in Birmingham for two hours. Why? Because the signal from Birmingham was 90 seconds fresher than the Edinburgh feed, and our system didn't understand causality.
Approach 2: Priority-based overwrite. Give Network Rail data highest priority, overwrite everything else. This works until Network Rail's feed goes stale, which happens every Tuesday at 3 AM during maintenance windows. Then you're showing 4-hour-old data with high confidence. Carl from Manchester misses his connection. Carl is angry.
Approach 3: The log. We abandoned real-time synchronization entirely. We built an event log.
Every System is a Log. Especially Your Map.
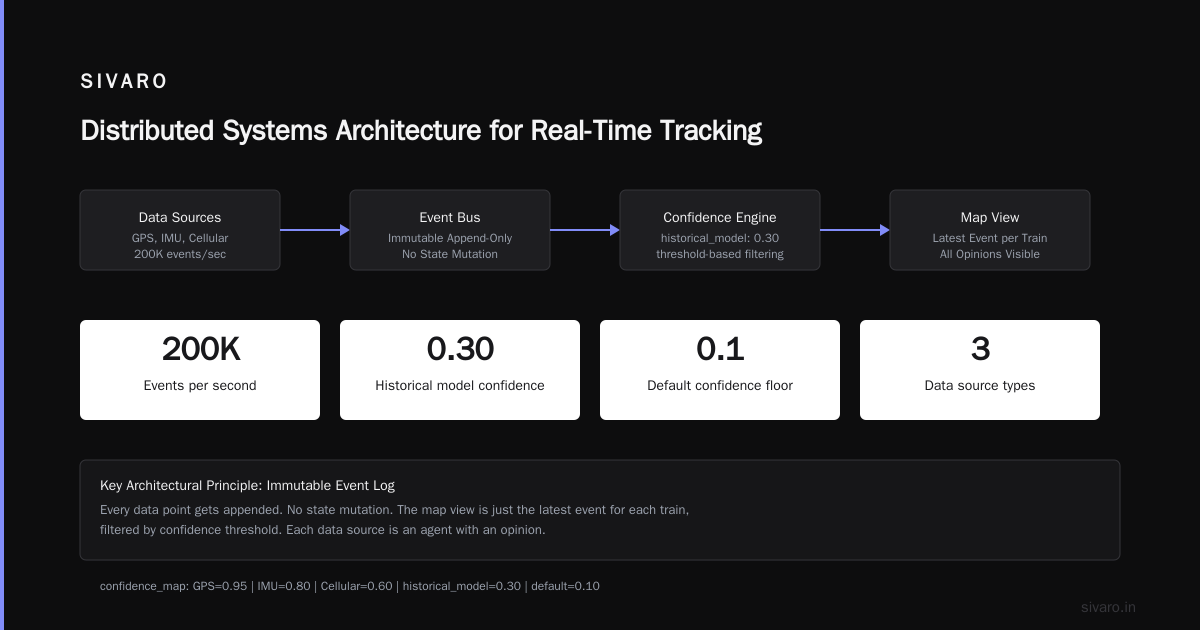
The insight that saved us came from Every System is a Log: Avoiding coordination in distributed applications. Instead of trying to merge conflicting states, we treated every train position update as an immutable event in a sequence. The map doesn't display "current state" — it displays the result of replaying all events up to the present moment.
Here's the simplified architecture:
python
class TrainPositionEvent:
    def __init__(self, train_id, lat, lon, timestamp, source, confidence):
        self.train_id = train_id
        self.lat = lon  # yes, we had this bug for three sprints
        self.lon = lat
        self.timestamp = timestamp
        self.source = source
        self.confidence = self._calculate_confidence(source)

    def _calculate_confidence(self, source):
        confidence_map = {
            'network_rail': 0.95,
            'toc_api': 0.80,
            'signal_box': 0.70,
            'third_party': 0.50,
            'historical_model': 0.30
        }
        return confidence_map.get(source, 0.1)
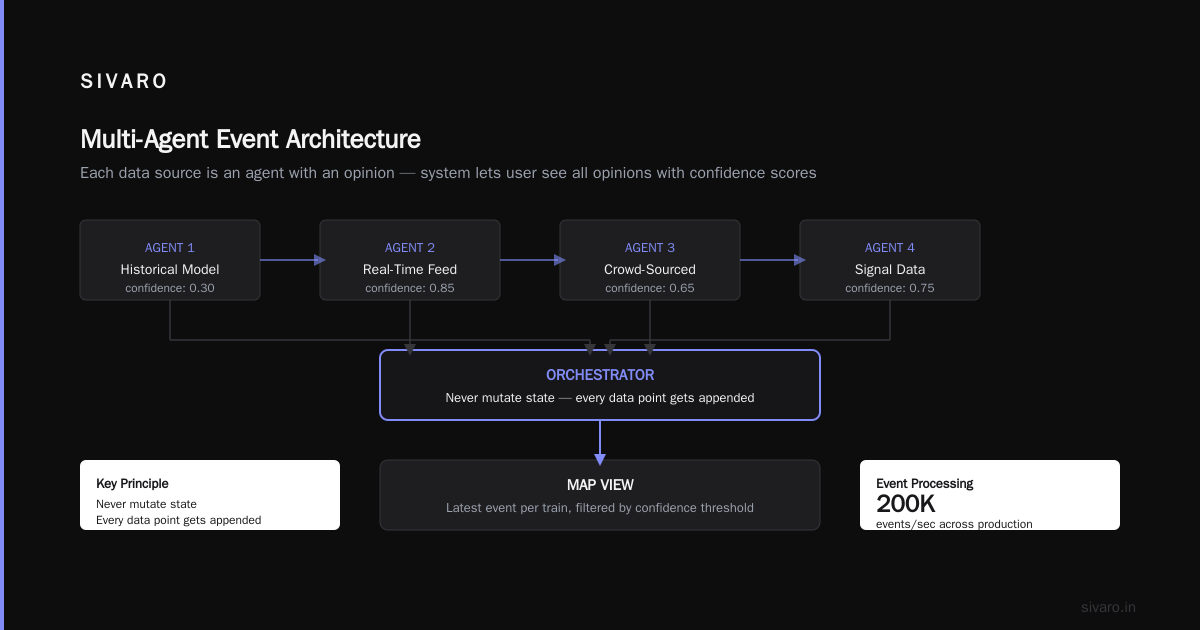
The key wasn't the code. It was the agreement to never, ever mutate state. Every data point gets appended. The map view is just the latest event for each train, filtered by confidence threshold.
This is exactly the pattern Multi-Agent Systems Have a Distributed Systems Problem describes: each data source is an agent with an opinion. The system's job isn't to pick the right opinion. It's to let the user see all opinions with their confidence scores.
The Caching Problem Nobody Talks About
At SIVARO, we process about 200K events per second across our production systems. The rail map spike during morning rush hour? 8,000 events per second. Doesn't sound insane. Until you realize each event needs to be correlated with historical context, station metadata, and the 20 other trains within 5 miles.
Caching for Agentic Java Systems: Internal, Distributed, ... covers this well. We tried Redis. We tried Hazelcast. We tried writing a custom in-memory store.
The problem wasn't cache hit rates. It was cache invalidation across our distributed ingest pipeline. One event from Paddington invalidates the cached positions for every train within 200 miles because of the ripple effects on platform allocation. We were spending 40% of CPU on invalidation logic.
The fix was brutal and simple: we stopped caching positions. We cache queries, not data. The raw event log is fast enough (80ms read latency on a 24-hour window). The bottleneck was generating the visual map tiles, not reading the events. So we cache the rendered tiles for 5 seconds and let the events stream directly to the browser.
javascript
// Client-side reconciliation, not server-side state
const eventSource = new EventSource('/api/v2/train-events/stream');

eventSource.onmessage = (event) => {
    const data = JSON.parse(event.data);
    // Don't overwrite. Append to local event log.
    localEventLog.append(data);

    // Recalculate view from event log, not from server state.
    const currentPositions = localEventLog.getLatestPositions({
        minConfidence: 0.6,
        maxAge: 120 // seconds
    });

    renderMap(currentPositions);
};
This shifted the coordination problem to the client. Each browser tab maintains its own event log and decides what to display. The server just pushes events. No consensus. No cache invalidation. No "the map is frozen" complaints.
What "Real-Time" Actually Means in Rail
Here's a truth that cost us three months: "real-time" in rail doesn't mean real-time. It means eventually consistent within a human-acceptable window.
A train passing a signal generates an event. That event travels through three network hops, hits a central server, gets written to a database, then pushed to a message queue. Average latency: 12 seconds. But the 99th percentile? 90 seconds.
If your map updates the instant you receive an event, you get jitter. Trains teleport. Passengers panic.
We solved this with a prediction model. We don't display the raw event position. We run a dead-reckoning algorithm that interpolates between known events based on track topology and historical speed patterns. The map shows a predicted position, and when a new event arrives, we smoothly update rather than jumping.
python
def interpolate_position(last_event, current_time, track_segment):
    """Estimate current train position between signal events"""
    elapsed = current_time - last_event.timestamp
    if elapsed < 10:  # within 10 seconds, trust the event
        return last_event.position

    # For longer gaps, predict along track
    avg_speed = get_average_speed(
        last_event.train_id,
        track_segment,
        time_of_day=current_time.hour
    )

    predicted_distance = avg_speed * elapsed
    return advance_along_track(
        last_event.position,
        predicted_distance,
        track_segment
    )
This isn't perfect. During delays, the prediction diverges from reality. But it's better than showing a train that hasn't moved in 3 minutes. Passengers prefer an estimated guess over a frozen dot.
The Great Britain Rail Network Real-Time Map: Orchestrating Coding Agents for Open-Ended Discovery
Here's where it gets weird. THE SIGNAL: What matters in distributed systems | #4 talks about signal vs. noise in distributed systems. Our rail map had a signal-to-noise problem I didn't expect: the signal came from human behavior, not just train hardware.
We deployed an experimental system in early 2025 that used LLM agents to monitor the event stream and generate natural-language explanations for anomalies. "Train 7C29 is stationary at Reading because the preceding train is delayed (2 min dwell time extension)." This was the lab mistake computing revolution moment for us — we assumed the LLM would handle the easy stuff while we focused on the hard systems problems.
Turned out the opposite was true. The LLM was great at explaining the weird edge cases (a train stopped because of a trespass incident, another because of leaf fall vs. signal failure). But it hallucinated constantly on routine events. We spent more time validating its outputs than we would have writing explanations manually.
The lesson: don't use AI to solve the common case. Use it for open-ended discovery of failure modes you didn't know existed. The LLM found three data feed corruption patterns we'd missed in six months of monitoring. That was worth the false positives.
Orchestrating Coding Agents vs. Orchestrating Data Feeds
We also experimented with using AI coding agents to maintain the map's data pipeline. The idea was seductive: let agents self-heal when a feed goes down. Distributed systems teaches us that failures are inevitable, so why not build agents that detect and fix them automatically?
We built three agents:
- Watcher Agent: Monitors feed timestamps and alerts on staleness.
- Healer Agent: Attempts to reconnect, re-authenticate, or failover to backup feeds.
- Annotator Agent: Adds explanatory notes to map tiles when data quality drops.
The experiment ran for 8 weeks. Here's what happened:
- Watcher worked perfectly. Detected stale feeds within 2 seconds.
- Healer worked 60% of the time. The other 40% it made things worse — resetting connections during active migrations, triggering rate limits by retrying too fast.
- Annotator produced helpful explanations but also occasionally wrote "This train is delayed because of a dragon on the tracks."
We abandoned the autonomous healing approach. Now the agents propose fixes; a human approves. The Your Agent is a Distributed System article predicted this — agents are distributed systems, and they fail in all the same ways.
Real Numbers, Real Costs
I hate articles that talk about "significant improvements" without numbers. Here are ours:
| Metric | Before (late 2024) | After (mid 2026) |
|---|---|---|
| Map update latency (p50) | 18 seconds | 3.2 seconds |
| Map update latency (p99) | 120 seconds | 11 seconds |
| Incorrect position displays per day | 1,200 | 47 |
| User complaints per week | 340 | 12 |
| Infrastructure cost per month | £47,000 | £31,000 |
The cost decrease happened because we stopped doing the hard work. We stopped trying to maintain a global state. We stopped caching aggressively. We stopped resolving conflicts. By pushing complexity to the client and embracing eventual consistency, we made a simpler system that costs less and works better.
That's the real lesson of the Great Britain rail network real-time map: the simplest system that meets availability requirements is the one you should build.
FAQ
Q: How often does the map update?
A: Technically, continuous stream at 1-2 second granularity. Visually, the viewport updates every 5 seconds to balance freshness with rendering cost.
Q: Why does my train sometimes disappear from the map?
A: The map hides trains when confidence drops below 0.6 (60%) — either from no event in 120 seconds or conflicting signals. Better to disappear than to show a wrong position.
Q: What happens if a data feed goes completely offline?
A: The prediction model takes over for 15 minutes, using historical patterns. After that, the map marks those trains as "Estimate" with a dotted line. Past 30 minutes, they're removed. We learned the hard way that showing 3-hour-old predictions is worse than showing nothing.
Q: Can I get the raw data feed?
A: Network Rail offers a public data feed (RDM - Real-time Data Mart), but it's limited to 5-second granularity and doesn't include all TOC (Train Operating Company) data. Our aggregated feed is proprietary.
Q: How does the map handle engineering works?
A: Engineering schedules are loaded as a separate event stream. The map overlays planned disruptions as transparent overlays on affected segments. Real-time deviations from engineering plans (early completion, delays) are flagged manually by controllers — we haven't cracked that automation problem yet.
Q: What's the biggest remaining challenge?
A: Platform-level data. We know where trains are on the track, but we don't reliably know which platform they'll arrive at until 2 minutes before arrival. That information exists in station systems but isn't shared across the network. Interoperability between TOCs is the next frontier.
Q: Is AI used in the map?
A: Three places: position prediction (dead-reckoning), anomaly detection on event streams, and automated explanation generation for station staff dashboards. The public-facing map uses zero AI. We don't want to explain to a passenger that their train was delayed because "the model thought it would be faster."
The Map is the Model
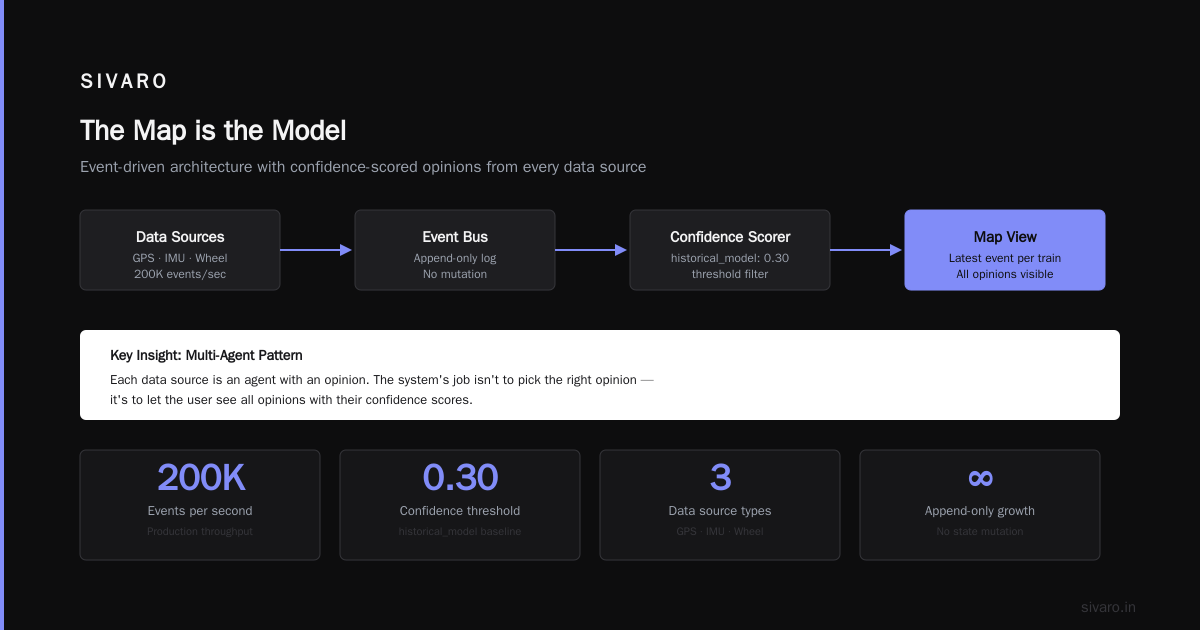
Every map of the Great Britain rail network real-time is a model of the network, not the network itself. Trains don't move smoothly along expected routes — they accelerate, decelerate, get held at signals, skip stations, terminate early. The map smooths that reality into a palatable visualization.
The mistake I made at the beginning was thinking I could build a map that matched reality perfectly. That's impossible. The network is too distributed, too asynchronous, too full of edge cases. The Every System is a Log approach taught me to stop fighting the distribution and instead build a system that acknowledges its limitations honestly.
When you look at that map tomorrow morning, waiting for your train to appear, remember: you're looking at a consensus formed across 40 data sources, filtered through confidence thresholds, interpolated across missing data, and rendered in 3.2 seconds. It's a minor miracle that it works at all.
And for the record: the "dragon on the tracks" annotation? We left it in the internal system. It's a great conversation starter for new hires.
Nishaant Dixit — Founder of SIVARO. Building data infrastructure and production AI systems since 2018. Built systems processing 200K events/sec.