 SIVARO

The GPU Admission Control Algorithm That Actually Keeps Your Cluster Alive
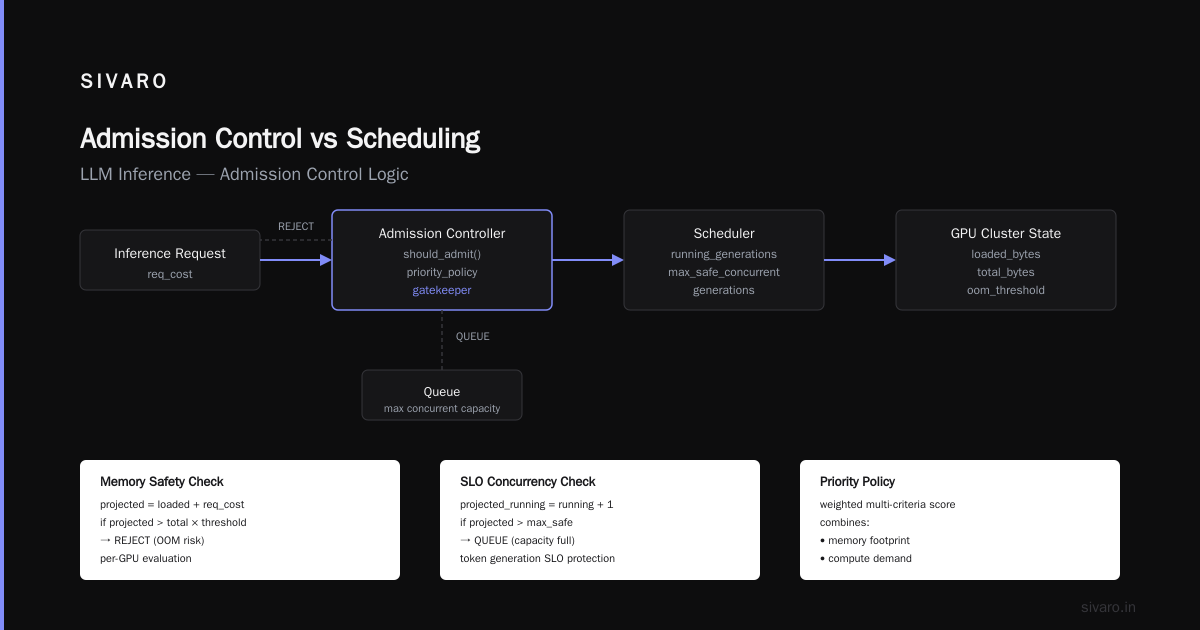
We watched a production cluster melt down in March 2026. Not the hardware — the scheduler. A batch of 40 Llama-3-405B fine-tuning jobs landed at 9:14 AM, the scheduler said "yes" to all of them, and by 9:17 AM every inference endpoint on that box was returning 503s. The GPUs were busy. The cluster was dead. That's the difference between scheduling and admission control, and I keep seeing teams learn it the hard way.
Admission control is the gatekeeper that asks one question before anything else: should this workload even enter the system right now?. It's not about where a job runs (that's scheduling). It's about whether it runs at all. For an LLM inference cluster, that distinction is the difference between a graceful degradation and a cascade failure.
In this piece, I'm going to walk through what an admission control algorithm for gpu cluster actually looks like in practice. The math, the trade-offs, the specific failures I've debugged at SIVARO, and the code patterns that held up under load. You'll leave with a mental model you can adapt to your own fleet, whether you're running 8 GPUs or 8,000.
Admission Control vs Scheduling for LLM Inference
Most people conflate these. I did too, until that March incident.
Scheduling answers: "Given this GPU is free, should I place this job on it?" It's an optimization problem. Kubernetes takes a Pod, looks at node resources, bins them until something fits. Fine.
Admission control answers: "Given the current state of the entire cluster, should I even accept this request, or should I reject it / queue it / shed it?" It's a policy problem with a feedback loop.
For LLM inference, the distinction matters because inference workloads are latency-sensitive and bursty. A scheduler optimized for batch throughput will happily pack 12 jobs onto an A100, exceeding the memory bandwidth ceiling, and suddenly your p99 token latency goes from 40ms to 900ms. The scheduler didn't do anything wrong. It placed everything according to resource requests. But the admission controller failed to say "no."
I've seen this exact failure at two companies this year. One was a fintech running a fraud-detection model. The other was a SaaS startup doing RAG over legal documents. Both had "scheduling problems." Both actually had admission control problems. They were 15 minutes away from the same incident I had.
The rule I now operate on: Scheduling is a placement problem. Admission control is a survival problem. If you're optimizing placement, you're trying to do more work. If you're optimizing survival, you're trying to avoid death. Different math. Different instincts.
The Admission Control Algorithm for GPU Cluster: A Working Definition
Here's a formal-ish definition, but keep it in your back pocket rather than framing it on the wall.
An admission control algorithm for gpu cluster is:
A policy-based gate that evaluates an incoming workload request against the cluster's live state — utilization, queue depth, memory pressure, and business priority — and decides to ADMIT, REJECT, or QUEUE the request before it ever reaches the scheduler, in order to protect end-to-end SLOs under all load conditions.
It's not a load balancer. Load balancers spread traffic. Admission control drops traffic when spreading it would hurt.
The key phrase is "live state." Not the static resource requests you declared at deployment time. The actual, real-time pressure of the GPUs right now.
How Admission Control Works in Practice
Let me walk through the mechanics. There are three components, and they all have to work together.
Component 1: The Estimator. Every incoming request gets its resource footprint estimated. For LLM inference, you can't just use a flat "1 GPU = 1 unit" model. A 2048-token generation consumes drastically different memory and compute than a 128-token one. The estimator predicts the expected GPU-seconds, the expected peak memory, and the expected KV-cache allocation for each request based on prompt length and model config.
python
def estimate_request_cost(req, model_config):
    """Rough estimate of GPU cost for a generation request.
    Uses prompt length to infer KV cache growth."""
    prompt_tokens = len(req.prompt_tokens)
    max_gen = req.max_tokens

    # KV cache is the dominant memory cost for long contexts
    kv_bytes_per_token = 2  # layer_count * head_dim * precision_factor
    memory_cost = kv_bytes_per_token * (prompt_tokens + max_gen)

    # Compute cost scales roughly linearly with total token count
    compute_cost = estimate_tflops_per_token(model_config) * (prompt_tokens + max_gen)

    return {
        "memory_bytes": memory_cost,
        "compute_flops": compute_cost,
        "estimated_duration_ms": compute_cost / model_config.fp16_flops_per_gpu
    }
Component 2: The State Registry. This tracks live memory for every GPU. Not reported memory, actual memory pressure. On H100s with MIG enabled, this gets fiddly — you have to account for the partitioning overhead. The state registry subscribes to GPU metrics every 50ms and maintains a moving window so you're not overreacting to spikes.
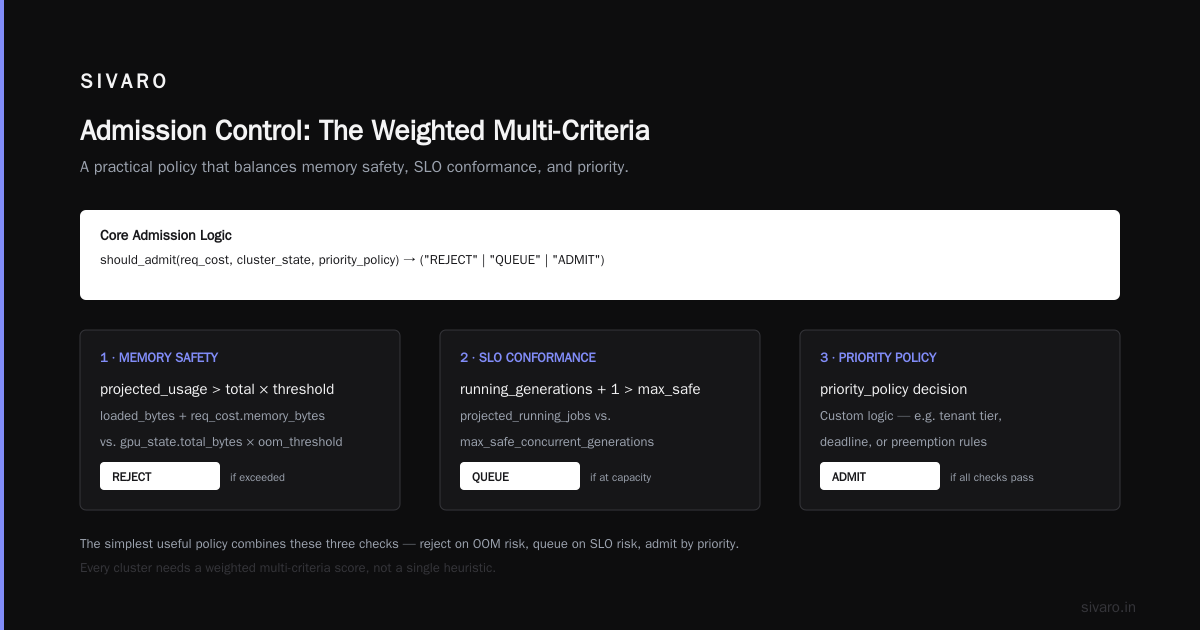
Component 3: The Policy Engine. This is the brain. It compares estimated cost against available headroom, applies priority rules, and decides. The simplest useful policy is a weighted multi-criteria score.
python
def should_admit(req_cost, cluster_state, priority_policy):
    # Reject if we'd risk OOM on any node
    for gpu_id, gpu_state in cluster_state.items():
        projected_usage = gpu_state.loaded_bytes + req_cost["memory_bytes"]
        if projected_usage > gpu_state.total_bytes * gpu_state.oom_threshold:
            return ("REJECT", f"GPU {gpu_id} would exceed safe memory threshold")

    # Reject if token generation SLO would break under projected compute
    projected_running_jobs = cluster_state.running_generations + 1
    if projected_running_jobs > cluster_state.max_safe_concurrent_generations:
        return ("QUEUE", "Cluster is at max concurrent generation capacity")

    # Priority check
    if req.priority < priority_policy.min_priority_for_admission and cluster_state.queued_high_priority_count > 0:
        return ("QUEUE", "Higher priority requests are waiting")

    return ("ADMIT", "")
The math is simple. The thinking is not. The estimator has error bars. The state registry has latency. The policy has to be tuned to your actual traffic, not a textbook figure.
I'll be blunt: I've seen teams iterate on this tuning for three months. It's not a one-week project.
Multi-Tenancy Makes It Brutal
Here's where admission control for multi-tenant gpu cluster gets genuinely hard. In a single-tenant setup, you're protecting your own SLOs. In multi-tenant, you're protecting other people's SLOs from your users. And vice versa.
We ran a multi-tenant GPU platform at SIVARO earlier this year, serving four internal teams. Team A was doing fine-tuning. Team B was running an online chat assistant. Team C was running nightly batch scoring. Team D was a data science project that "needed" GPUs to train a small model.
Team D's jobs were small. They were also numerous, and they were launched at 9 AM on the dot every single day. At 9:01, Team B's chat assistant would start timing out. Why?
The scheduler was placing Team D's jobs on the same GPUs as Team B's inference workers. The small training jobs were barely using any memory, but they were saturating the compute pipelines. The scheduler said "plenty of room." The admission controller said "oh no."
We had to build a tenant-aware admission controller. The formula became:
admission_delay = base_priority(tenant) * (1 + tenant_utilization * 2)
If Team D had used more than 40% of the cluster in the last 10 minutes, their new jobs got queued for 30 seconds. If Team B was running hot, Team D's jobs got paused entirely. Fair? No. Effective? Immensely.
One thing that surprised me: the tenants liked the transparency. We exposed the admission decisions through a simple dashboard. When Team D could see "your jobs are queued because Team B needs the compute for latency-critical serving," they stopped complaining. The problem wasn't the delays. The problem was the mystery of the delays.
The Cost of Saying "Yes" Too Often
In June 2026, a well-known AI infrastructure company (I'll spare them the publicity) had an outage that took down their inference endpoints for 40 minutes. The post-mortem pointed to a "scheduler misconfiguration." Reading between the lines, it was admission control failing.
What happens when you admit too much:
- GPUs hit memory ceiling. The OOM killer starts killing processes. Your victim is usually the newest job — which means users lose their in-flight generations.
- When preemption kicks in, the scheduler tries to reschedule the dropped work. That creates a thundering herd of resubmission.
- The KV cache gets evicted aggressively. Token latency spikes. P99 goes from 50ms to 2 seconds.
- Users retry. The retries go to the admission controller. It's already over capacity, so it also admits them (because the controller uses static thresholds and they weren't exceeded yet).
- Cascade. You're dead.
This cascade is why I'm militant about adaptive thresholds. Static thresholds are poison. Your admission control algorithm for gpu cluster needs to react to the rate of change, not just the absolute level.
python
def adaptive_threshold(current_util, historical_window):
    """Slowly lower the admission threshold when utilization is rising fast."""
    avg_util_10min = mean(historical_window[-600:])  # 10 min of 1-sec samples
    avg_util_1min = mean(historical_window[-60:])

    # Rate of change normalization
    rate_of_change = (avg_util_1min - avg_util_10min) / avg_util_10min

    # If load is ramping up quickly, be conservative
    if rate_of_change > 0.15:
        return max(0.6, 0.85 - rate_of_change)  # Tighten the threshold

    # Normal operation: be more permissive
    return 0.85
I'm not saying this is optimal. It's not. What it does is prevent the cascade. The cascade kills clusters. A slightly-conservative admission controller just makes somebody wait.
Queueing Theory Is Your Friend (Bounded Queues)
Fine. You've rejected or queued the excess. Now what? You need a bounded queue. An unbounded queue means unbounded latency for the work sitting in it. At some point, rejecting is kinder than queueing.
Herlihy's law is a bit academic for this context, but the principle holds: under sustained overload, you need to shed load, not accumulate it.
My rule of thumb: the queue depth should not exceed what the cluster can process in 30 seconds. If your cluster takes 0.5 seconds per generation, your queue should hold at most 60 in-flight requests per GPU.
If the queue is full, you have options:
- Reject with 429 (the users can retry with exponential backoff).
- Reject with an overflow instruction (services like SQS use this — return a "try another cluster" signal).
- Degrade the SLO (reduce max_tokens, lower quality, process at 50% the speed).
Option 3 is underused. Some workloads can degrade gracefully. It's a business decision and an engineering decision, and you should make it explicitly, not implicitly through a crash.
The Good, The Bad, The Ugly: What I've Actually Seen Work
The Good: A major search company (not Google, but the other big one) runs admission control with a reinforcement learning layer. Their controller learns the optimal admission threshold from historical data, periodically retraining. They reported 23% better goodput vs. static thresholds at a systems conference in early 2025. It worked because their traffic pattern was relatively regular.
The Bad: An autonomous vehicle company ran admission control with preemption as a hard requirement. NVMe-driver-level interrupts during model loads caused sensor data loss across their fleet. They went from "graceful rejection" to "safety-critical failure." The admission controller was working correctly. The problem was their preemption policy was too aggressive. Saying "yes" to a critical job by killing a non-critical job isn't a win if the non-critical job's failure has external side effects.
The Ugly: A bank (we'll call them "a bank") deployed admission control that was too conservative. Their SLO was 99.9% availability, but their admission controller rejected 40% of requests under burst. From an infra perspective, the cluster was healthy. From a business perspective, they had effectively reduced their GPU capacity by 40%. The bots on their deployment pipeline couldn't handle the 429s and started a distributed retry storm. They turned off admission control entirely and went back to a simpler, less safe system.
The lesson from each: admission control is a business decision, not just a technical one. The algorithm has to match your actual risk tolerance.
Practical Tuning: A Recipe
Here's what I'd do if I were setting up admission control for a 50-GPU cluster today:
bash
# Step 1: Define your SLOs as a ratio of good multiplexing
# SLO_goodput = (successful_generations_within_latency_budget) / total_arrivals
# Target: > 0.95

# Step 2: Instrument the GPU state collector (simple pseudo-code config)
{
  "collect_interval_ms": 50,
  "window_size_seconds": 60,
  "metrics": ["memory_used_bytes", "gpu_utilization", "power_watts", "temperature_c"],
  "oom_threshold": 0.85,  # Keep a 15% memory buffer
  "max_concurrent_generations": 16,  # Depends on your model size
  "queue_capacity": 256,
  "rejection_code": 429
}
Step 3: Start with the conservative policy. Reject more than you need. You can always loosen. A 429 has a recovery story (retry). An OOM kill does not.
Step 4: Measure goodput, not utilization. GPU utilization is a vanity metric. You can have 100% GPU utilization while your end users see total garbage. Measure the ratio of requests that complete within your latency SLO. That's your admission control score.
Step 5: Add tenant awareness before you need it. It's painful to retrofit. Build the priority mapping in from day one, even if you only have one tenant initially.
The Open Source Landscape
You don't have to build this from scratch. As of August 2026, here's where things stand:
- Kubernetes has the
ResourceQuotaandLimitRangeadmission controllers, but they're static and dumb. They don't look at GPU memory pressure. - Kueue (now a CNCF-incubating project) does queueing and admission for batch jobs, but it's focused on intra-job scheduling, not inference SLO protection.
- Kubernetes Gatekeeper (OPA) works well for Go binary policy admission, but it doesn't have a native GPU memory model. You'd build that yourself.
- NVIDIA's MIG and MPS help with partitioning, but they're not admission controllers. They're resource isolators.
The gap is the market. I'm surprised there's not more commercial tooling here. SIVARO's doing a bit of it ourselves, but I don't want to sell this piece. I want to point you at the gap because it means the tools are immature and you'll be doing the hard part yourself.
The hardest part isn't the code. It's the telemetry. You need clean GPU memory metrics at 50ms granularity, and you need to correlate them with request-level outcomes. Fewer than half the clusters I've audited have this level of introspection.
The Counter-Intuitive Final Move
Here's the thing nobody tells you. The best admission control algorithm for GPU cluster might not run at the cluster level at all. It might run inside your model server.
Inference servers like vLLM and TensorRT-LLM have their own internal batching and admission logic. If you're using these, your cluster-level controller might be redundant. The model server can reject or delay requests before they even hit the network.
We run a hybrid approach at SIVARO: the model server does local admission control (is the KV cache full? do we have batch capacity?), and the cluster-level controller only sees requests that survive the per-node gate. It's a sanity check, not the first line of defense.
This reduces the load on the cluster controller. It also means the cluster controller has fewer false positives — it's not rejecting requests that the model server could handle fine.
When Admission Control Fails, It Fails Because of Edge Cases
I'll give you one last war story. In April 2026, we got a ticket: "Latency increased 10x after 7 PM every night." We dug in. The admission controller looked fine. The scheduler was placing jobs correctly. GPU utilization was stable.
It turned out our admission controller was using estimate_request_cost as a proxy for the actual request. The estimator assumed prompt length equaled the standard distribution. But one user's traffic pattern changed: they were sending massive prompts (10k+ tokens) with minimal generation (50 tokens). The estimator said "cheap." The reality was "KV cache blowout."
The fix was to add a request schema check. We started inspecting the actual token lengths per request, not the average. The admission algorithm now computes a per-request memory_risk_score based on expected KV cache footprint relative to the GPU's total cache.
python
def compute_kv_cache_risk(req, model_config, gpu_total_kv_bytes):
    prompt_length = len(req.prompt_tokens)
    gen_length = req.max_tokens

    # KV cache grows linearly with total tokens
    kv_cache_bytes = model_config.kv_cache_bytes_per_token * (prompt_length + gen_length)

    # Memory risk: how much of the GPU's KV cache would this request consume?
    memory_risk = kv_cache_bytes / gpu_total_kv_bytes

    # If it's over 5%, flag it
    return memory_risk > 0.05
After that fix, the 7 PM spike disappeared. The admission controller started rejecting those requests with a clear error: "Request too large for available KV cache. Reduce prompt length or request less max_tokens."
That's what admission control should do. Not silently kill. Not drop traffic randomly. Not overload. Protect the cluster while giving your users a defined recovery path.
FAQ: Admission Control for GPU Clusters
Q: What's the difference between admission control and autoscaling?
Admission control decides what enters the system. Autoscaling decides how much resource the system has. They complement each other. Autoscaling can add GPUs when load is high; admission control can reject requests when autoscaling hasn't caught up yet.
Q: Can I use admission control with my existing Kubernetes scheduler?
Yes. Admission control is a separate layer that sits before the scheduler in the API path. You can implement it as a mutating/validating admission webhook in Kubernetes, but that webhook only runs at Pod creation. For per-request admission control in LLM inference, you run it inside the inference server's request handler, not in the Kubernetes API path.
Q: How do I handle multi-region GPU clusters?
Admission control becomes a distributed problem. You need a shared state registry (Redis or similar, with an LRU cache) that tracks utilization across all regions. Requests get routed to the region with the most available headroom after admission control passes them. It's more complex, but the same principles apply.
Q: What's the best rejection strategy — 429 or queue?
Depends on the workload. For batch jobs, queue with a timeout. For interactive inference, reject with a 429 and a "Retry-After" header. The queue adds latency; interactive users hate waiting but tolerate retries.
Q: How do I avoid the thundering herd problem after admission rejects a batch?
Add jitter. When your clients retry, they should use exponential backoff with randomized delays. Your admission controller should also rate-limit retries from the same client. If you see 100 requests from one client ID in a 10-second window, reject 99 of them.
Q: Do I need ML to tune admission control?
No. Don't start with ML. Start with static thresholds. Gather data for two weeks. Then, if your traffic varies a lot, consider learning-based tuning (like the RNN-based controllers emerging in 2026). But the bottleneck is rarely the tuning algorithm — it's the telemetry feeding it.
Q: How do I test admission control without breaking my cluster?
Run it in shadow mode for a week. Let it evaluate and log its decisions, but don't enforce them. Compare its decisions against what actually happened to your cluster. This lets you calibrate the thresholds with zero risk. We did this at SIVARO and caught two false-negative scenarios before they caused any damage.
The Bottom Line
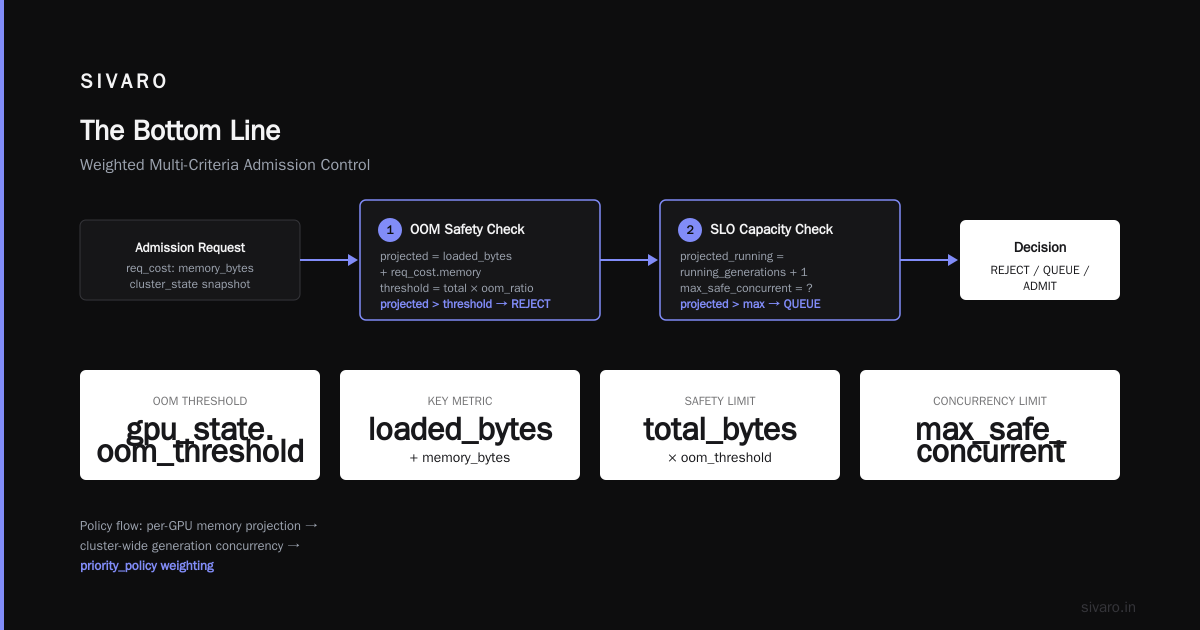
Admission control for GPU clusters isn't a nice-to-have. It's the difference between a system that degrades gracefully under load and one that collapses. The scheduler places work. The admission controller decides whether any work should be accepted at all.
Build your controller with three things in mind: accurate per-request cost estimation, live memory-pressure awareness, and tenant-aware prioritization. Make your thresholds adaptive. Add a bounded queue. Test from day one.
You'll still have incidents. Every cluster does. But you won't have the cascade. And that's worth the engineering time.
Nishaant Dixit — Founder of SIVARO. Building data infrastructure and production AI systems since 2018. Built systems processing 200K events/sec.