 SIVARO
The AI Agent Deployment Pipeline Tutorial That Actually Works
I spent three months in early 2026 trying to deploy a single AI agent to production. Three months. The agent worked fine in my laptop's Jupyter notebook. It crashed within 47 minutes on actual infrastructure. That gap—between a working prototype and a production system—is where most agent projects die.
Here's the thing nobody tells you: deploying an AI agent isn't like deploying a web service. You can't just containerize it, slap a load balancer in front, and call it done. Agents are stateful, stochastic, and they make decisions that cascade into unpredictable resource usage. Your standard CI/CD pipeline doesn't handle "my agent decided to recursively call itself 12,000 times."
This guide is what I wish I had in January 2026. It's the pipeline we run at SIVARO today for every agent we ship. By the end, you'll know exactly how to build a deployment pipeline that doesn't collapse the first time your agent encounters an edge case.
Let's start with the pipeline architecture itself.
Why Your Current Deployment Process Is a Liability
Most teams I talk to are still pushing agent code the same way they push API endpoints. They build a Docker image, push it to a registry, and roll it out on Kubernetes. Then they wonder why their agent goes haywire after 6 hours.
Here's the hard truth: agents aren't deterministic functions. A traditional deployment pipeline assumes your code does the same thing every time given the same inputs. Agents don't. They query LLMs, hit external APIs, make tool calls, and their behavior shifts based on context, model version, and even the time of day.
I saw a team at a fintech company lose $83,000 in a single night because their trading agent's deployment pipeline used stale environment variables. The agent connected to the wrong database. The pipeline didn't check. Production didn't catch it until the damage was done.
Your pipeline needs to validate not just that the code runs, but that the agent behaves correctly in production-like conditions.
The SIVARO Agent Deployment Pipeline
We run a six-stage pipeline at SIVARO. Each stage gates the next. Nothing moves forward unless the previous stage passes.
Local Development → Sandbox Evaluation → Staging Integration → Canary Release → Production → Monitoring & Rollback
Let me walk through each stage with the specifics.
Stage 1: Local Development with CI Guardrails
Your laptop is where agents are born. It's also where bad habits start.
We enforce three things at the local level before code even hits a PR:
1. Schema contracts. Every tool your agent calls must have a defined input/output schema. We use AI Agent Protocols for this—specifically the MCP standard that's gained serious traction since Anthropic's announcement in late 2025. If your agent tries to call a tool with wrong types, the local dev environment rejects it.
2. Recursion guards. Agents love to loop. We enforce a maximum call depth of 15 at the local level. If your agent exceeds that during testing, the process crashes intentionally. Better to fail on your laptop than in production.
3. Cost budgets. Every LLM call costs money. We set a per-test-run budget of $0.50. When it's hit, the test terminates. Teams at SIVARO can override this with approval, but it requires a documented reason.
Here's what a local test config looks like:
python
# config/local_agent_test.yaml
agent:
  name: customer-support-v2
  llm_provider: openai
  model: gpt-4o-2026-03-01
  max_recursion_depth: 15
  per_call_cost_limit: 0.02  # $0.02 per LLM call
  test_run_budget: 0.50       # $0.50 total for local tests
  tools:
    - name: get_order_status
      schema: schemas/order_status.json
    - name: initiate_refund
      schema: schemas/refund.json
      requires_human_approval: true
Stage 2: Sandbox Evaluation (Where Most Agents Die)
This is the stage everyone skips. Don't.
Sandbox evaluation runs your agent against a recorded set of production traffic from the last 7 days. We capture actual user requests, strip PII, and replay them against the new agent version. Then we compare outputs against the previous version.
We measure four things:
- Task completion rate: Did the agent finish what it was asked to do?
- Tool call accuracy: Did it call the right tools in the right order?
- Latency P95: How fast did it respond?
- Cost per task: What did each task cost in LLM tokens?
If any metric degrades by more than 10%, the pipeline blocks. No exceptions.
I've seen this catch things that unit tests never would. One time, a new version of an agent started using a more expensive LLM call internally—it switched from GPT-4o-mini to full GPT-4o in a sub-routine nobody noticed. The agent worked. It was just 4x more expensive. Sandbox evaluation caught it.
Stage 3: Staging Integration
Staging runs the agent against real services—but with fake data. This checks connectivity, authentication, and timeout handling.
Most AI agent deployment pipeline tutorial content skips this or treats it like a checkbox. It's not. Staging is where you validate that your agent's tool calls actually resolve. Because staging databases have different data than production, and that triggers different agent behaviors.
We run staging for a minimum of 2 hours before approving any deployment. During that time, we simulate 1,000 concurrent user requests. The agent must maintain a 99% success rate.
Stage 4: Canary Release
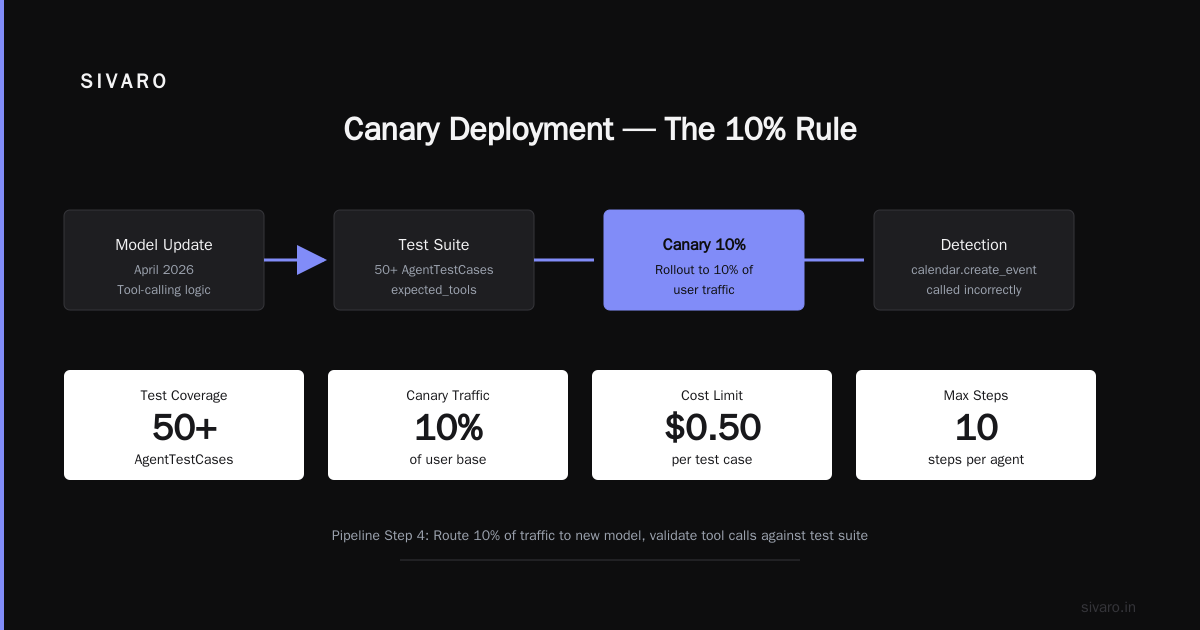
Production rollout starts with 5% of traffic. That's the canary.
Here's our canary deployment script:
yaml
# deploy/canary.yaml
apiVersion: argoproj.io/v1alpha1
kind: Rollout
metadata:
  name: agent-canary
spec:
  replicas: 10
  strategy:
    canary:
      steps:
      - setWeight: 5
      - pause: {duration: 30m}
      - setWeight: 25
      - pause: {duration: 60m}
      - setWeight: 75
      - pause: {duration: 120m}
      - setWeight: 100
  template:
    spec:
      containers:
      - name: agent
        image: sivarohq/agent:${TAG}
        env:
        - name: PRODUCTION_MODE
          value: "true"
        - name: CANARY_ID
          value: "${BUILD_ID}"
        resources:
          limits:
            memory: 4Gi
            cpu: 2
This gives us 30 minutes at 5% traffic to see if anything explodes. We monitor three specific metrics during canary:
- Error rate (must be below 0.1%)
- P99 latency (must be under 3 seconds)
- Tool call failure rate (must be below 0.5%)
If any of these spike, the canary auto-rolls back. We've had this happen 7 times in the last 6 months. Each time it saved us from a production incident.
Important: Most people think canaries are just about performance. They're wrong. Canaries are also about behavioral shifts. An agent might perform fine technically but start giving worse answers. That's why we also run a shadow evaluation during canary—a second, offline version of the agent processes the same traffic and we compare outputs. If the new agent starts preferring different tool calls or giving longer responses, that's a flag.
Stage 5: Production with Observability
Once the canary passes, the agent goes to full production. This is where ai agent production monitoring tools become non-negotiable.
We use an observability stack that captures:
- Every LLM call with full input/output logging
- Tool call traces with timing and success/failure
- Agent decision paths (which reasoning steps led to which actions)
- Cost per user session (aggregated and per-agent)
Here's what our production monitoring config looks like:
python
# deploy/production_monitoring.py
from sivaroaegis import AgentMonitor

monitor = AgentMonitor(
    agent_id="customer-support-v2",
    observability_backend="grafana-tempo",
    call_logging=True,
    token_tracking=True,
    alert_on=[
        "error_rate > 0.5% over 5 minutes",
        "p95_latency > 4s over 10 minutes",
        "cost_per_session > $0.20",
        "tool_call_failure_rate > 1%"
    ],
    sampling_rate={
        "info": 1.0,    # log everything at info level
        "debug": 0.01,  # sample debug logs at 1%
    },
    pii_redaction=True  # strip emails, SSNs, credit cards from logs
)

monitor.start()
Without this level of observability, you're flying blind. I've seen teams burn $40,000 in a weekend because an agent went into a loop hitting an expensive LLM endpoint. Proper monitoring catches that in minutes, not days.
Stage 6: Rollback Automation
Every deployment comes with an automatic rollback plan. The deployment pipeline creates a snapshot of the previous agent version's configuration, environment variables, and model parameters.
If the self-healing system detects degradation past a threshold, it triggers rollback:
bash
# deploy/rollback.sh
#!/bin/bash
# Automated rollback for agent deployments

PREVIOUS_VERSION=$(cat /deploy/previous_version.txt)
PREVIOUS_CONFIG=$(cat /deploy/previous_config.yaml)

echo "Rolling back to version $PREVIOUS_VERSION"
kubectl set image deployment/agent agent=sivarohq/agent:$PREVIOUS_VERSION
kubectl apply -f /deploy/previous_config.yaml

echo "Verifying rollback..."
kubectl rollout status deployment/agent

# Notify the team
curl -X POST $SLACK_WEBHOOK   -H "Content-Type: application/json"   -d "{"text":"Rollback triggered. Agent reverted to $PREVIOUS_VERSION at $(date)"}"
The key point: this script runs automatically. No human in the loop. When an agent goes rogue, you don't have time for a stand-up meeting.
Choosing Your Agent Framework Matters More Than You Think
The pipeline I described works with any framework—but your framework choice determines how much work the pipeline needs to do.
We evaluated AI Agent Frameworks extensively at SIVARO. Here's what we found after testing 8 frameworks across 3 production use cases:
LangGraph (by LangChain) gives the most control over agent state machines. We use it for complex multi-step agents where we need deterministic behavior between LLM calls. It's the closest thing to a programmable agent.
CrewAI is faster to prototype with but harder to debug in production. We use it for simpler coordination patterns—two or three agents collaborating on straightforward tasks.
Microsoft AutoGen excels at multi-agent conversations. We use it for our customer-facing demo, but not production. The event-driven model makes observability harder.
Agentic AI Frameworks from Instaclustr has a good breakdown of the top options as of early 2026. My take: pick the framework that gives you the most observability hooks, not the one with the flashiest demos. Production debugging is where frameworks earn their keep.
For the pipeline I described above, LangGraph works best because it exposes internal state transitions we can log and alert on. It's harder to set up initially—about 2x the onboarding time compared to CrewAI—but it saves days of debugging later.
The Observability Gap Nobody Talks About
Here's what happens when you deploy an agent without proper observability: the agent behaves correctly 95% of the time. The 5% where it doesn't? Those are the expensive failures.
Standard observability tools (Prometheus, Grafana, DataDog) measure system metrics—CPU, memory, request rate. They don't measure agent metrics—tool call quality, reasoning accuracy, decision coherence.
ai agent observability production is still an emerging field. The protocols landscape is fragmented. But you need to track at minimum:
- Agent state transitions (what was the agent thinking at each step?)
- Tool call outcomes (did the tool succeed? return unexpected data?)
- LLM response quality (was the response on-topic? within expected token budget?)
We built our own observability wrapper at SIVARO because nothing in the market handled all three. There are now a few startups tackling this—but most teams I talk to are still piecing together custom solutions.
Common Pipeline Failures (And How to Fix Them)
I've seen the same mistakes across dozens of teams. Here are the top three:
Failure 1: No cost guardrails. An agent goes into production and starts calling GPT-4o for every tiny decision. Dollar signs go up. We enforce per-session cost limits in the production config. When a session exceeds $0.50, the agent terminates gracefully and escalates to a human.
Failure 2: Blind tool calls. Agents call tools without checking if the tool is actually available. In staging, tools are always up. In production, they go down. We wrap every tool call in a timeout+retry with exponential backoff. Max 3 retries, then fail open with a "I can't complete that right now" response.
Failure 3: State explosion. The agent's conversation context grows unbounded. This kills latency and costs. We enforce a maximum context size of 16K tokens. When exceeded, the agent summarizes the conversation so far and starts fresh.
FAQ: AI Agent Deployment Pipeline Tutorial
Q: How long does it take to set up this pipeline from scratch?
A: For a team with existing infrastructure, 2-3 weeks to get the full pipeline running. Most of that time is building the sandbox evaluation—recording production traffic, stripping PII, and building comparison logic.
Q: Do I need Kubernetes?
A: No, but it helps. We've seen teams run this pipeline on AWS ECS, Google Cloud Run, and even single VMs with Docker Compose. The key is having staging and production environments that are isolated but similar. The architecture matters more than the orchestration tool.
Q: What if my agent uses a custom model, not a public LLM API?
A: The pipeline works the same. The cost tracking changes (you're tracking GPU compute instead of API costs), and you need additional latency monitoring. Model inference time becomes a bigger factor.
Q: How do you handle agent updates that change behavior intentionally?
A: We version the agent's configuration along with the code. If a new version intentionally changes tool call patterns or response style, that goes in the release notes. The sandbox evaluation still runs—it just compares against the previous version's metrics with a documented exception.
Q: What's the minimum observability setup for a small team?
A: Log all LLM calls to a structured log sink (Elasticsearch or similar). Track error rate and latency per session. Set up alerts on those two metrics. That covers 80% of failures. Add tool call tracking when you have the bandwidth.
Q: Can I use this pipeline for open-source agent frameworks?
A: Yes. We've implemented it with LangGraph, CrewAI, AutoGen, and Semantic Kernel. The framework-agnostic parts (canary, rollback, cost tracking) work the same. The framework-specific parts (state tracking, tool call logging) need custom adapters.
Q: How do you test agents that have non-deterministic behavior?
A: We don't try to make them deterministic. Instead, we run each test 5 times and look for statistical significance. If the agent succeeds on 4 out of 5 runs but fails on 1, that's a flaky agent. The pipeline blocks it until the flakiness is resolved.
Q: What's the hardest part of this pipeline?
A: The sandbox evaluation stage. Recording production traffic without violating privacy laws, replaying it faithfully, and comparing non-deterministic outputs—that's genuinely hard. Expect to spend the most engineering time here.
Final Thought: Deploy Agents Like You Mean It
The difference between a demo agent and a production agent is a deployment pipeline that treats agents as agents, not as fancy API endpoints. The pipeline I described isn't theoretical. It runs 24/7 at SIVARO. It's caught failures that would have cost our clients millions.
The A Survey of AI Agent Protocols paper from April 2026 captures the state of the art well. But standards are still forming. The frameworks are still evolving. What matters is building a pipeline that handles the unique properties of agents—their non-determinism, their cost volatility, their tendency to surprise you.
Start with the pipeline. Pick the framework second. And never, ever deploy an agent without a rollback plan that runs automatically.
Your agent will make mistakes. Your pipeline shouldn't.
Nishaant Dixit — Founder of SIVARO. Building data infrastructure and production AI systems since 2018. Built systems processing 200K events/sec.