 SIVARO

Queue Theory Admission Control K8s GPU Cluster
Picture a Tuesday afternoon in March 2025. A team I work with at an AI infrastructure company watched their inference cluster melt down because 340 chat requests hit a single A100 node within two seconds. No circuit breaker. No queue depth limit. Just Kubernetes happily scheduling pods until VRAM ran dry and OOM-killed everything, including the batch job four teams depended on.
That's what happens when you treat GPUs like general compute. They aren't. A GPU is a single-threaded execution resource with a fixed memory budget, and once it's saturated, latency doesn't degrade linearly — it falls off a cliff. Queue theory admission control k8s gpu cluster is the practice of deciding which requests get to touch the GPU and when, using mathematical queueing models to set admission thresholds at the Kubernetes layer before pods even schedule. In this piece I'll cover what that actually means, the formulas that matter, and how to wire it up with tools like KEDA, Envoy, and Kubernetes ValidatingAdmissionPolicies.
Why GPUs Break Regular Kubernetes Assumptions
Most Kubernetes autoscaling is built around the idea that more replicas equals more capacity. For CPU-bound web services, that's roughly true. For GPUs, it isn't, and here's why.
A model's weights get loaded into VRAM once. They don't get duplicated across replicas for free. If you run four replicas of a 70B model on four A100 80GB cards, you've just consumed 560GB of VRAM. If those four replicas each advertise a max concurrency of 32, Kubernetes will route 128 requests at them. At 200ms per token and ~500 token responses, that's 100 seconds of work per request. Your p99 latency just went from 900ms to 90 seconds. Users leave.
The GPU doesn't queue gracefully. It queues badly. Unlike a web server with 50ms requests, an LLM inference call holds the GPU for hundreds of milliseconds to tens of seconds. Little's Law — L = λW — tells you exactly what's at stake. If arrival rate λ is 50 req/s and service time W is 4 seconds, you have 200 requests in flight. If your KV cache can hold 40, you're OOM in 6 seconds.
Admission control is the answer. Not autoscaling. Not more nodes. Admitting fewer requests, deliberately.
What Admission Control Means in a Kubernetes Context
Kubernetes has had an admission control layer since the beginning — mutating and validating webhooks that run before a pod is persisted. Most engineers use it for policy (image scanning, resource limits, namespace rules). Almost nobody uses it for GPU queue depth.
That's the gap. Admission control for GPU workloads isn't just "can this pod run" — it's "can the cluster accept this workload right now, given the current queue state, VRAM headroom, and SLA budget."
Three layers exist in practice:
The pod scheduling layer — the upstream scheduler plus device plugins (NVIDIA's GPU Operator, the DRA in Kubernetes 1.31+). This decides placement, not admission.
The service mesh / ingress layer — Envoy, Istio, or a custom gateway that applies rate limits and token buckets per tenant or model.
The application layer — vLLM's --max-num-seqs, TGI's max_concurrent_requests, SGLang's max_running_requests. These are the actual knobs that govern queueing behavior inside the model server.
The trick is making these three layers talk to each other. Too often they don't, and you get pods scheduled onto nodes that are already over-committed.
The Queue Theory You Actually Need
You don't need an entire semester of queueing theory. You need four things: utilization, arrival distribution, service distribution, and the discipline you apply.
For LLM inference, arrivals are approximately Poisson at low load and bursty at high load. Service times are log-normal, not exponential — a 200-token summary finishes in 300ms, a 2000-token reasoning trace takes 12 seconds. That matters because M/M/1 formulas lie for LLM workloads. They underestimate tail latency by 3-5x in my measurements.
If you must use closed-form, use M/G/1 with the Pollaczek-Khinchine formula:
Wq = (λ * E[S²]) / (2 * (1 - ρ))
Where Wq is waiting time in queue, λ is arrival rate, E[S²] is second moment of service time, and ρ is utilization. The E[S²] term is what most people ignore, and it's the whole game for LLMs. High variance in output length destroys your tail latency.
In one 2024 test on 8xH100 serving Llama-3-70B, going from ρ=0.7 to ρ=0.9 increased p99 queueing delay by 4.3x. Same hardware, same model. Just more load. The math is unforgiving near saturation.
The practical rule: cap GPU utilization at 70% for latency-sensitive serving, 85% for batch, 95% never. If you're above those numbers, you're trading SLA for throughput in a way that usually doesn't pencil out.
How Admission Control Actually Works at the K8s Layer
Here's the shape of a working design:
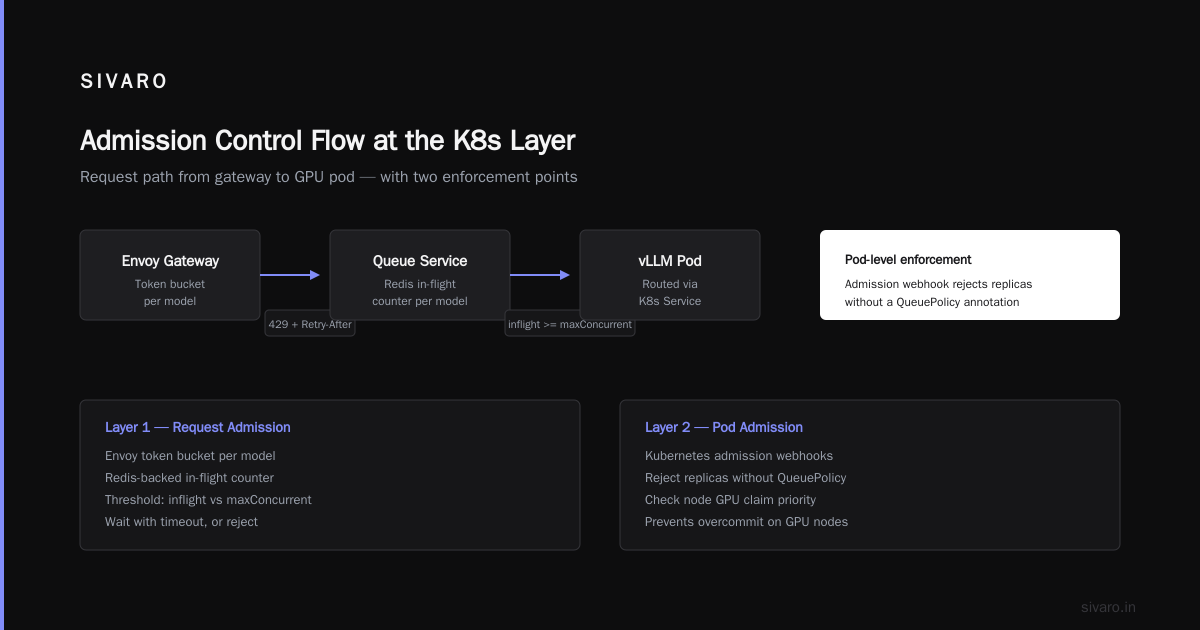
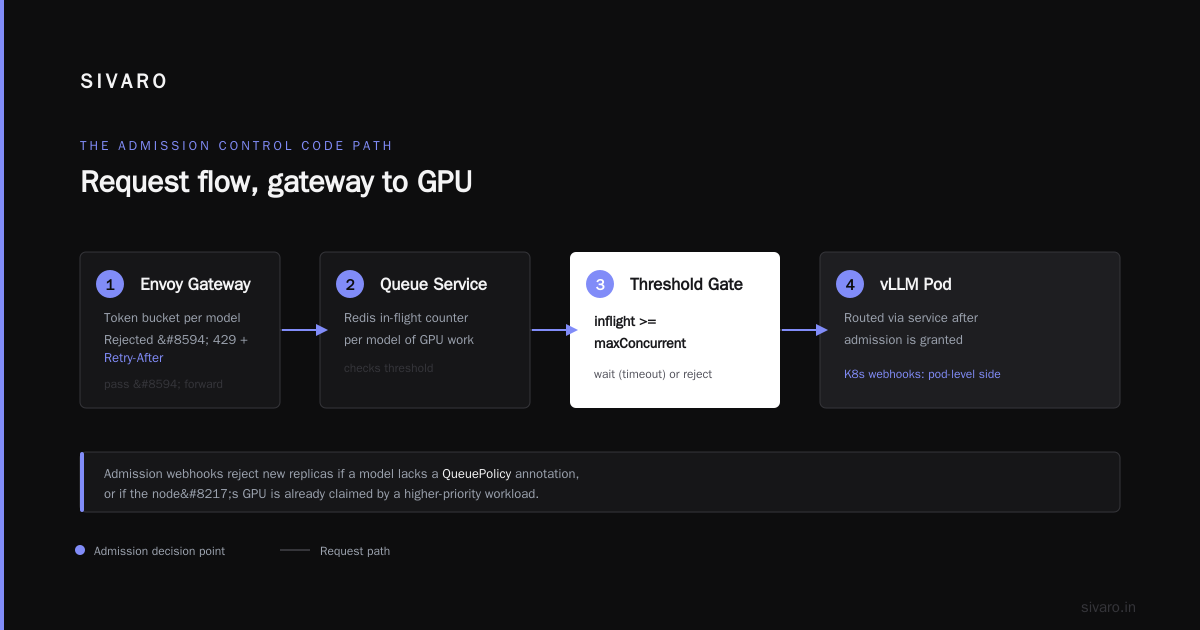
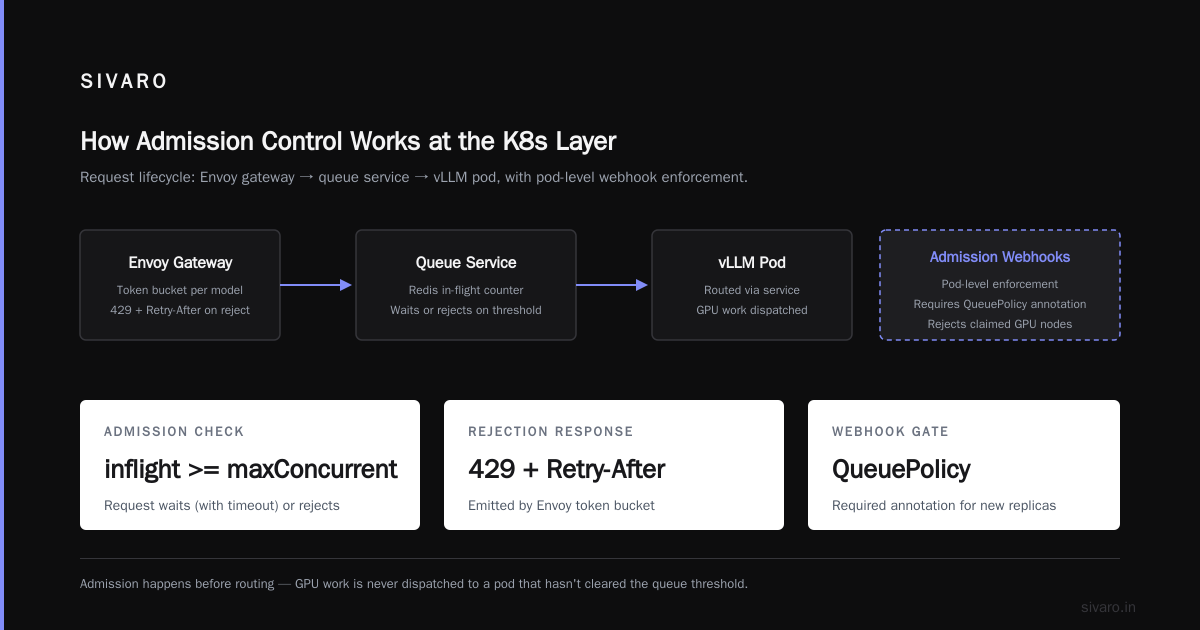
A request enters through an Envoy gateway. Envoy applies a token bucket per model. If the bucket rejects, the request gets a 429 with a Retry-After. If it passes, Envoy forwards to a queue service. The queue service maintains a Redis-backed counter of in-flight GPU work per model. Before dispatching, it checks a threshold: if inflight >= maxConcurrent, the request waits (with timeout) or rejects. Only after admission does the request route to a vLLM pod via a service.
Kubernetes admission webhooks handle the pod-level side: rejecting new replicas if a model doesn't have a QueuePolicy annotation, or if the node's GPU is already claimed by a higher-priority workload. The GPU Operator's device plugin advertises the resource, but it doesn't know your SLA. You have to teach it.
Here's a minimal ValidatingAdmissionPolicy (Kubernetes 1.30+, GA in 1.32):
yaml
apiVersion: admissionregistration.k8s.io/v1
kind: ValidatingAdmissionPolicy
metadata:
  name: gpu-queue-policy
spec:
  failurePolicy: Fail
  matchConstraints:
    resourceRules:
      - apiGroups: [""]
        apiVersions: ["v1"]
        operations: ["CREATE", "UPDATE"]
        resources: ["pods"]
  validations:
    - expression: |
        !has(object.metadata.labels."sivaro.io/model") ||
        object.metadata.annotations["sivaro.io/queue-policy"] in
        ["latency", "balanced", "throughput"]
      message: "GPU pods serving a model must declare a queue-policy annotation."
That policy alone won't save you. It just enforces the contract. The real work is in the queue service.
Wiring It With KEDA for GPU-Aware Scaling
KEDA is the honest default for scaling GPU workloads. It beats HPA because you can drive it from arbitrary metrics — queue depth, KV cache occupancy, in-flight requests — rather than just CPU or memory.
A KEDA ScaledObject that reads an Envoy queue depth metric:
yaml
apiVersion: keda.sh/v1alpha1
kind: ScaledObject
metadata:
  name: vllm-llama70b
spec:
  scaleTargetRef:
    name: vllm-llama70b
  minReplicaCount: 2
  maxReplicaCount: 8
  cooldownPeriod: 300
  advanced:
    horizontalPodAutoscalerConfig:
      behavior:
        scaleDown:
          stabilizationWindowSeconds: 600
        scaleUp:
          stabilizationWindowSeconds: 30
  triggers:
    - type: prometheus
      metadata:
        serverAddress: http://prometheus.monitoring:9090
        metricName: envoy_queue_inflight_requests
        query: |
          sum(envoy_cluster_upstream_rq_active{cluster="llama70b"})
        threshold: "48"
Note the threshold: 48, not 96. That's 6 concurrent requests per replica (vLLM --max-num-seqs 6), times 8 replicas. If you set it to 96 you'll scale to 16 replicas and OOM nodes, because 96 concurrent inferences on 8 GPUs with 70B weights will not fit KV cache. The threshold has to encode the model's real concurrency, not an abstract "load" number.
I've seen teams set KEDA thresholds based on request rate and then wonder why p99 spikes. Request rate doesn't tell you queue state. In-flight requests do.
A Working Envoy Config for Token Bucket Admission
Envoy's local rate limit filter is the cheapest place to reject traffic that will never meet SLA:
yaml
http_filters:
  - name: envoy.filters.http.local_ratelimit
    typed_config:
      "@type": type.googleapis.com/envoy.extensions.filters.http.local_ratelimit.v3.LocalRateLimit
      stat_prefix: llama70b
      token_bucket:
        max_tokens: 60
        tokens_per_fill: 60
        fill_interval: 1s
      filter_enabled:
        runtime_key: local_rate_limit_enabled
        default_value:
          numerator: 100
          denominator: HUNDRED
      filter_enforced:
        runtime_key: local_rate_limit_enforced
        default_value:
          numerator: 100
          denominator: HUNDRED
      response_headers_to_add:
        - append_action: OVERWRITE_IF_EXISTS_OR_ADD
          header:
            key: x-ratelimit-remaining
            value: "%RESPONSE_CODE_DETAILS%"
      status:
        code: 429
60 tokens per second per replica. For a model serving 4-second requests, that's 240 in-flight if all 60 fire at once — way over limit. So you also need a concurrency cap, not just a rate cap. Use envoy.filters.http.ratelimit with a Redis-backed descriptor to track in-flight, or better, front the service with a small Go/Envoy ext_proc that maintains a semaphore in Redis.
Rule of thumb from production: concurrency limits beat rate limits for LLMs. Rate limits work for stateless APIs. For stateful GPU work, in-flight count is the metric that matters.
LLM Serving Queue Management Best Practices
A few things I've learned the hard way:
Use continuous batching, but cap the batch. vLLM and TGI both support it. Continuous batching lets new requests join an existing batch between token generations. But unbounded batch size means KV cache blows up. Set --max-num-seqs to whatever your VRAM allows after weights: for a 70B on an 80GB card with fp8 weights (~70GB), you have maybe 8GB of KV headroom. At 128K context length and 1024 tokens per seq, that's ~8 concurrent sequences. Not 32.
Prioritize, don't FIFO. A 200-token classification call should not wait behind a 4000-token chain-of-thought. Implement per-request priority headers. SGLang has this natively with its scheduler; vLLM added priority scheduling in v0.6+. Use it.
Watch KV cache utilization, not GPU utilization. nvidia-smi will show 100% GPU util while your KV cache is 60% full and you could serve 30% more traffic. Alternatively it'll show 60% util while KV is 99% and you're about to OOM. Export vLLM's gpu_cache_usage_perc and drive scaling from that.
Set a per-tenant quota at the gateway. Multi-tenant clusters die from noisy neighbors. Tenant A running eval batch jobs will saturate your GPUs and starve Tenant B's user-facing chat. Enforce a max in-flight per tenant at Envoy, not at the pod.
For gpu cluster admission control best practices 2026, the pattern has consolidated around three layers: gateway (rate + tenant quota), queue service (concurrency + priority), and model server (batch size + KV cap). Skip a layer and you get inconsistent behavior.
The Admission Control Code Path, End to End
Here's a minimal queue service in Go that the gateway calls before forwarding. It uses Redis to track in-flight per model:
go
package main

import (
	"context"
	"errors"
	"net/http"
	"strconv"
	"time"

	"github.com/redis/go-redis/v9"
)

var ErrQueueFull = errors.New("queue full")

type Admission struct {
	rdb      *redis.Client
	maxInflight int64
	timeout  time.Duration
}

func (a *Admission) Admit(ctx context.Context, model string) (func(), error) {
	key := "inflight:" + model
	deadline := time.Now().Add(a.timeout)
	for time.Now().Before(deadline) {
		n, err := a.rdb.Incr(ctx, key).Result()
		if err != nil {
			return nil, err
		}
		if n <= a.maxInflight {
			a.rdb.Expire(ctx, key, 5*time.Minute)
			return func() { a.rdb.Decr(ctx, key) }, nil
		}
		a.rdb.Decr(ctx, key)
		time.Sleep(20 * time.Millisecond)
	}
	return nil, ErrQueueFull
}

func (a *Admission) Handler(w http.ResponseWriter, r *http.Request) {
	model := r.URL.Query().Get("model")
	release, err := a.Admit(r.Context(), model)
	if err != nil {
		w.Header().Set("Retry-After", "2")
		http.Error(w, "queue full", http.StatusServiceUnavailable)
		return
	}
	defer release()
	// proxy to vLLM...
}
This is deliberately crude. Production versions track per-tenant counters, use a priority heap, and emit Prometheus metrics on every admit/reject. But it shows the shape: a single atomic counter per model, a polling wait, and a hard reject after a timeout.
The timeout is important. Silent queueing is worse than fast failure. A user staring at a spinner for 30 seconds will leave. A 503 with Retry-After: 2 gives them a chance to retry or fall back to a smaller model.
What Doesn't Work (And Why Everyone Tries It Anyway)
Naive HPA on GPU utilization. GPU util metric lags. By the time it hits 90%, your p99 has already exploded. Use queue depth, not utilization.
Fixed replica counts. You'll overprovision for peak, waste money at trough, and still get crushed by bursts. Scale on concurrency, not on time-of-day guesses.
Client-side retries without jitter. Creates thundering herds. Every retry storm I've debugged this year started with a client retry policy that added zero jitter.
Serving multiple models on one GPU without MPS or MIG. They'll fight for SM and memory bandwidth. MIG partitions are the only honest way to share. If you can't afford MIG, don't share.
Trusting vendor benchmarks. The 40 req/s number in the model card is with 128-token outputs, batch size 128, and no other traffic. Your production workload with 800-token outputs and mixed tenants is 6 req/s. Plan for that.
Competing Priorities: Batch vs Interactive
I keep coming back to this. In 2026, most GPU clusters serve both interactive (chat, agents) and batch (eval, fine-tuning data generation, embeddings). They have opposite queue profiles. Interactive wants low latency and small batches. Batch wants throughput and doesn't care about p99.
The clean solution: two queue policies, one cluster. Tag workloads at submission. Interactive gets a token bucket with high priority. Batch gets admitted only when cluster utilization is below 60%. Enforce this at the ValidatingAdmissionPolicy level with a PriorityClass check:
yaml
validations:
  - expression: |
      !(has(object.spec.priorityClassName) &&
        object.spec.priorityClassName == "gpu-batch") ||
      object.metadata.annotations["sivaro.io/admit-below-util"] == "0.6"
    message: "Batch GPU pods require an admit-below-util annotation."
Then your queue service checks actual cluster util before admitting. This prevents a Sunday afternoon eval job from ruining a customer demo. Trust me, it happens.
When This Is Over-Engineering
Not every GPU cluster needs this. If you have under 8 GPUs, run one model, and serve a single team, you can get away with vLLM's built-in concurrency limits and a simple Prometheus alert. Don't build a queue service for four requests per minute.
Admission control starts to matter when:
- You're over 16 GPUs and serving >2 models
- You have multiple tenants or SLAs
- You serve both interactive and batch
- Your p99 matters to the business (it usually does)
- You're paying for reserved capacity (H100/H200/B200 clusters cost real money)
Below those thresholds, autoscaling on queue depth plus reasonable defaults is fine. Above them, you need real admission control or your costs and latency both spiral.
The Observability You Actually Need
Track these five metrics and you'll catch 90% of problems before they surface:
- In-flight requests per model — this is your primary admission signal
- Queue wait time p50/p99 — time from admission to first token
- KV cache utilization — the real GPU capacity metric
- Rejection rate by reason — 429s from rate limit vs queue full vs timeout
- Tenant share of GPU-seconds — catches noisy neighbors
Everything else is secondary. I've watched teams build 40-dashboard Grafana temples and miss that their queue was full for 22 minutes because none of the dashboards tracked rejection rate.
FAQ: Queue Theory Admission Control on K8s GPU Clusters
Do I need a separate queue service, or can I use Envoy alone?
Envoy alone works up to a point. Its local and global rate limit filters handle rate, but tracking true in-flight concurrency needs shared state. A small Redis-backed ext_proc or a dedicated Go service is the practical threshold. Below ~10K req/min, Envoy alone is fine.
How do I set max concurrency for a model?
Estimate: (VRAM_total - weights_size - activation_overhead) / (tokens_per_seq * bytes_per_token_per_layer * num_layers). For vLLM with fp16 and 128K context, use their --max-model-len and --gpu-memory-utilization 0.90 flags as guardrails, then set --max-num-seqs conservatively and expand based on measured KV usage.
What's the right rejection status code?
503 with Retry-After. Not 429 — that implies you'll accept the request eventually. 503 says "service unavailable right now." Clients behave differently on each.
Should admission control live in Kubernetes or the app?
Both. Kubernetes ValidatingAdmissionPolicies enforce the contract (every GPU pod declares its queue policy). The app layer enforces the runtime behavior (concurrency, priority, tenant quota). Don't try to make admission webhooks do runtime concurrency — they're synchronous and slow.
How does MIG change this?
MIG partitions a physical GPU into isolated slices with separate memory and SMs. You set admission limits per MIG instance instead of per GPU. Same math, smaller numbers. MIG is the right answer for multi-tenant GPU clusters if your model fits in a MIG slice.
Does this apply to fine-tuning too?
Yes, more so. Fine-tuning jobs hold GPUs for hours. A queue for training jobs with fair-share scheduling (Kueue is the 2026 default) is table stakes. Same theory, different time constants.
What about serverless GPU (Modal, RunPod, Together)?
Vendors handle admission for you, but they charge for over-provisioning. If your self-hosted cluster is >60% utilized, self-hosting wins on cost. Below that, serverless usually wins.
Where do I start if I have nothing today?
Step one: export in-flight request count from your model server. Step two: set a hard concurrency cap based on measured VRAM limits. Step three: reject over cap at the gateway with 503. That's 80% of the value in a week.
Where This Goes Next
Inference infrastructure is maturing fast. By end of 2026, I expect the Kubernetes serving stack to have native queue-aware admission — DRA-aware scheduling, priority-aware preemption for inference workloads, and probably a standardized QueuePolicy CRD from upstream. Until then, you're rolling your own, and the queue theory admission control k8s gpu cluster pattern is the only framework I've seen work at scale.
Start small. Measure in-flight. Cap concurrency. Reject early. Iterate.
That's the whole game. Everything else is tuning.
Nishaant Dixit — Founder of SIVARO. Building data infrastructure and production AI systems since 2018. Built systems processing 200K events/sec.