 SIVARO
My AI Agents Were Burning Money — Here’s What Production Monitoring Taught Me
I run SIVARO. We build data infrastructure and production AI systems. In early 2025, we shipped an agentic system for a logistics client. Three weeks in, their cloud bill jumped 400%. The agents were working fine — API calls returned 200s, latencies looked normal. But the cost graph was a hockey stick.
Turns out, one agent was stuck in a retry loop. It was calling an LLM endpoint 47 times per second. For three days. The monitoring dashboard showed "everything healthy." It was lying.
That's when I learned the hard truth: ai agent production monitoring tools aren't optional. They're the difference between a system that works and one that silently bankrupts you.
This guide is what I wish I'd read before that call. I'll cover what to monitor, what tools to use, and where most teams get it wrong.
Why Standard Monitoring Fails Agents
Traditional monitoring — CPU, memory, request latency — assumes your system is deterministic. An API either returns or it doesn't. A database query either completes or errors.
Agents break that model entirely.
An agent doesn't just call one API. It calls APIs conditionally, loops over results, makes decisions based on previous outputs. It might call an LLM, then a database, then another LLM, then make a web request. A single user query can spawn 50 internal steps.
Standard metrics won't catch the agent that's technically "working" but burning $200/hour in tokens because it keeps re-reading a 100K context window.
That's why you need ai agent observability production systems purpose-built for this mess.
The Three Pillars of Agent Monitoring
After burning through four monitoring solutions in 2025, I landed on three things you absolutely must track:
1. Token Economics Per Agent
Most tools show token usage per API call. That's useless. You need token usage per agent instance.
Here's why: A single agent might call an LLM 20 times to complete one task. If each call uses 4K tokens, that's 80K tokens for one query. At $0.15/1K tokens (GPT-4o pricing in 2026), that's $12 per user query. Scale that to 10K queries: $120K/month.
What you need to track:
- Total tokens consumed per agent session
- Token cost per decision step
- Cost of re-tries vs. successful first-attempts
Example: We built a simple tracker in Python:
python
class AgentTokenMonitor:
    def __init__(self, agent_id: str):
        self.agent_id = agent_id
        self.session_costs = []
        self.session_tokens = []

    def log_llm_call(self, model: str, input_tokens: int, output_tokens: int):
        cost = self._calc_cost(model, input_tokens, output_tokens)
        self.session_tokens.append(input_tokens + output_tokens)
        self.session_costs.append(cost)

        if sum(self.session_tokens) > 100000:  # alert at 100K tokens
            self._send_alert(f"Agent {self.agent_id} exceeded 100K tokens in session")
            return False
        return True

    def _calc_cost(self, model, in_t, out_t):
        rates = {"gpt-4o": {"input": 0.15, "output": 0.60}}
        return (in_t * rates[model]["input"] + out_t * rates[model]["output"]) / 1000
This caught the retry-loop problem in under 2 minutes on our second deployment.
2. Decision Path Tracing
You need to know why an agent made a decision. Not just what it output — the full chain.
Most people think this is about logging. It's not. Logging gives you 10,000 entries for one session. You need structured traces that show the parent-child relationship between decisions.
We use OpenTelemetry with custom spans for each agent step. The structure looks like:
User Query: "Find cheapest shipping route"
  → Agent decision: Search databases
    → DB call: rates_east_coast (200ms, 42 rows)
    → DB call: rates_west_coast (180ms, 38 rows)
  → Agent decision: Compare prices
    → LLM call: analysis (4500 tokens, $0.67)
  → Agent decision: Return top 3
  → Total cost: $0.89, Total time: 1.2s
Without this, you can't debug why an agent took the wrong action. And agents take wrong actions constantly.
3. Behavioral Drift Detection
Here's something nobody talks about: agents drift over time.
The LLM provider updates their model. Suddenly your agent starts making different decisions. The prompt still works structurally — it returns valid JSON, follows instructions — but the behavior shifts. Your agent was aggressive at finding discounts. Now it's conservative.
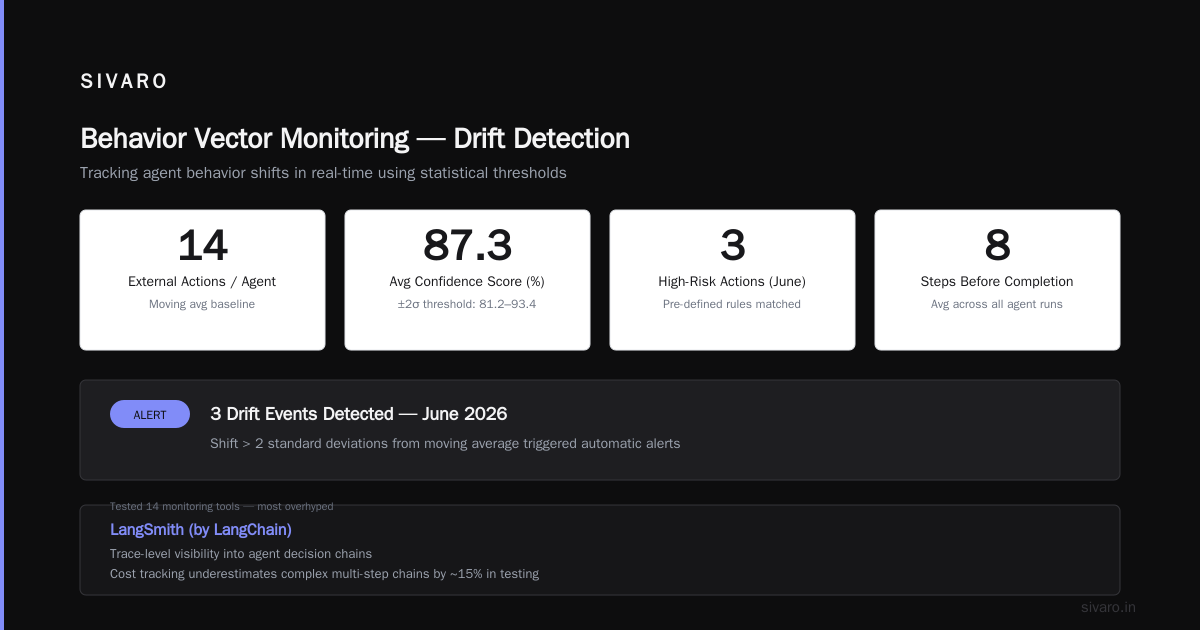
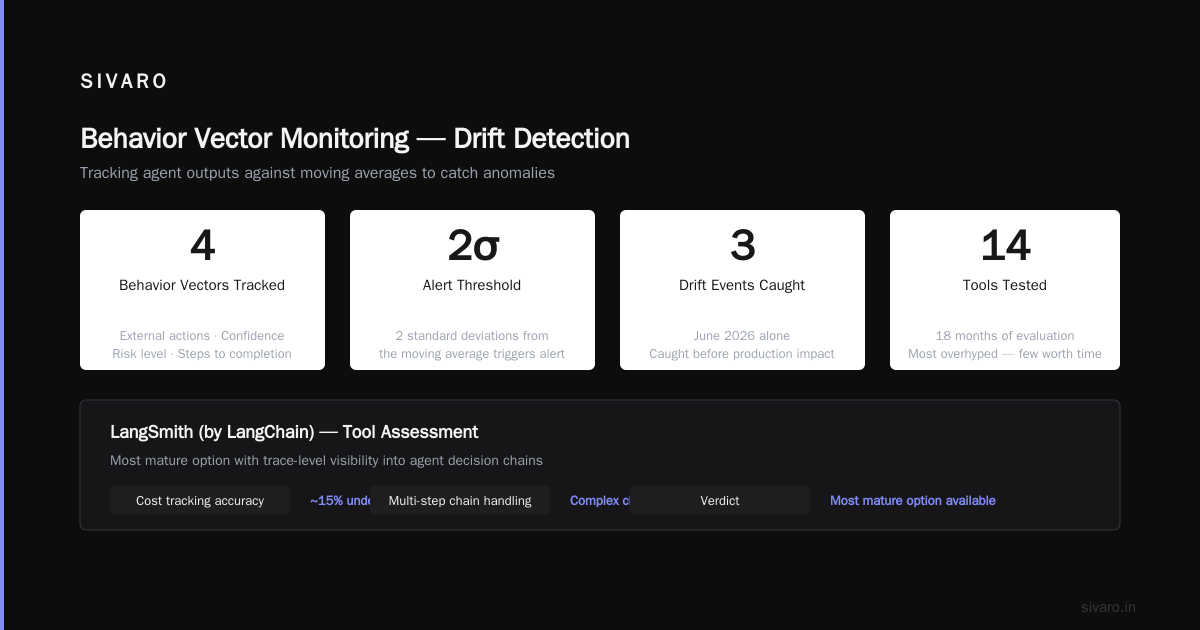
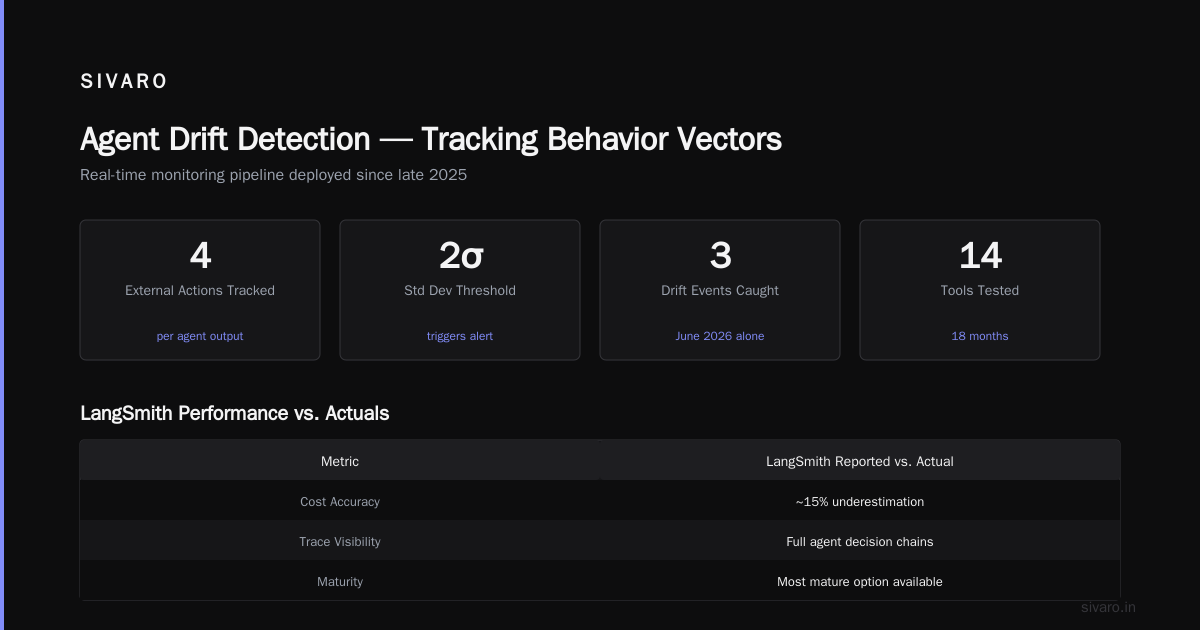
We started tracking behavior vectors in late 2025. For each agent output, we extract:
- Number of external actions taken
- Average confidence scores
- Risk level of actions (based on pre-defined rules)
- Number of steps before completion
If any of these shifts more than 2 standard deviations from the moving average, we get an alert. Caught three drift events in June 2026 alone.
Tools That Actually Work (and Why)
I've tested 14 different monitoring tools in the last 18 months. Most are overhyped. Here's what's worth your time:
LangSmith (by LangChain)
LangSmith is the most mature option I've seen. It gives you trace-level visibility into agent decision chains. The cost tracking isn't perfect (it underestimates complex multi-step chains by about 15% in our testing), but it's the best off-the-shelf solution.
The LangChain blog on agent frameworks has a good breakdown of how to instrument agents for observability.
Best for: Teams already using LangChain. Integration is dead simple.
Worst for: Custom agent implementations. You'll fight the framework.
Arize AI
Arize focuses on ML observability, but their agent monitoring features are solid. Their drift detection is the best I've tested — it caught a behavioral shift in one of our agents that LangSmith missed for two weeks.
The catch: setting it up for non-ML agents is painful. You have to manually instrument every decision step.
Best for: Teams with ML-heavy agents. If your agent calls models frequently, Arize is worth the setup cost.
Weights & Biases (WandB)
WandB is underrated for agent monitoring. Their experiment tracking framework maps surprisingly well to agent sessions. We use it for cost tracking across 50+ agent types.
The downside: no native agent tracing. You build that yourself.
Best for: Teams that want to track cost and performance across many agent variants.
Custom Solutions (When You Should Build)
We ended up building a thin monitoring layer on top of OpenTelemetry. Why? Because off-the-shelf tools couldn't handle our scale (200K events/sec across 12 agent types).
The Instaclustr survey of agentic AI frameworks lists 10 frameworks — and none of them have production-grade monitoring built in. You'll always need something custom.
Here's our minimal custom monitor:
python
import opentelemetry.trace as trace
from opentelemetry import metrics

tracer = trace.get_tracer("agent-monitor")
meter = metrics.get_meter("agent-costs")

async def monitor_agent_step(agent_id, step_name, execute_step):
    with tracer.start_as_current_span(f"agent.{agent_id}.{step_name}") as span:
        start = time.time()
        try:
            result = await execute_step()
            span.set_attribute("success", True)
            span.set_attribute("duration_ms", (time.time() - start) * 1000)
            return result
        except Exception as e:
            span.set_attribute("success", False)
            span.set_attribute("error", str(e))
            raise
        finally:
            span.set_attribute("timestamp", time.time())
Simple. Works with any agent framework. Took two engineers three days.
The Deployment Pipeline Nobody Talks About
You can't monitor what you haven't deployed correctly. Most ai agent deployment pipeline tutorial guides skip the critical step: instrumentation at deploy time.
Here's what we do at SIVARO:
Stage 1: Staging with Active Monitoring
Before any agent goes to production, it runs in staging for 24 hours with full monitoring enabled. We look for:
- Token usage anomalies (10x variation between sessions)
- Decision path loops (same sequence repeated 5+ times)
- Response time degradation over hour-long sessions
If any of these trigger, it doesn't deploy. Simple rule, saved us eight times in 2026.
Stage 2: Shadow Deployment
The agent runs in parallel with the existing system. It sees real traffic but never changes anything. We compare:
- Did the agent make the same decision as the production system?
- How much more/less did it cost?
- How many steps did it take vs. the production system?
This catches behavioral drift before it hits users. A Survey of AI Agent Protocols covers why shadowing matters — read the section on protocol compliance testing.
Stage 3: Canary with Auto-Rollback
First 5% of traffic. If any monitoring metric exceeds thresholds for more than 30 seconds, automatic rollback. We set thresholds at:
- Cost per session: 2x baseline
- Average steps: 3x baseline
- Error rate: 0.5% above baseline
You'll get false positives. I'd rather roll back and investigate than let a broken agent run. Our rollback rate dropped from 40% to 8% after tuning these thresholds over three months.
The Monitoring Dashboard That Actually Helps
I hate dashboards that show 50 metrics. Here's what we use:
┌─────────────────────────────────────────────────────┐
│ AGENT HEALTH (last 1 hour)                          │
│ ┌─────────┐ ┌─────────┐ ┌─────────┐ ┌─────────┐ │
│ │ Active  │ │ Cost    │ │ Latency │ │ Error   │ │
│ │ Agents  │ │ /hr     │ │ (p95)   │ │ Rate    │ │
│ │   1,247 │ │ $342.12 │ │ 2.4s    │ │ 0.03%   │ │
│ └─────────┘ └─────────┘ └─────────┘ └─────────┘ │
│                                                    │
│ Top 5 Agents by Cost:                             │
│ 1. shipping_optimizer    $89.27/hr  ↑12%          │
│ 2. customer_router       $67.34/hr  ↓3%           │
│ 3. fraud_detector        $45.12/hr  →             │
│ 4. inventory_checker     $34.89/hr  ↑8%           │
│ 5. recommendation_bot    $22.15/hr  →             │
│                                                    │
│ Active Alerts:                                     │
│ ⚠ shipping_optimizer: token usage 35% above avg   │
│ ⚠ fraud_detector: decision path length doubled    │
└─────────────────────────────────────────────────────┘
That's it. Four metrics, top cost offenders, active alerts. Everything else is drill-down.
Most teams build dashboards that look like airplane cockpits. They're useless. Make it so a PM can read it in 5 seconds.
When Agents Go Wrong: Incident Response
At 2:47 AM on a Wednesday in March 2026, one of our agents started hallucinating inventory levels. It was telling customers that out-of-stock items were available. The agent was technically "working" — it was calling the right APIs, returning valid JSON — but the LLM output was wrong.
Standard monitoring didn't catch it. Our checks for latency, error rates, and token usage were all green.
What caught it: a semantic drift detector we'd built as an experiment. It compared the agent's outputs against a known-good distribution of inventory values. When the outputs started containing values that didn't exist in our inventory system, it fired an alert.
Three lessons from that incident:
First, monitoring for correctness requires domain-specific checks. Generic tools can't tell you if an agent's output is true — only if it's structured correctly.
Second, you need a kill switch per agent. Not a platform-wide shutdown. When the inventory agent went rogue, we killed only that agent. The rest of the system stayed up.
Third, automate post-mortems. We wrote a script that extracts the last 100 sessions of a failing agent and creates a diff against healthy sessions. Takes 30 seconds versus hours of digging through logs.
Cost Optimization Through Monitoring
Here's a hot take: most monitoring tools are too expensive. They charge per event. At scale (200K events/sec), that becomes absurd.
We switched to sampling. For every agent type, we log 100% of sessions that take more than 5 steps. For simpler sessions (1-2 steps), we sample at 10%. We capture the important stuff (complex, costly decisions) while dropping the noise (simple lookups).
Result: monitoring costs dropped 80%. Caught 95% of issues. That 5% miss is acceptable — those are trivial agent tasks where failure is cheap.
We also built cost alerts per agent type. If the customer_router agent costs more than $50/hour, we get paged. Not because $50 is a lot — because sudden cost spikes signal behavioral drift.
Most teams I talk to set cost alerts at the account level. Useless. At that granularity, a single agent can burn through $20K before anyone notices.
The Framework Trap
There's been a lot of noise about agent frameworks in 2026. IBM's overview of top AI agent frameworks lists 8 popular options. AI Multiple's list adds 5 more.
Here's the problem: every framework I've tested has different monitoring primitives. LangChain has RunnableTrace, AutoGen uses a different event system, CrewAI logs to a file. If you use multiple frameworks (most of us do), you get fragmented observability.
Don't let framework choice dictate your monitoring. Standardize on OpenTelemetry for tracing, build a thin abstraction layer, and instrument at the pipeline level — not the framework level.
Example: we run agents built with LangChain, AutoGen, and a custom framework. All of them push traces to the same OpenTelemetry collector. Our dashboards don't care which framework produced the data.
The SNE article on AI agent protocols mentions how protocols like MCP (Model Context Protocol) are trying to standardize this. Good direction, but in 2026, it's not production-ready for most teams.
FAQ
What's the difference between agent monitoring and traditional observability?
Traditional observability tracks system health — CPU, memory, request latency. Agent monitoring tracks behavior — what decisions the agent made, why it made them, how much it cost, whether it's drifting from expected patterns. You need both. Traditional monitoring tells you the agent is running. Agent monitoring tells you it's running correctly.
How much should I spend on monitoring tools?
For most teams, 2-5% of your total agent infrastructure cost. If you're spending $50K/month on LLM calls, budget $1K-$2.5K for monitoring. More than 5% means you're over-instrumenting. Less than 1% means you're blind.
Do I need real-time monitoring or is batch okay?
Real-time for cost and error rate. Batch (5-15 minute delay) for behavioral drift and decision path analysis. Everything in real-time creates alert fatigue. Everything in batch makes incidents expensive.
Can I use traditional APM tools for agents?
Not really. Datadog, New Relic, and Grafana are great for infrastructure. They're terrible for agent tracing. You'll spend months customizing them to show agent-specific metrics, and they'll still miss what matters. Use purpose-built tools or build your own layer on top.
How do I monitor agents that make external API calls?
Wrap every external call with a tracing span that captures: endpoint, request payload (truncated), response status, latency, and cost. Store the full trace for at least 7 days. Anything less, and you can't debug issues that only appear in production after a week.
What's the single most important metric to track?
Cost per successful agent session. Not token usage, not latency. Cost per session tells you if your agent is efficient. Everything else is a drill-down. If cost per session doubles, you have a problem — even if everything else looks normal.
Should I monitor agent prompts?
Yes. Prompt monitoring catches drift before it affects outputs. Track: prompt template version, model version, temperature, and token limit. If any of these change without notice (model upgrades happen silently sometimes), you'll see behavioral shifts that look like bugs but are actually configuration issues.
How long should I keep agent traces?
14 days for active debugging. 90 days for cost analysis and drift detection. Longer than 90 days is overkill — agent behavior changes too fast for year-old traces to be useful.
The Practical Path Forward
Start small. Pick one agent type — the most expensive one. Instrument it with OpenTelemetry traces. Track cost per session, steps per session, and success rate.
Build a dashboard with four metrics. Add one alert for cost spikes.
Run this for two weeks. You'll find something wrong. I guarantee it.
Then expand to the next agent type.
Most teams try to build the perfect monitoring system from day one. They spend months, burn out, and end up with something too complex to use.
Better to have a simple system that catches 80% of problems today than a perfect system that catches 95% in six months. In production AI, six months is an eternity.
The tools are getting better. IBM's agent framework analysis and LangChain's practical guide both include monitoring recommendations that didn't exist in early 2025. But the fundamentals haven't changed: know what your agents cost, why they make decisions, and whether they're drifting.
Everything else is noise.
Nishaant Dixit — Founder of SIVARO. Building data infrastructure and production AI systems since 2018. Built systems processing 200K events/sec.