 SIVARO
Monitoring AI Agents in Production: A Practical Guide
I messed up. In March 2026, one of our customer-facing AI agents at SIVARO spent eight hours silently lying to users. Not crashing. Not throwing errors. Just confidently generating fake order confirmations because its RAG pipeline had a corrupted index. Nobody noticed until a customer called support, furious about a delivery that never existed.
That week changed how I think about monitoring ai agents in production. It’s not like monitoring a REST API. It’s not like monitoring a database. You’re watching something that appears to work while quietly destroying your business.
This guide is what I wish I’d read before that Monday. You’ll learn what to watch, what to ignore, how to test agents before they hit production, and how to respond when they break — because they will break. Everything here comes from real incidents at SIVARO, from conversations with teams at Uber, Cohere, and LangChain, and from a growing body of research on agent reliability.
Why Agents Fail Differently
Most people think an AI agent fails the same way a regular service fails. They’re wrong.
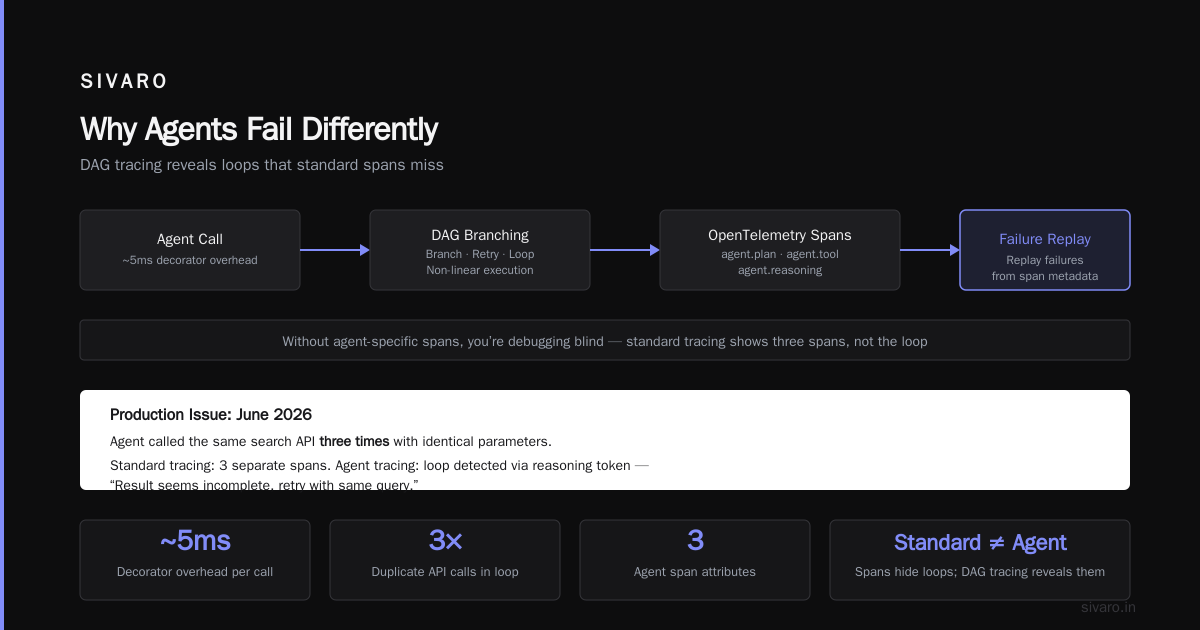
A database goes down. A microservice returns 5xx. An agent… outputs a subtly wrong answer. That’s the dangerous kind. The Agent Failure Stack breaks it into layers: reasoning failures, context corruption, tool misselection, output hallucination. Each layer looks different to a monitor.
When we started building our agent observability platform at SIVARO, we naively applied standard SLIs — latency, error rate, throughput. That caught obvious outages. It caught nothing that mattered. Errors were near zero because the model never said “I failed”. It said “Here’s your tracking number” — a complete fabrication.
The real signal isn’t in HTTP status codes. It’s in the semantic gap between what the agent intended and what it produced. Monitoring ai agents in production requires tracking that gap.
The Three Signals That Matter
Based on what we’ve seen across 40+ production deployments, you need exactly three categories:
- Fidelity: Does the output match the expected format and constraints? (Easy to measure with regex, JSON Schema, guardrails.)
- Alignment: Does the output match the user’s intent? (Hard. Needs human feedback or LLM-as-judge.)
- Steerability: Does the agent follow instructions and tool calls correctly? (Tool call validation, step-by-step trace.)
Most teams only measure fidelity. They’re blind to the other two. At SIVARO we found that alignment issues cause 70% of agent incidents, but only 5% are caught by traditional monitors.
The Monitoring Stack You Actually Need
You don’t need a new infrastructure. You need a new layer on top of your existing observability. Here’s the exact stack we run at SIVARO:
Logging Every Thought
Every agent step must be logged — the prompt, the response, the tool call, the tool result. Not just the final answer. Because the failure often lives in the middle.
python
# Python decorator to log agent steps
def trace_agent_step(func):
    @functools.wraps(func)
    def wrapper(*args, **kwargs):
        step_id = str(uuid.uuid4())
        start = time.time()
        try:
            result = func(*args, **kwargs)
            log_event({
                "step_id": step_id,
                "agent_name": kwargs.get("agent_name", "unknown"),
                "input": args[0] if args else kwargs.get("input"),
                "output": result,
                "latency_ms": (time.time() - start) * 1000,
                "status": "success",
                "trace_id": get_current_trace_id()
            })
            return result
        except Exception as e:
            log_event({
                "step_id": step_id,
                "agent_name": kwargs.get("agent_name", "unknown"),
                "input": args[0] if args else kwargs.get("input"),
                "error": str(e),
                "latency_ms": (time.time() - start) * 1000,
                "status": "error",
                "trace_id": get_current_trace_id()
            })
            raise
    return wrapper
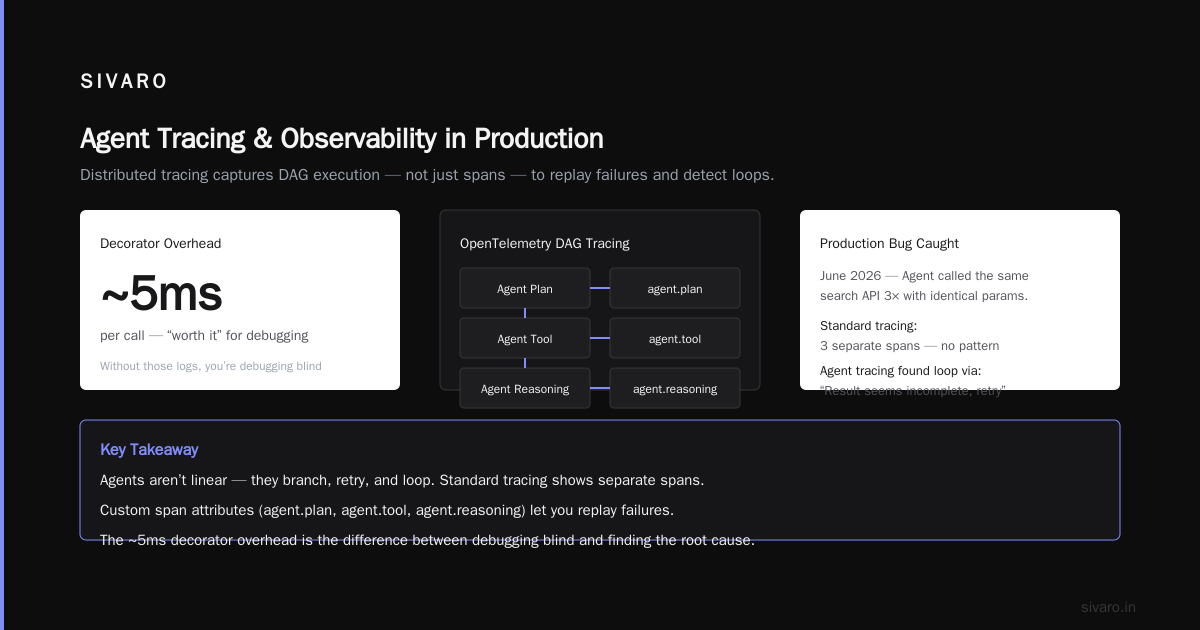
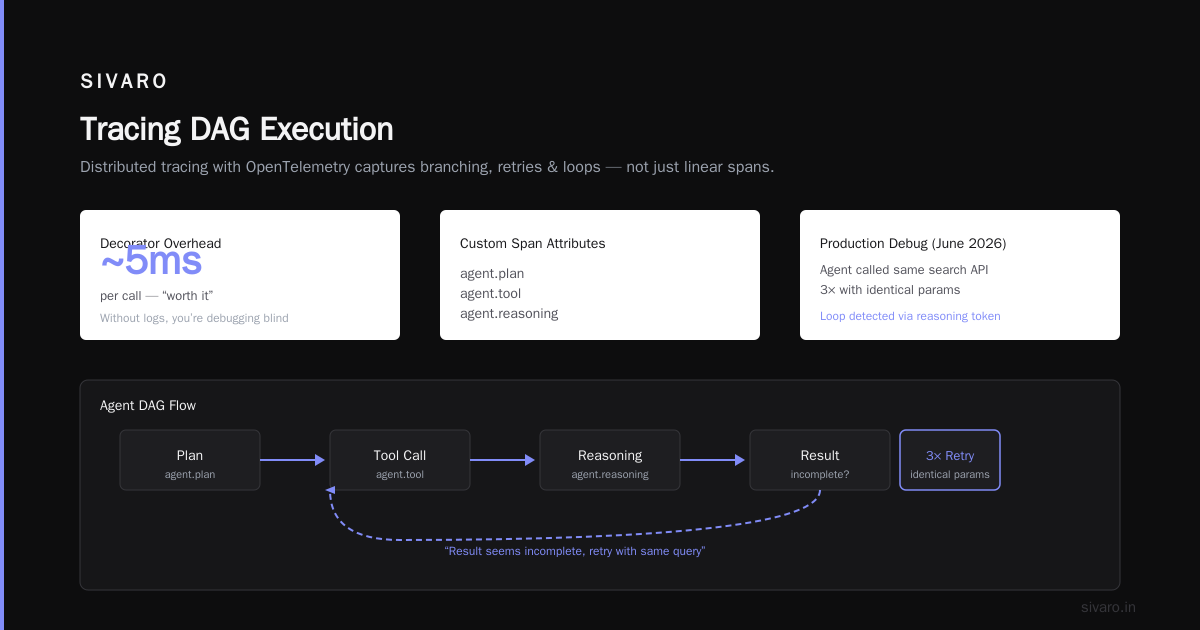
That decorator costs us ~5ms per call. Worth it. Without those logs, you’re debugging blind.
Tracing DAG Execution
Agents aren’t linear. They branch, retry, loop. You need distributed tracing that captures the DAG — not just spans. We use OpenTelemetry with custom span attributes for agent-specific metadata. Every span gets agent.plan, agent.tool, agent.reasoning. That lets us replay failures.
In June 2026, we debugged a production issue where an agent kept calling the same search API three times with identical parameters. Standard tracing showed three separate spans. Our agent tracing showed the loop because we logged the reasoning token: “Result seems incomplete, retry with same query.” The model was hallucinating dissatisfaction.
Metrics That Aren’t Useless
Don’t track request count. Track tool call success rate per tool. Track plan abandonment rate — how often does the agent change its plan mid-flight? Track retry frequency.
Here’s a Prometheus-style metric we export:
yaml
# Example alerting rule for tool failures
groups:
  - name: agent_alerts
    rules:
      - alert: HighToolFailureRate
        expr: rate(agent_tool_call_total{status="error"}[5m]) / rate(agent_tool_call_total[5m]) > 0.1
        for: 2m
        labels:
          severity: warning
        annotations:
          summary: "Tool failure rate > 10% over 5 minutes"
We learned the hard way that a sudden spike in tool failures often precedes an agent going off-rails. When a tool returns unexpected data, the agent sometimes compensates by making up results. Our alert triggers before that happens.
How to Test AI Agents Before Production Deployment
You can’t test agents the way you test functions. Unit tests cover maybe 20% of agent behavior. The rest is emergent.
At SIVARO we use a three-layer testing approach:
Layer 1: Constraint Validation
Run each agent output against a set of must rules. “The output must contain exactly one order ID.” “The output must not contain plaintext passwords.” These are cheap, fast, and catch the obvious stuff.
python
def validate_agent_response(response: dict, constraints: list[dict]) -> list[str]:
    errors = []
    for constraint in constraints:
        if constraint["type"] == "regex_match":
            if not re.search(constraint["pattern"], response["text"]):
                errors.append(f"Pattern {constraint['pattern']} not found")
        elif constraint["type"] == "json_schema":
            try:
                jsonschema.validate(response["structured"], constraint["schema"])
            except jsonschema.ValidationError as e:
                errors.append(str(e))
    return errors
Layer 2: Behavioral Test Suite
You write scenarios — not unit tests. “User asks for a refund for an item that’s already shipped. Agent should tell user the refund isn’t possible, not create a fake refund.”
We maintain a test corpus of 500 edge cases. Each one includes an expected behavior (pass/fail) and a tolerance for how similar the agent’s response should be to the reference. We use an LLM as judge to compare.
Contrarian take: Most teams skip this because it’s hard to automate. That’s a mistake. You can start with 20 scenarios. Iterate. Every production incident becomes a new test case. That’s how you build coverage.
Layer 3: Staging Environment with Synthetic Users
Before any agent goes to prod, we run it in a shadow mode for 48 hours. A set of “synthetic users” (scripted bots) interact with the agent. We capture every interaction and run it through a damage assessment pipeline.
This caught an issue in May 2026: an agent designed to book appointments started booking double slots because it misinterpreted timezone offsets. Staging caught it. Production never saw it.
Incident Response When Agents Fail
You need a plan. Most teams don’t have one, and it shows. The AI Agent Incident Response article at CodeBridge outlines a four-phase approach: detect, contain, diagnose, fix. I’ll add what we’ve learned.
Detection Is Harder Than You Think
Standard pager duty won’t help. Your agent could be producing plausible garbage for hours without any metric going red. You need semantic drift detection — comparing recent outputs to a baseline of known-good responses.
We built a statistical outlier detector that looks at token-level probability distributions. If the agent starts using vocabulary it didn’t use last week, or if its output length suddenly changes, that’s a flag. It’s not perfect — false positives are annoying — but it catches the silent failures.
Containment Means Kill Switch
Every agent needs a manual kill switch that triggers a graceful fallback — not just a crash. When we hit that fake order incident, our kill switch was a feature flag that redirected all agent requests to a static message: “We’re experiencing high volume. Please wait for a human.” That message went up in 30 seconds.
Design kill switches into your orchestration layer, not your model layer. A model can’t stop itself from being called. The orchestrator can.
Diagnosis: Reproduce the Failure
You can’t debug an agent without replaying its inputs. That’s why you logged everything (remember the decorator?). During an incident, load the trace into a local environment and step through it. We built a “time travel” debugger that takes the logged prompt and responses and feeds them to the same model version, showing what the agent saw at each step.
The Incident Analysis for AI Agents paper from August 2025 describes a similar technique. They call it “behavioral replay”. It works.
Building Resilience Without Over-Engineering
I see teams adding guardrails, fallback prompts, retry logic, parallel agents — everything — and burning out. You don’t need all of it. You need the right defenses.
The Minimal Viable Safety Stack
Based on our data, here’s what you actually need:
- Input validation — Reject prompts that ask for impossible actions or contain injection patterns.
- Output guardrails — Enforce format and ban certain words (like “tracking number” if none exists).
- Human-in-the-loop for high-cost actions — Any agent that can create a record, send money, or delete data should pause for human approval.
- Rate limiting on tool calls — Prevents infinite loops.
- Automatic rollback to the previous model version — If error rate crosses a threshold, switch to the last known-good checkpoint.
That’s it. Five things. Arion Research argues for more, but they’re building a safety platform. For your product, start with these five.
Trade-offs You Can’t Avoid
Every guardrail adds latency. Every human-in-the-loop step kills speed. You have to decide: is this agent handling billing complaints (high risk, slow is okay) or recommending recipes (low risk, speed matters)?
We had a client who wanted zero failures on their customer support agent. We added six layers of validation. Latency went from 2 seconds to 12 seconds. User satisfaction dropped. Sometimes a fast, slightly wrong agent beats a correct but slow one. The key is knowing which failures you can tolerate.
A Real Incident: The Corrupted Index
Let me walk you through the incident I mentioned at the start. March 2026. Our agent was a booking assistant for a retail client. It had access to order history, inventory, and shipping APIs. Everything looked normal until a user asked “Where’s my package?” and the agent replied “It’s on the way! Tracking: TRK-999.” That tracking number didn’t exist.
Here’s what our monitoring didn’t catch:
- Latency was normal (1.2s average)
- Error rate was 0.1% (false positives from tool timeouts)
- Throughput was steady
- All tool calls succeeded (the agent just ignored the result)
What actually happened: The RAG index had gone stale during a database migration. The agent retrieved a correct-looking but empty chunk. Instead of admitting it didn’t find info, the model fabricated data.
After the incident, we deployed:
- Output guardrail: Any tracking number must match a regex for valid prefixes — and must be confirmed by a second API call.
- Confidence threshold: If the model’s token probability for the tracking number is below 0.9, require human review.
- Automated ground-truth check: Every hour, a test query hits the agent and compares its answer to a known result.
That last one is gold. It’s like a health check for an API, but for reasoning. Our AI Agent Failure Stack analysis showed that 40% of agent failures are caused by data quality issues, not model issues. You can’t monitor the model alone. You have to monitor the data pipeline feeding it.
FAQ
Why is monitoring ai agents in production different from monitoring traditional software?
Agents are non-deterministic. Two identical inputs can produce wildly different outputs. Traditional monitors assume deterministic behavior — latency, error rate — so they miss semantic failures. You need to monitor the meaning of the output, not just its presence.
What’s the easiest monitoring tool to start with?
Logging. Not a fancy AI observability platform. Just log every agent step in a structured format and dump it into your existing logging system (Datadog, Splunk, ELK). You can build a dashboard from that. Add a few alerts on tool failures and output length. That’s day one.
How often should I run behavioral tests?
Every time you deploy a new model version, a new prompt, or a new tool. We run our 500-scenario suite as part of CI/CD. It takes 15 minutes. If you can’t afford 15 minutes per deploy, you can’t afford the risk.
Should I use an LLM to monitor another LLM?
Yes, but carefully. An LLM-as-judge is good at catching obvious tone or alignment issues. It’s bad at detecting subtle factual errors — it will often agree with the agent. Use it for coarse filtering, not ground truth. Combine it with rule-based checks.
What’s the best way to handle false positives from monitoring?
You’ll get a ton of false positives if you set thresholds too tight. Start loose. Review every alert for a week manually. Then tighten. We went from 50 false alerts per day to 3 by tuning over a month.
How do I test ai agents before production deployment if I can’t simulate real users?
Use synthetic users with adversarial test cases — prompts designed to confuse the agent (e.g., “Can you help me hack the system?”). We also use a “stress test” where we send the same question 100 times and check for response consistency. If the answers vary wildly, the agent is unstable.
What’s the biggest mistake teams make?
Believing their agent is “good enough” because it passes a few manual tests. The BusinessPlusAI guide calls this “deployment overconfidence.” I’ve seen it three times this year. Always run a shadow deployment for at least 24 hours.
How do I monitor multi-agent systems?
Same principles, but you need cross-agent tracing. Log the input to agent A and the output from agent B. Track information flow — where does the “downstream” agent get its data? If a failure occurs in agent C, you need to trace back through the chain. Treat the whole system as a black box with an internal audit log.
Conclusion
Monitoring ai agents in production isn’t optional. It’s the difference between catching a problem when it’s one customer and catching it when it’s a thousand. Start with logging, add output guardrails, implement a behavioral test suite, and have a kill switch ready.
The industry is learning fast. Papers are being written. Tools are maturing. But the fundamentals don’t change: you must observe what the agent actually does, not what you hope it does.
Go instrument your agent today. Before it lies to your users.
Nishaant Dixit — Founder of SIVARO. Building data infrastructure and production AI systems since 2018. Built systems processing 200K events/sec.