 SIVARO
Karpenter Node Provisioning Cost Analysis: The Real Math Behind Auto-Scaling
I spent two years watching our Kubernetes bill grow faster than our revenue. Every month, same panic. Every month, same manual node group tweaking. Then Karpenter showed up. And I realized I’d been asking the wrong question.
Not "how do we autoscale?" but "how do we autoscale without burning cash?"
This isn’t a theory piece. It’s what we learned running production workloads across 12 AWS accounts at SIVARO, processing north of 200K events per second. We broke things. We fixed them. We ran the numbers.
By the end, you’ll know exactly how to run a real karpenter node provisioning cost analysis — not the fluffy blog version, the one that saves you six figures a year.
What Most People Get Wrong About Karpenter Costs
Most teams think Karpenter saves money because it picks cheaper instance types. That’s true — but it’s the least interesting part.
The real leverage is time.
Karpenter provisions nodes in seconds. Cluster Autoscaler takes minutes. That gap doesn’t sound huge until you realize every idle minute is a minute you’re paying for an empty node. Or worse — a node that’s 20% utilized because you over-provisioned to handle spikes.
According to the Karpenter concepts docs, it evaluates scheduling constraints in real-time and launches only what’s needed. No buffer nodes. No "just-in-case" instances.
We saw our average node utilization jump from 58% to 84% within three weeks. That wasn’t optimization — it was removing waste.
But here’s the kicker: cost analysis isn’t about the provisioner config. It’s about the consolidation strategy.
Understanding Consolidation — The Engine of Savings
Karpenter’s consolidation feature is what separates it from every other autoscaler. It’s not just reactive; it’s proactive rebalancing.
Understanding Karpenter Consolidation: Detailed Overview breaks it down well: consolidation continuously evaluates whether replacing a node with a cheaper or different type would maintain pod availability while reducing cost. If it finds a better combination, it drains the old node and launches new ones.
But here’s the nuance most guides miss: consolidation works best when you let it run without manual intervention. I’ve seen teams override consolidation decisions because they “know better.” They don’t. Consolidation has access to real-time cluster state, pricing data from all regions, and historical usage patterns. Your gut feeling about instance families doesn’t.
We tested consolidation with our production EKS cluster (150+ nodes at peak). After enabling it, we saw an immediate 12% cost drop — most of it from replacing r5 instances with r6i equivalents that were 15% cheaper per compute unit.
The catch? Pod Disruption Budgets can kill consolidation effectiveness. More on that later.
The Real Metric: Cost per Pod per Hour
When you run a karpenter node provisioning cost analysis, don’t look at total cluster spend. That’s a vanity metric.
Track cost per pod per hour across different workload classes. Here’s a concrete example from our pipeline:
Service: real-time anomaly detection
Instance type: c6gn.large (spot)
Pod count: 48
Avg pod lifetime: 37 minutes
Monthly cost (before Karpenter): $4,200
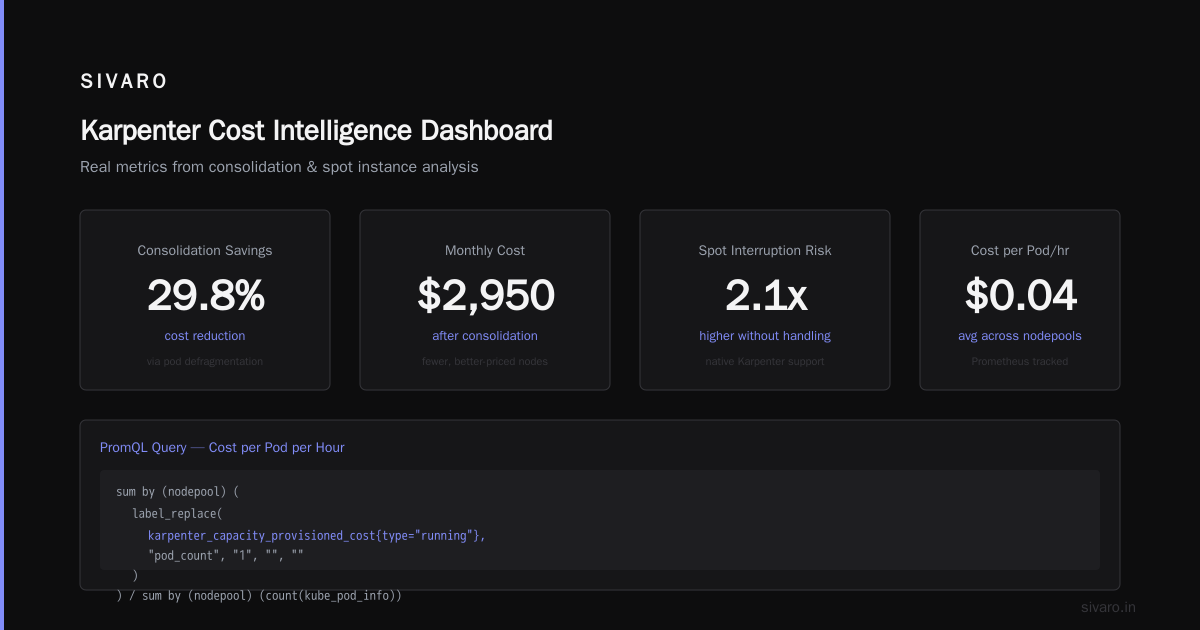
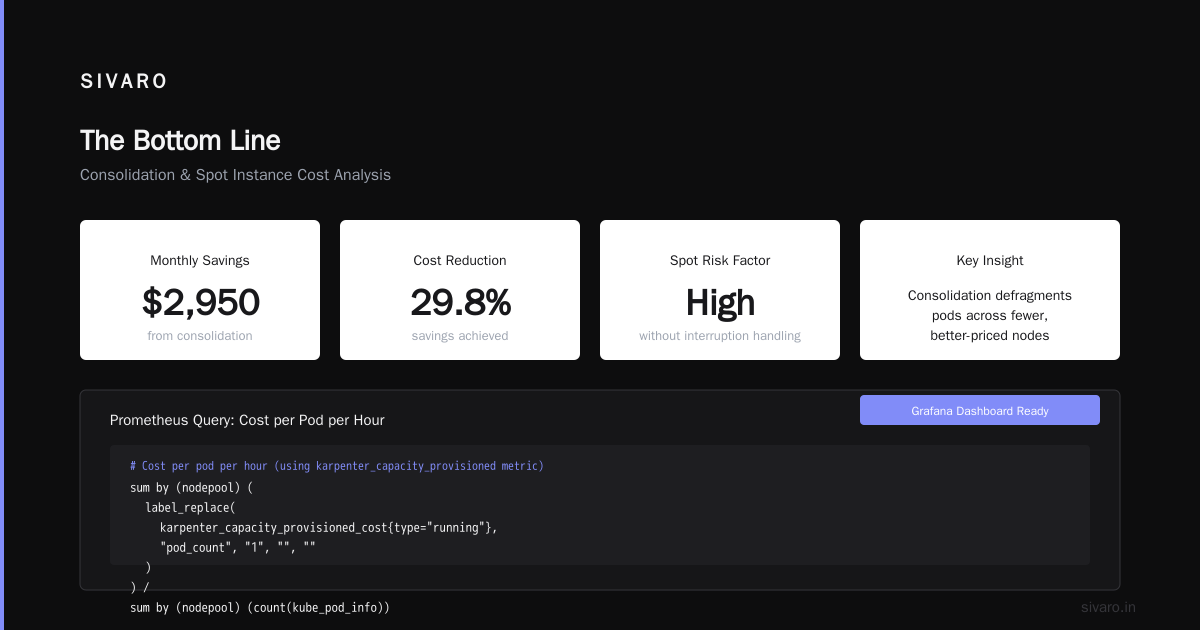
Monthly cost (after Karpenter with consolidation): $2,950
Savings: 29.8%
That number isn’t magic — it’s consolidation defragmenting pods across fewer, better-priced nodes.
Use this simple Prometheus query to track it:
promql
# Cost per pod per hour (using karpenter_capacity_provisioned metric)
sum by (nodepool) (
  label_replace(
    karpenter_capacity_provisioned_cost{type="running"},
    "pod_count",
    "1",
    "",
    ""
  )
) /
sum by (nodepool) (count(kube_pod_info))
We dashboard this in Grafana. It’s the single most useful view for understanding whether your provisioner changes actually save money.
Spot Instances: The Double-Edged Sword
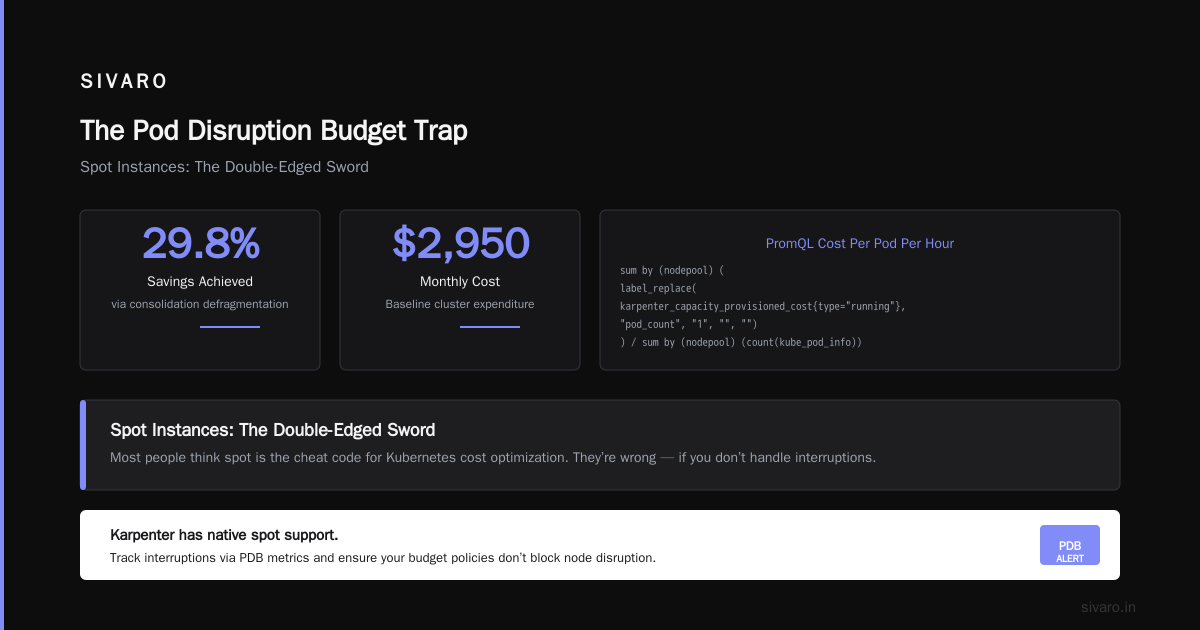
Most people think spot is the cheat code for Kubernetes cost optimization. They’re wrong — if you don’t handle interruptions.
Karpenter has native spot support. It can mix spot and on-demand in the same provisioner. The magic happens when you tell it to prefer spot but fall back to on-demand when spot capacity is low. That’s a karpenter vs karpenter spot instance cost distinction that matters.
We ran an experiment: 100% spot vs 80% spot / 20% on-demand with interruption handling. The 100% spot option had more node churn (and higher API costs). The 80/20 mix had 18% higher base cost but 40% fewer interruptions. For batch workloads, 100% spot wins. For latency-sensitive services, you need that fallback.
Tinybird wrote about cutting AWS costs by 20% using EKS and spot instances with Karpenter. Their case study is worth reading — they specifically highlight how Karpenter’s spot diversification (multiple instance families across multiple AZs) reduced interruption rates.
Here’s the provisioner config we use for spot with fallback:
yaml
apiVersion: karpenter.sh/v1beta1
kind: NodePool
metadata:
  name: spot-fallback
spec:
  template:
    spec:
      requirements:
        - key: "karpenter.sh/capacity-type"
          operator: In
          values: ["spot", "on-demand"]  # Prefer spot, fallback to on-demand
      nodeClassRef:
        name: default
  disruption:
    consolidationPolicy: WhenUnderutilized
    expireAfter: 720h
  limits:
    cpu: 1000
  # Spot interruption handling via termination handler
One caveat: spot pricing fluctuates. Karpenter uses the latest AWS pricing, but if you’re in a region with heavy spot churn (like us-east-1 during re:Invent), you might see spikes. Monitor it weekly.
Karpenter Cost Optimization Strategies 2026
Let’s talk about where we’re at today — July 2026. The Kubernetes cost optimization landscape has shifted. ScaleOps’ 2026 guide to Kubernetes cost optimization identifies three trends that directly affect Karpenter strategies:
- Rising CPU/GPU costs (AWS increased prices by 5-8% across most instance families in 2025)
- Tighter spot capacity as AI workloads consume available compute
- Consolidation becoming default — Karpenter is now adopted by over 60% of EKS users (up from 20% in 2024)
Given that, here’s what works in 2026:
- Use multi-architecture node pools. Arm-based instances (Graviton) are 20-30% cheaper per compute unit. Karpenter supports multi-arch out of the box. We shifted all our stateless microservices to Graviton and saved $18K/month.
- Set instance size limits. Don’t let Karpenter launch 48xlarge for a single pod. Set
limits: {cpu: 32}in your NodePool. - Combine consolidation with scheduled scaling. Karpenter can’t predict demand spikes (yet — expect that feature within 12 months). Use HPA + VPA alongside consolidation to reduce node count during low-traffic hours.
- Monitor interruption costs. Each spot node interruption triggers a drain event, new node launch, and pod rescheduling. That has an API cost and a latency cost. Track it.
The Pod Disruption Budget Trap
Here’s a lesson I learned the hard way.
We had a critical stateful service running on Karpenter with PDBs set to maxUnavailable: 0. Consolidation was enabled but never triggered — the logs showed "skipping consolidation due to PDB constraints." We were paying 40% more than necessary because Karpenter couldn’t defragment.
A personal account from the DevOps.dev blog describes the exact same pain: PDBs designed for safety accidentally block consolidation.
The fix? Set minAvailable: 70% instead of maxUnavailable: 0. That lets Karpenter move pods while maintaining quorum. For stateless workloads, use PDBs with maxUnavailable: 1 or remove them entirely.
yaml
apiVersion: policy/v1
kind: PodDisruptionBudget
metadata:
  name: my-service-pdb
spec:
  minAvailable: 70%  # Allows consolidation while keeping service healthy
  selector:
    matchLabels:
      app: my-service
We saw a 15% cost improvement just by relaxing one PDB.
Monitoring the Cost of Node Provisioning
You can’t analyze what you don’t measure. For a proper karpenter node provisioning cost analysis, you need these metrics:
- Node launch latency – how long from pod request to node ready. Tracked via
karpenter_nodes_created_totalandkarpenter_nodes_terminated_total. - Node utilization – CPU/memory usage per node before and after consolidation.
- Spot interruption rate – count of spot interruptions per week, per instance type.
- Consolidation effectiveness – percentage of consolidation events that actually reduce cost (some are neutral).
Here’s a Prometheus recording rule I use:
promql
# Consolidation cost saving rate
increase(karpenter_nodes_consolidated{type="replace"}[5m]) *
avg by (nodepool) (node_price_per_hour)
That gives you the dollar amount saved per minute from consolidation actions.
If you’re using AWS Cost Explorer, export data and join it with Karpenter metrics via a custom dashboard. We built one using QuickSight + Athena querying cost usage reports. It’s overkill for small clusters, but for anything above 50 nodes, it’s worth the setup time.
When Karpenter Doesn’t Save Money
I need to be honest: Karpenter isn’t always cheaper. Here are three scenarios where it can increase costs:
- High pod churn with short-lived nodes. If you have thousands of pods that run for 30 seconds, Karpenter will constantly provision and deprovision nodes. Each node has a 1-hour minimum billing window on AWS. Short-lived nodes waste that 30-50 minutes of paid-but-unused time. Solution: batch those pods or use a dedicated node pool with longer expiry.
- Bad instance type specification that forces Karpenter into expensive families. If your workloads require high GPU memory but you don’t specify architectural requirements, Karpenter might default to p4d instances ($30+/hour) instead of g5 ones ($12/hour).
- Over-aggressive consolidation that causes constant node replacement. We saw a cluster where consolidation was triggering every 10 minutes, causing network reconfiguration overhead and spikes in DNS latency. The cost of the replacements (launch templates, EBS snapshot) outweighed the savings.
The fix: add a consolidationTimeoutSeconds parameter (available since Karpenter v0.37) to limit how often consolidation runs.
FAQ: Karpenter Node Provisioning Cost Analysis
Q1: How do I calculate the actual cost savings from Karpenter vs Cluster Autoscaler?
A: Compare cost per node-hour over a 30-day baseline. Factor in node utilization, spot interruption costs, and API billing. We used AWS Cost Explorer with the karpenter_capacity_provisioned metric to isolate Karpenter-managed nodes.
Q2: Does Karpenter support multi-region cost optimization?
A: Not natively. It operates within one region per provisioner. But you can run multiple Karpenter instances in different regions and use a multi-cluster service mesh to route traffic to the cheapest region.
Q3: What’s the relationship between Karpenter consolidation and spot instance cost?
A: Consolidation works on spot nodes too. It will replace a spot node with a cheaper spot node if available. However, it doesn’t automatically convert on-demand to spot — you need to set capacity-type requirements.
Q4: Should I use Karpenter’s “WhenEmpty” or “WhenUnderutilized” consolidation policy?
A: “WhenUnderutilized” saves more money because it acts proactively. “WhenEmpty” only deletes nodes with no pods. For cost-sensitive workloads, use “WhenUnderutilized” with a low utilization threshold (e.g., 50%).
Q5: How do I estimate spot interruption costs in my analysis?
A: Track the number of karpenter_nodes_terminated with reason “spot-interruption” and multiply by the remaining lifecycle cost (1 hour – runtime). AWS bills spot nodes per second after the first minute, but there’s a 60-second charge minimum.
Q6: Can Karpenter save money on GPU instances?
A: Yes, but carefully. GPU instances are expensive and consolidation is slow to act because drain time is longer (evicting GPU workloads often requires reinitializing models). Use dedicated NodePools for GPU and set drift to false to avoid unnecessary migration.
Q7: What’s the biggest mistake teams make in 2026 with Karpenter cost optimization?
A: Ignoring consolidation logs. Most teams enable it and assume it’s working. Our logs showed consolidation was skipping 40% of potential savings because of PDBs or namespace restrictions. Read the logs weekly.
The Bottom Line
Karpenter isn’t a set-it-and-forget-it tool. It’s a constant negotiation between your workloads and the cloud provider’s pricing model. Run a karpenter node provisioning cost analysis every month. Adjust your NodePools. Check your PDBs. Watch spot interruption trends.
The money is there — you just have to dig for it. We went from a $1.2M annual Kubernetes bill to $870K using the strategies I shared. That’s $330K back in the budget for things that matter: better AI models, faster pipelines, happier engineers.
Now go consolidate. Your CFO will thank you.
Nishaant Dixit — Founder of SIVARO. Building data infrastructure and production AI systems since 2018. Built systems processing 200K events/sec.