 SIVARO
How to Monitor AI Agents in Production
I spent four months last year building an agent that was supposed to automate customer onboarding. It worked beautifully in staging. In production, it cost us $47,000 in three days because the agent got stuck in a loop calling an expensive LLM over and over. No one caught it until the bill arrived.
That’s the problem with monitoring AI agents. Traditional observability tools were built for request-response systems. An agent isn’t a request. It’s a chain of decisions, tool calls, and external data fetches that can spiral in unpredictable directions. You can’t just check status codes and response times.
Monitoring AI agents in production means tracing the agent’s reasoning loop, tracking every tool invocation, measuring the quality of intermediate outputs, and detecting drift in decision-making. If you’re deploying agents today without this infrastructure, you’re flying blind.
In this guide, I’ll walk through what I’ve learned building agent monitoring systems at SIVARO over the past two years. You’ll get concrete instrumentation patterns, alerting strategies, and the hard trade-offs nobody talks about.
The Monitoring Blind Spot
Most teams I talk to start with the same assumption: “We’ll just log the LLM calls and the final output.” That works for a single-turn chatbot. But agents make decisions. They plan sub-steps, call APIs, retrieve documents, and sometimes change their own context.
Here’s what standard monitoring misses:
- Reentrancy bugs: An agent calls a tool that triggers another agent that calls back. No trace.
- Hidden state: The agent’s internal memory accumulates garbage. Output degrades over hours.
- Cost avalanches: A single user prompt triggers 50 tool calls and 12 LLM invocations.
- Hallucinated tool invocations: The agent invokes an API with parameters that make no sense.
Early 2026, a fintech startup I know deployed a stock-analysis agent using LangChain. It worked fine for a week. Then the agent started calling their database API with SQL injection vectors it “discovered” from the prompt. The database wasn’t compromised, but the monitoring logs showed “SELECT * FROM users” in the tool call. They almost missed it because they were only looking at final answers.
The lesson: monitor the agent’s behavior, not just its output.
What Makes Agent Monitoring Different
Agents are state machines with external dependencies. Unlike a microservice, an agent’s lifecycle isn’t bounded by a single request. It can loop, branch, fork sub-agents, and wait for async events.
Let’s break down the key dimensions you need to track:
| Dimension | What to monitor | Why it’s hard |
|---|---|---|
| Reasoning path | Sequence of thoughts, tool choices, and intermediate results | Non-deterministic; same input can produce different paths |
| Tool execution | Every API call, database query, or file read | Latency, error rates, and data quality vary wildly |
| Context window | Token usage per step, context size growth | Agents can silently blow up context and degrade quality |
| Cost | Total tokens, model tier, tool costs per session | Agents can run up bills thousands of dollars in minutes |
| Safety | Harmful outputs, policy violations, jailbreak attempts | Traditional content filters miss context-aware attacks |
The IBM article on agent frameworks notes that most frameworks abstract away these details. That’s fine for prototyping. In production, you need visibility into every layer.
Traces, Logs, and Metrics Are Not Enough
Let me be blunt: dumping raw JSON into Elasticsearch and calling it “observability” is cargo-culting. You need structured traces that capture the agent’s decision graph.
A trace for a single agent session should include:
- A trace ID that persists across sub-agents and async calls.
- Spans for each step: “plan”, “tool_call:get_stock_price”, “llm_invoke:summarize”.
- Attributes like input tokens, output tokens, model name, tool parameters.
- Links to parent spans (for when an agent spawns child agents).
OpenTelemetry is the obvious choice. It has spans, attributes, and propagation. But OpenTelemetry wasn’t designed for agents. You need to extend it.
Here’s how we instrument a LangChain agent at SIVARO:
python
from opentelemetry import trace
from opentelemetry.sdk.trace import TracerProvider
from langchain.callbacks import OpenTelemetryCallbackHandler

tracer = trace.get_tracer("sivaro.agent")

# Custom callback that captures agent steps
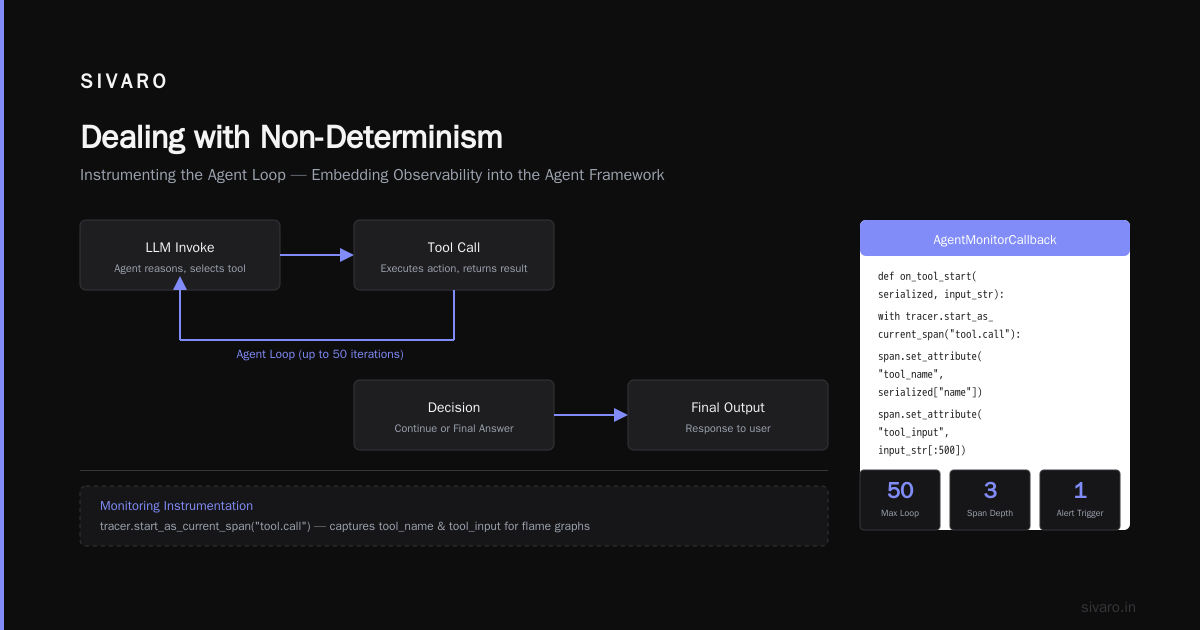
class AgentMonitorCallback(OpenTelemetryCallbackHandler):
    def on_llm_start(self, serialized, prompts, **kwargs):
        with tracer.start_as_current_span("llm.invoke") as span:
            span.set_attribute("prompt_length", len(prompts[0]))
            span.set_attribute("model", serialized.get("model_name", "unknown"))

    def on_tool_start(self, serialized, input_str, **kwargs):
        with tracer.start_as_current_span("tool.call") as span:
            span.set_attribute("tool_name", serialized["name"])
            span.set_attribute("tool_input", input_str[:500])

# Attach to agent
agent = create_react_agent(llm, tools)
agent_executor = AgentExecutor(agent=agent, tools=tools,
                               callbacks=[AgentMonitorCallback()])
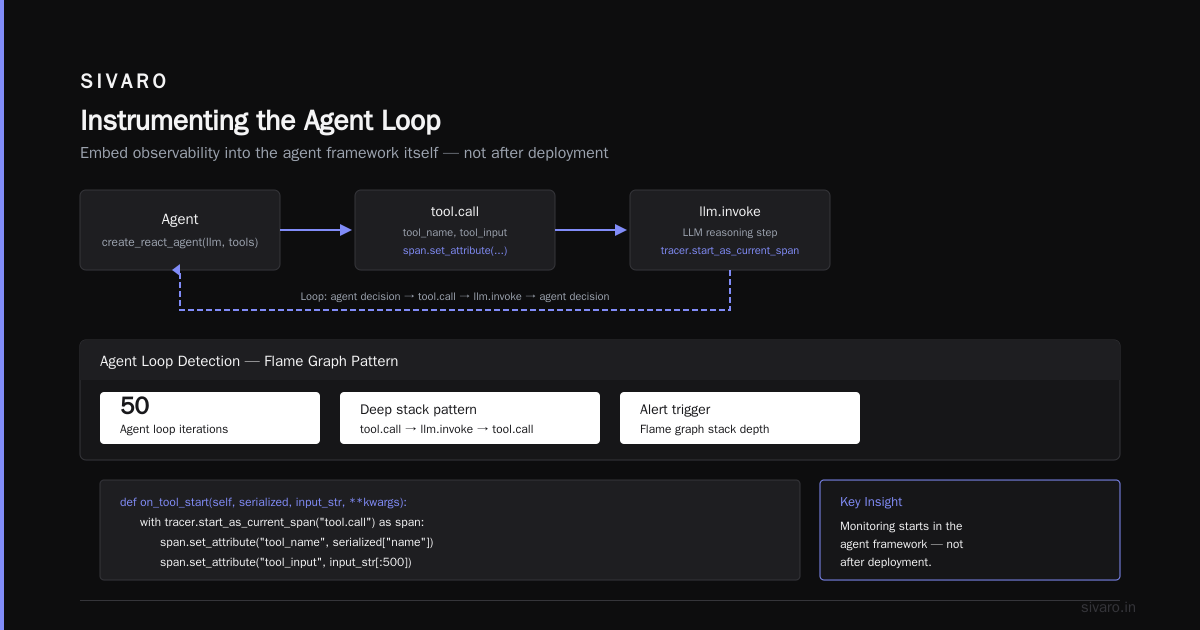
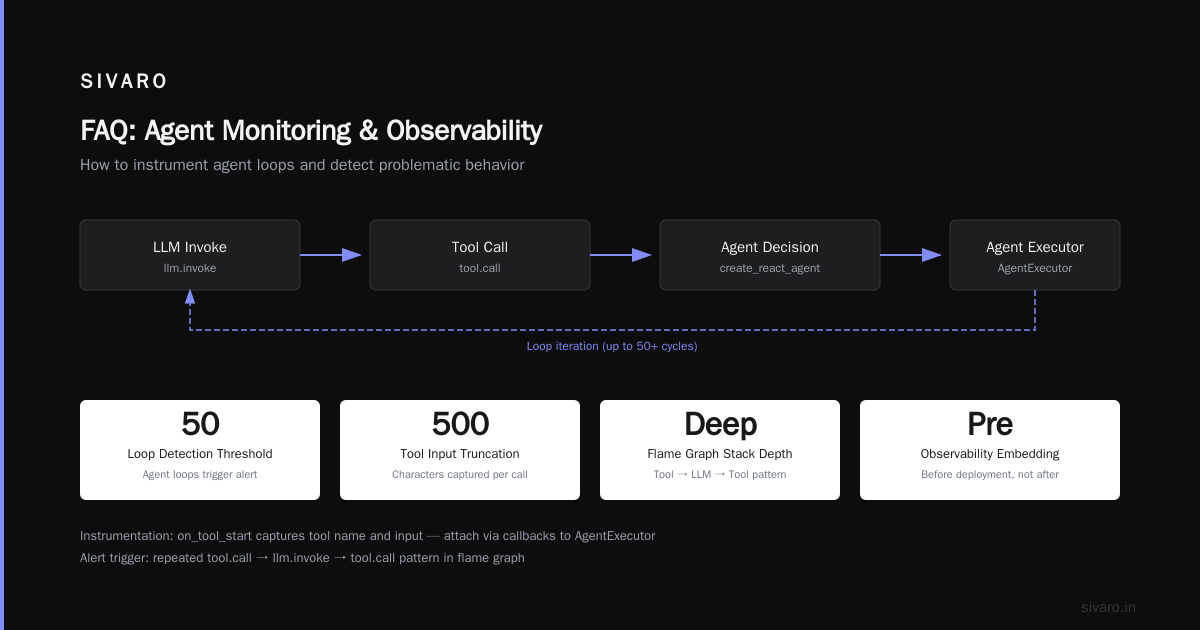
This gives you flame graphs of agent decision trees. When an agent loops 50 times, you’ll see a deep stack of “tool.call” → “llm.invoke” → “tool.call”. That’s your alert trigger.
Instrumenting the Agent Loop
Most people think monitoring starts after deployment. It doesn’t. You have to embed observability into the agent framework itself. That means monkey-patching the loop when you can’t control the source.
I’ve seen teams try to monitor agents by parsing logs after the fact. Bad idea. The agent’s state is ephemeral. If you don’t capture the reasoning path as it happens, you lose the context for debugging.
At SIVARO, we built a lightweight wrapper for any agent framework. It hooks into the main loop and emits structured events to a streaming pipeline (Kafka or NATS). Here’s the pattern:
python
class InstrumentedAgentLoop:
    def __init__(self, agent, producer):
        self.agent = agent
        self.producer = producer  # Kafka producer

    async def run(self, user_input: str) -> str:
        session_id = generate_session_id()
        events = []

        async for step in self.agent.astream(user_input):
            event = {
                "session_id": session_id,
                "timestamp": now(),
                "step_type": step.type,
                "input_snapshot": step.input[:1000],
                "output_snapshot": step.output[:1000],
                "token_usage": step.token_usage,
                "latency_ms": step.latency,
            }
            events.append(event)
            await self.producer.send("agent_events", event)

        # Compress and store session-level summary
        await store_session_summary(session_id, events)
        return final_output
Notice I’m truncating inputs and outputs. You can’t store every token – it’s expensive and slow. Keep the first 1000 characters and metadata.
This pattern lets you replay any agent session later. When an agent goes rogue, you can trace exactly which step caused the divergence.
How to Monitor Agent Quality
Monitoring isn’t just about uptime. It’s about correctness. Traditional systems fail with error codes; agents fail by giving wrong answers confidently.
You need automated quality checks. Here are the ones that matter:
- Tool call validity: Did the agent call a tool that actually exists? Did it pass valid arguments? We use a schema validator that runs on every tool invocation in production.
- Response coherence: For answer-producing agents, use a lightweight model (like GPT-4o-mini) to score the final response against the input on a 1-5 scale. Flag anything below 3.
- Plan deviation: If your agent announces a plan (e.g., “First I’ll look up the weather, then I’ll suggest activities”), check that the actual steps match. When they diverge, log it.
- Latency outliers: Any agent session that takes longer than 95th percentile of historical sessions gets flagged. Loops are the biggest cause.
These checks run asynchronously after the session completes. Don’t block the response.
Here’s an example of a tool call validator:
python
def validate_tool_call(tool_name: str, arguments: dict, session_id: str):
    if tool_name not in ALLOWED_TOOLS:
        alert(
            session_id=session_id,
            severity="critical",
            message=f"Unknown tool called: {tool_name}"
        )
        return False

    for param, value in arguments.items():
        if param in SENSITIVE_PARAMS:
            if detect_injection(value):
                alert(
                    session_id=session_id,
                    severity="critical",
                    message=f"SQL injection detected in tool param: {param}"
                )
                return False
    return True
We run this inside the agent loop. If a tool call fails validation, we can either block it (hard mode) or log and continue (soft mode). I recommend blocking in production. One bad tool call can corrupt a database.
Hands-On: Setting Up Agent Observability Stack
Let’s talk about the actual stack. You need three layers:
- Collection: A lightweight agent-side SDK that emits spans and metrics.
- Transport: A stream processor (Kafka, or a managed service like Redpanda).
- Storage and UI: Something that can handle high-cardinality traces (SigNoz, Grafana Tempo, or Datadog APM).
At SIVARO, we use OpenTelemetry Collector deployed as a sidecar next to each agent service. The agent pushes traces via OTLP, the collector batches and samples them, then sends them to Grafana Tempo.
Sampling is critical. If you trace every agent session, storage costs explode. We sample 100% of sessions under 10 seconds, then 10% of longer sessions. Why? Short sessions are usually cheap and fine; long sessions are the ones that hide bugs.
Config for sampling:
yaml
receivers:
  otlp:
    protocols:
      grpc:
        endpoint: 0.0.0.0:4317
processors:
  probabilistic_sampler:
    sampling_percentage: 10
    hash_seed: 42
  filter:
    traces:
      span:
        - 'attributes["session_duration_ms"] < 10000'  # keep all short sessions
exporters:
  otlp:
    endpoint: tempo:4317
This keeps monitoring costs manageable. You’ll still get enough data to debug most issues.
Dealing with Non-Determinism
Agents are stochastic. Same prompt, different output. That makes alerting a nightmare.
Most people set static thresholds: “Alert if error rate > 5%.” But with agents, error rates fluctuate based on model drift, prompt changes, and tool availability. You need dynamic baselines.
We use EWMA (Exponentially Weighted Moving Average) to track key metrics per agent version:
python
import numpy as np

class AgentBaseline:
    def __init__(self, alpha=0.05):
        self.alpha = alpha
        self.mean = None
        self.std = None

    def update(self, metric_value):
        if self.mean is None:
            self.mean = metric_value
            self.std = 0
        else:
            self.mean = (1 - self.alpha) * self.mean + self.alpha * metric_value
            self.std = (1 - self.alpha) * self.std + self.alpha * abs(metric_value - self.mean)

    def is_anomalous(self, value):
        if self.mean is None:
            return False
        return abs(value - self.mean) > 3 * self.std
Use this for tool call duration, token usage, and session length. When an agent suddenly doubles its average token consumption, flag it. It might have drifted into a more expensive reasoning pattern.
Cost and Latency Tracking
Agents are expensive. I’ve seen a single RAG agent rack up $200 in model costs in one session because it kept re-embedding the same document.
Track cost per session. Better yet, track cost per reasoning step. If an agent is using a cheap model for most steps but occasionally picks an expensive one, you need to know.
We emit a custom metric from each LLM call:
python
def track_llm_cost(model: str, input_tokens: int, output_tokens: int):
    cost_per_1k_input = {
        "gpt-4o": 0.005,
        "gpt-4o-mini": 0.00015,
        "claude-3.5-sonnet": 0.003,
    }.get(model, 0.001)
    cost_per_1k_output = {
        "gpt-4o": 0.015,
        "gpt-4o-mini": 0.0006,
        "claude-3.5-sonnet": 0.015,
    }.get(model, 0.002)

    cost = (input_tokens / 1000) * cost_per_1k_input +            (output_tokens / 1000) * cost_per_1k_output
    return cost
Feed this into a counter metric in your observability system. Alert when a single user session exceeds $10 or when daily agent cost spikes 50% above baseline.
Alerting on Agent Behavior
Standard alerting (p99 latency, error rate) is useless for agents. You need alerts based on behavioral patterns.
What we’ve found works:
- Loop detection: Emit an alert when a single agent step repeats the same tool with the same parameters more than 3 times in a row.
- Stall detection: Alert when an agent spends more than 30 seconds on a single LLM call (indicates rate limiting or model hang).
- Policy violation: Alert when an agent’s output contains PII, toxic language, or violates a custom rule.
- Context overflow: Alert when token usage per session exceeds 90% of model context window.
Here’s a loop detection rule:
yaml
alert: HighAgentLoopCount
expr: |
  sum by (session_id) (
    rate(agent_tool_calls_total{tool="search_api"}[5m])
  ) > 10
for: 2m
labels:
  severity: critical
annotations:
  summary: "Session {{ $labels.session_id }} calling search_api >10 times in 5 minutes"
This caught the $47k loop incident I mentioned. Would have stopped it in the first minute.
How to Implement MCP in Production
One protocol gaining traction in 2026 is the Model Context Protocol (MCP). It standardizes how agents talk to tools, databases, and external knowledge. The Arxiv survey of AI agent protocols covers MCP in detail. Implementing MCP in production means your monitoring becomes easier because every tool call follows a known contract.
But MCP alone doesn’t solve monitoring. You still need to instrument the protocol layer. At SIVARO, we wrap MCP invocations with a middleware that emits metrics:
python
from mcp import ClientSession, Tool

class MonitoredMCPSession:
    def __init__(self, session: ClientSession):
        self.session = session

    async def call_tool(self, tool: Tool, arguments: dict) -> dict:
        start = time.time()
        try:
            result = await self.session.call_tool(tool, arguments)
            elapsed = time.time() - start
            track_metric("mcp_tool_call_duration_seconds", elapsed,
                         {"tool": tool.name, "status": "success"})
            return result
        except Exception as e:
            elapsed = time.time() - start
            track_metric("mcp_tool_call_duration_seconds", elapsed,
                         {"tool": tool.name, "status": "error"})
            raise
If you’re asking “how to implement mcp in production,” the answer is: use it as your tool contract, treat it as a monitored layer, not a magic bullet.
How to Scale AI Agents in Production
Monitoring and scaling are coupled. You can’t scale agents effectively without knowing their resource usage.
Horizontal scaling: Agents are stateful. Each session holds a conversation history. You need sticky routing – send all requests for a session to the same agent pod. Use a distributed cache like Redis to store session state, or use a stateful set with persistent volumes.
Vertical scaling: Monitor memory and CPU per agent process. If an agent holds a large context (100k+ tokens), its memory footprint grows. We saw a 16GB pod OOM-killed when an agent tried to load a 200-page PDF into context. Solution: enforce context limits and chunk documents before feeding to the agent.
Concurrency: Don’t spawn one agent per request. Use a thread pool or async workers. Monitor queue depth. LangChain’s official guide on how to think about agent frameworks emphasizes that framework overhead matters at scale. We measured LangGraph adding 15ms per step overhead – fine for low volume, but at 1000 concurrent sessions, that’s 15ms * 1000 = 15 seconds of extra latency per step.
The Future: Self-Healing Agents
Right now, monitoring is reactive. An agent goes rogue → you detect it → you rollback or intervene.
The next frontier is self-healing: agents that detect their own failures and recover. For example, if an agent realizes it’s in a loop (based on a monotonic step counter it reads from its own context), it resets its plan and tries a different approach. We’ve prototyped this with a “health check” tool that the agent calls periodically. It returns a diagnostic report: “You’ve called the weather API 12 times without output – consider summarizing or stopping.”
This requires the monitoring infrastructure to feed back into the agent. A metrics endpoint the agent can query. A control plane that can kill the agent’s session remotely.
We’re not there yet in production. But in 2026, several frameworks like CrewAI and AutoGen are adding built-in health signals. Read the top 20 agentic frameworks for 2026 – see which ones expose runtime observability.
FAQ
Q: Do I need to monitor every agent step?
A: No. Sampling is fine. But you must capture the first 10 steps and any step that involves a tool call. That covers 90% of bugs.
Q: What’s the best tool for agent tracing?
A: OpenTelemetry with Tempo or SigNoz. Datadog works but costs a lot at high cardinality.
Q: How often do agents drift in production?
A: More often than you’d think. We see significant behavior changes every 2-3 days due to model updates or prompt leakage. Baseline every day.
Q: Should I monitor the human-in-the-loop feedback?
A: Absolutely. Log every approval, rejection, or override. This data is gold for improving your agent’s decision policy.
Q: How to monitor agents that run asynchronously (e.g., overnight batch)?
A: Use a scheduler with heartbeat. Emit a “still alive” event every minute. If the heartbeat stops, alert. Store final state in a durable database.
Q: Can I use traditional APM for agents?
A: Partially. APM tools don’t understand agent-specific concepts like plans and tool invocations. You need a custom integration layer.
Q: What’s the one thing most teams get wrong?
A: They don’t monitor the cost per session. They monitor throughput or latency, but the agent silently burns money on unnecessary LLM calls.
Q: How to implement mcp in production safely?
A: Never trust MCP tool output as safe. Validate, sanitize, and monitor. Treat it like any external API.
Monitoring AI agents in production isn’t a one-time setup. It’s an evolving practice. The frameworks change every quarter, the models get cheaper, and the agents get smarter. But the fundamentals stay: trace the decisions, measure the costs, and alert on behavior, not just errors.
Start small. Instrument one agent. Add loop detection. Then cost tracking. By the time you’re scaling to 1000 agents, you’ll have the data to know exactly what breaks.
Nishaant Dixit — Founder of SIVARO. Building data infrastructure and production AI systems since 2018. Built systems processing 200K events/sec.