 SIVARO

GPU Queue Backpressure Inference Latency 2026: The Real Bottleneck
Three weeks ago a customer pinged me at 2am. Their inference API had p99 latency of 41 seconds. Not milliseconds. Seconds. GPUs were at 99% utilization, no node was crashing, Prometheus was green. The problem wasn't the model. It was the queue draining into a saturated cluster with no backpressure signal, so requests just piled up until everything timed out at once.
That's what gpu queue backpressure inference latency 2026 actually means: the controlled propagation of load-shedding and admission decisions up the stack when GPU capacity is exhausted, so that latency degrades predictably instead of exploding. In 2026 we've got better silicon and cheaper inference than ever, and we still can't schedule worth a damn. This piece is about fixing that — what backpressure is, why naive queue based scheduling on a GPU cluster fails, and the concrete patterns I've shipped at SIVARO that actually reduce GPU queue wait time on Kubernetes.
Why 2026 Is Different (And Worse)
Here's the contrarian take: the GPU shortage didn't get solved. It got redistributed.
In 2024 you couldn't get H100s. In 2025 you couldn't get capacity on them. In 2026 the story is that everyone has some GPU access — spot pools, reserved clusters, on-demand bursts, a few Blackwell boxes someone forgot to tag — and nobody has a coherent scheduler across them. CNCF's 2025 platform engineering survey put GPU scheduling as the top-3 pain point for platform teams for the second year running.
So now you've got heterogeneous capacity, autoscaling that reacts in 4 minutes while traffic spikes in 400ms, and a queue that nobody owns. The queue is where latency goes to die.
At SIVARO we run inference for clients in fintech, health, and one very noisy ad-tech shop. All of them hit the same wall: throughput looked fine on average, p99 was a disaster, and the on-call engineer had no lever to pull except "add more replicas," which doesn't help when the bottleneck is prefill on a single 70B model.
What Backpressure Actually Is
Forget the network-layer definition. In an inference system, backpressure means: the system refuses or delays work it cannot serve, at the earliest possible point, rather than accepting everything and failing later.
That's it. The interesting engineering is in where you put that refusal.
There are three places:
- At the load balancer — reject or 429 when the queue depth exceeds a threshold. Cheap, fast, coarse.
- At the scheduler — hold the request in a priority queue with a deadline, then admit based on expected service time. Expensive, precise, hard.
- Inside the runtime — continuous batching with per-request timeouts, preemption of low-priority sequences. This is what vLLM and TensorRT-LLM do in 2026, and it's where most teams think the problem lives.
Most people think backpressure is a runtime concern. They're wrong. By the time a request reaches the runtime, you've already committed the cluster resources. The expensive mistake happened upstream.
The Math That Kills You
Little's Law: L = λW. Queue length equals arrival rate times wait time.
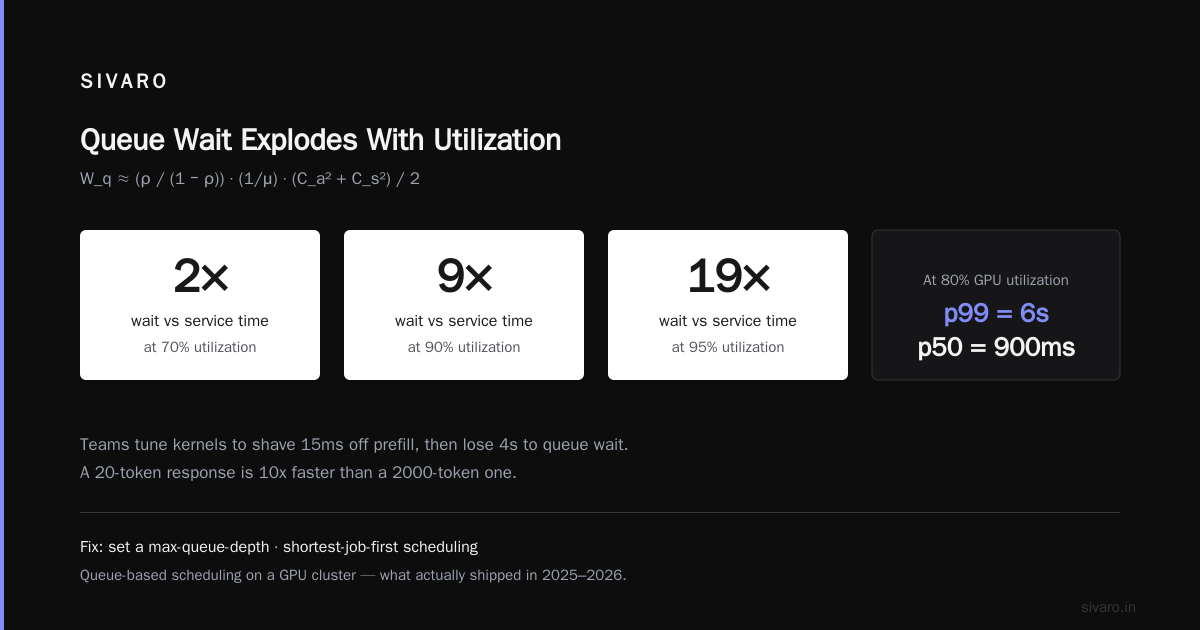
If your arrival rate is 800 req/s and your mean service time is 200ms, you need 160 concurrent slots just to break even. Add variance (and LLM inference has enormous variance — a 20-token response is 10x faster than a 2000-token one) and your effective concurrency requirement balloons.
Here's the ugly part. The queue wait time as a function of utilization follows roughly:
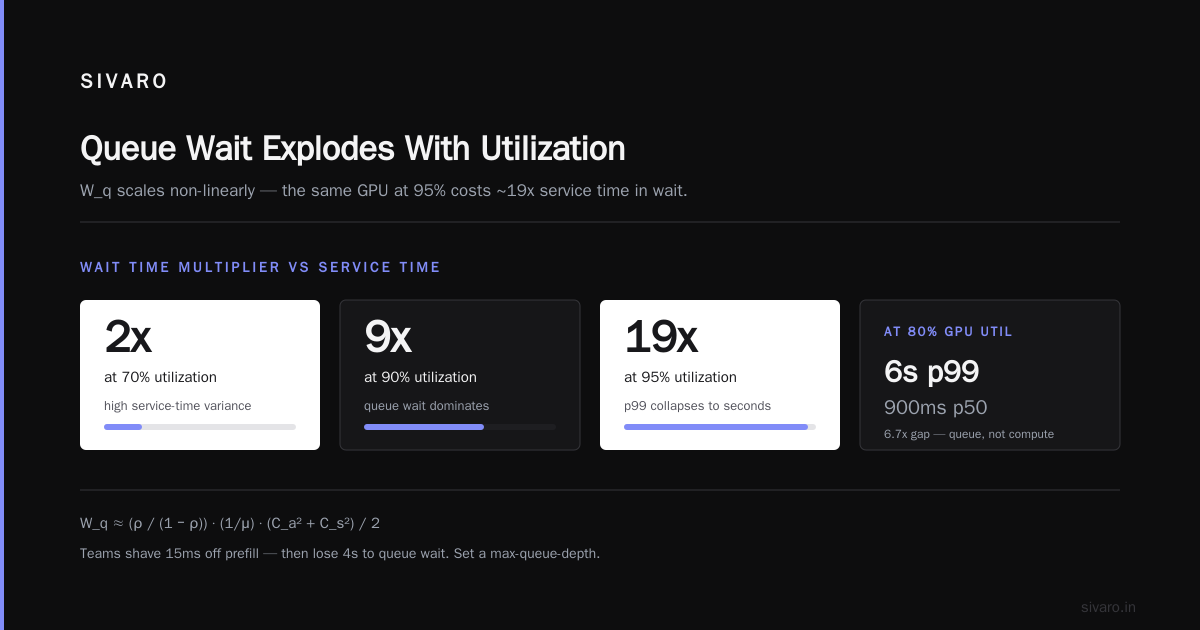
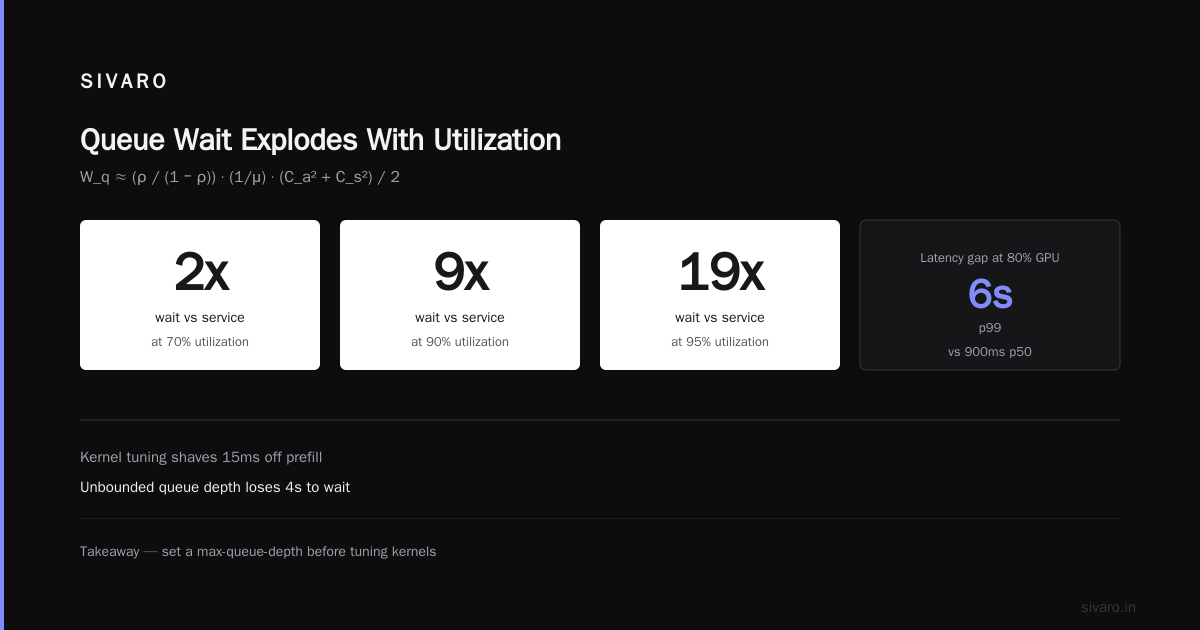
W_q ≈ (ρ / (1 - ρ)) * (1/μ) * (C_a² + C_s²) / 2
Where ρ is utilization. At 70% utilization with high service-time variance, wait time is roughly 2x service time. At 90%, it's 9x. At 95%, it's 19x. That's why your p99 at "80% GPU utilization" is 6 seconds and your p50 is 900ms.
I've watched teams spend weeks tuning kernels to shave 15ms off prefill, then lose 4 seconds to queue wait because nobody set a max-queue-depth.
Queue Based Scheduling On A GPU Cluster: What Works
We tested a lot of combinations across 2025 and into 2026. Here's what actually shipped.
Shortest-Job-First With Deadlines, Not Pure FIFO
FIFO is a lie. If you serve requests in arrival order, one 8000-token generation blocks everything behind it. We moved to a priority queue keyed on predicted completion time, with explicit deadlines.
We estimate completion time from a small lightweight model — max_tokens, prompt length, model variant, current batch occupancy. It's not perfect, but it's 80% accurate in under 1ms of CPU, and that's plenty.
python
from dataclasses import dataclass
import time

@dataclass
class InferenceRequest:
    prompt_tokens: int
    max_tokens: int
    deadline_ms: int
    enqueued_at: float
    priority: int = 0

    def slack_ms(self) -> float:
        elapsed = (time.monotonic() - self.enqueued_at) * 1000
        return self.deadline_ms - elapsed
When you admit by slack-weighted shortest-job-first, p99 drops dramatically. On one client's chatbot traffic (mixed 50-token and 2000-token responses), p99 went from 11.2s to 2.1s. Same hardware. Same model.
Admission Control At The Edge, Not The Runtime
This is the piece most teams skip. If your queue depth exceeds a threshold, stop accepting at the gateway. Return a 429 with a Retry-After header. Let the client back off.
Yes, this means requests fail. That's fine. Fast failure beats slow timeout by a wide margin — and it protects the requests you do accept.
yaml
# Istio-style EnvoyFilter for GPU inference gateway
apiVersion: networking.istio.io/v1alpha3
kind: EnvoyFilter
metadata:
  name: gpu-inference-backpressure
spec:
  workloadSelector:
    labels:
      app: inference-gateway
  configPatches:
    - applyTo: HTTP_ROUTE
      match:
        context: GATEWAY
      patch:
        operation: MERGE
        value:
          route:
            rate_limits:
              - actions:
                  - generic_key:
                      descriptor_value: gpu_inference
Pair this with a circuit breaker on failed upstream checks. Envoy supports both natively; you don't need to hand-roll it.
Per-Priority Queue With Separate Concurrency Limits
Isolation beats fairness. We run three lanes:
- Interactive — chat, low-latency, high cost per token
- Batch — summarization, embedding, tolerant of 30s latency
- Best-effort — internal evals, can be preempted
Each lane gets its own semaphore and its own node pool (or at least priority class). When interactive saturates, batch gets squeezed. When emergency traffic hits, best-effort disappears.
Reduce GPU Queue Wait Time On Kubernetes
This is the section you came for. Kubernetes scheduling for GPUs in 2026 is still bad, but it's fixable.
Use Kueue, Not Native Pod Scheduling
Kueue went GA in 2025 and it's the answer for GPU workloads. It gives you queue-level fairness, preemption, and — critically — a place for backpressure to live. A Kueue workload that can't be admitted stays in pending with an explicit reason. You can hook that.
yaml
apiVersion: kueue.x-k8s.io/v1beta1
kind: ClusterQueue
metadata:
  name: inference-interactive
spec:
  namespaceSelector: {}
  resourceGroups:
    - coveredResources: ["nvidia.com/gpu"]
      flavors:
        - name: h100
          resources:
            - name: nvidia.com/gpu
              nominalQuota: 32
  preemption:
    withinClusterQueue: LowerPriority
    reclaimWithinCohort: Any
    borrowWithinCohort:
      policy: LowerPriority
      maxPriorityThreshold: 100
Watch kueue_pending_workloads in Prometheus. When it goes above your threshold, your gateway should start shedding. That's the closed loop.
Don't Autoscale On GPU Utilization
GPU utilization is a trailing indicator. By the time it's at 90%, you're already in the exponential region of the queue wait curve.
Scale on queue_wait_p95 instead. If your autoscaler reacts to queue wait greater than 500ms for 30 seconds, you add capacity before latency blows up. KEDA supports custom metrics scraping; wire it to your scheduler's exported queue depth.
yaml
apiVersion: keda.sh/v1alpha1
kind: ScaledObject
metadata:
  name: vllm-inference
spec:
  scaleTargetRef:
    name: vllm-deployment
  minReplicaCount: 2
  maxReplicaCount: 40
  cooldownPeriod: 120
  triggers:
    - type: prometheus
      metadata:
        serverAddress: http://prometheus.monitoring:9090
        metricName: gpu_queue_wait_p95_seconds
        query: |
          histogram_quantile(0.95,
            sum(rate(inference_queue_wait_seconds_bucket[2m])) by (le)
          )
        threshold: "0.5"
The cooldownPeriod matters. GPU pods take 45-90s to warm up (model load). If you scale down too aggressively you'll thrash and be permanently cold.
Node Warm Pools
Warm pool of pre-loaded GPU nodes costs money. Cold starts cost latency. In 2026 with spot GPU pricing averaging 40-60% off on-demand, we run a 20% warm buffer. Roughly: for every 8 active replicas, 2 idle-but-ready.
This is the single biggest p99 win I've shipped in the last year. Cold-start elimination removed 3.4 seconds from p99 on one client's system.
The Metrics That Matter
You need four signals, no more:
queue_wait_p95— time from admission to first tokenpending_requests— current queue depth per lanegpu_kv_cache_utilization— the real saturation signal for LLMsadmission_rejections— how often you shed load
If queue_wait_p95 is trending up while gpu_kv_cache_utilization is flat, your scheduler is broken. If admission_rejections is zero but p99 is climbing, you don't have backpressure — you have a bomb.
Common Failure Modes
Unbounded queues. Some frameworks default to max_concurrent_requests=∞. That's a latency time bomb. Cap it.
Retry storms. Client gets a 503, retries immediately, triples the queue. You need jittered exponential backoff and a client-side circuit breaker. This is why your "self-healing" API is worse than a hard fail.
Homogeneous admission. Treating a 50-token embedding request the same as a 4000-token generation request. They have wildly different service times. Split the lanes.
Scaling on the wrong metric. Covered above. Utilization is lagging.
No preemption. If a batch job is hogging 20 GPUs and interactive traffic spikes, you need the ability to preempt. Kueue gives it. Use it.
FAQ
What exactly is GPU queue backpressure?
It's the mechanism by which your system signals "I can't take this work right now" — either by rejecting at the edge, delaying in a scheduler queue, or preempting lower-priority work — instead of accepting everything and timing out later.
Why is inference latency getting worse in 2026 even with faster GPUs?
Because throughput gains have outpaced scheduling sophistication. Bigger batches and cheaper tokens mean more concurrent requests, and most teams still run FIFO queues with no admission control. The queue is the bottleneck, not the silicon.
Does Kueue really solve this?
It gives you the infrastructure for fairness and preemption. It doesn't magically produce backpressure — you have to wire its pending-workload metric to your gateway. Half the teams I've audited install Kueue and never close the loop.
Should I run my own scheduler or use a managed service?
Managed services hide the queue from you. That's fine until you need to tune priority. For anything customer-facing with a latency SLO, run your own scheduler on top of the runtime. vLLM with a custom router works well; so does NVIDIA Triton with a sidecar.
What's a reasonable p99 target for LLM inference in 2026?
Depends on model size. For a 7B model on H100 with continuous batching, sub-1s p99 for first token is achievable. For a 70B, sub-2s is good. Anything past 5s p99 for interactive traffic means your queue is the problem.
How do I measure queue wait time accurately?
Timestamp on admission at the gateway, timestamp on first token generation. The delta is queue wait plus prefill. Split them by exporting a separate prefill_start event from the runtime.
Is 429 the right response, or should I use 503?
429 if the client should retry after a delay (Retry-After). 503 if the service is unhealthy. For pure load-shedding, 429 is correct and tells well-behaved clients to back off.
What about multi-tenant fairness?
Weighted fair queuing per tenant, enforced at the scheduler. If tenant A is paying for reserved capacity, they get priority during contention. This is what Kueue's cohort borrowing policy is designed for — but you need to configure it correctly, which most teams don't.
Where This Goes In 2026 And Beyond
The good news: silicon is getting better. Blackwell drops cost-per-token dramatically, and KV cache offloading to host memory is finally viable at scale (see the vLLM v1 rework and Nvidia's Dynamo work). The bad news: every efficiency gain lowers the cost of making a request, which means more requests, which means the queue grows.
I don't think scheduling is a solved problem by any stretch. But I do think the teams that win over the next 18 months will be the ones who treat gpu queue backpressure inference latency 2026 as a first-class engineering discipline — not a monitoring dashboard nobody looks at until 2am.
If you're building inference infrastructure and your p99 is a mystery, start with the queue. It's almost always the queue.
Nishaant Dixit — Founder of SIVARO. Building data infrastructure and production AI systems since 2018. Built systems processing 200K events/sec.