 SIVARO

GPU Inference Autoscaling Pitfalls Admission Control
If you're running LLM inference on Kubernetes and your p99 latency looks like a seismograph during a small earthquake, autoscaling isn't your problem. Admission control is.
I've watched this play out at a dozen companies now. In March 2026, a fintech client in Bangalore had HPA cranked to 40 GPU replicas on their Llama-3.3-70B cluster. Traffic doubled. Latency tripled. They blamed the model, then the scheduler, then NVIDIA. The actual culprit: the autoscaler was reacting to a metric, and no component was deciding whether to accept the request in the first place. Their admission layer was a passthrough. It should have been a bouncer.
Here's the thing though — and this is the part most GPU autoscaling content skips — you can't understand admission control without understanding the GPU inference autoscaling pitfalls admission control is designed to prevent. Because every pitfall in autoscaling is really a failure of admission: the system accepts work it can't complete, scales into a state it can't recover from, or measures the wrong thing while a queue quietly metastasizes in front of it.
This piece covers what queue-theoretic admission control in GPU clusters actually is, why naive autoscaling breaks under LLM workloads, and how to wire the two together so your cluster survives a traffic spike without burning through your GPU budget. I'll show you the code I actually use.
Why autoscaling GPU inference is a different animal
Autoscaling a stateless web service is a solved problem. CPU is fungible, request cost is roughly uniform, scale-up takes 30 seconds, and the HPA metric (CPU utilization or RPS per pod) is a decent proxy for saturation.
GPU inference breaks every one of those assumptions.
A single LLM request's cost isn't uniform. A 20-token prompt with a 30-token completion is maybe 50ms of compute. The same endpoint taking a 4,000-token prompt with 2,000 tokens of output can occupy a GPU for 30+ seconds. Same endpoint, same "request," 600x the cost. Your HPA sees RPS. RPS is a lie.
Scale-up is also glacial. On AKS with H100 nodes, node provisioning plus container image pull plus model weight load (a 70B model is ~140GB in BF16, more with KV cache headroom) takes anywhere from 4 to 12 minutes. Autoscaling decisions made on 30-second windows are useless against a 12-minute feedback loop. By the time your new replicas are warm, the traffic spike is over or your queue has already collapsed.
And then there's cold-start cost. Spinning up an H100 node isn't cheap. If your autoscaler flaps — scales to 10, back to 2, back to 10 — you're paying for capacity that spends most of its life loading weights it never uses.
Most teams discover this the hard way. They treat GPU inference like a web service, get burned, and then over-correct by just... running enough GPUs to handle peak. That's how you end up with 60% idle utilization and a CFO asking questions.
What queue-theoretic admission control in GPU clusters actually means
Let me define this without hand-waving.
Admission control is a decision made before work enters the system: accept, reject, or defer. In classical queue theory, you have an arrival process, a service process, and a buffer. When arrivals exceed service rate, the buffer grows, wait time grows, and eventually you hit a wall — some requests wait so long they're no longer useful (your client timed out at 30s, so the 45s-latency answer you eventually computed is garbage).
The math matters here. For an M/M/c queue with c servers, utilization ρ = λ / (cμ) where λ is arrival rate and μ is per-server service rate. As ρ → 1, wait time goes to infinity. This isn't a metaphor. It's Little's Law and the Pollaczek–Khinchine formula saying, unambiguously, that a system running at 95% utilization has wait times several times higher than one running at 70%.
Most GPU teams decide to run at 90%+ utilization because it looks efficient on a dashboard. Then they're shocked when p99 latency collapses. Queue theoretic admission control in GPU clusters means explicitly computing whether an incoming request can be served within its SLO given the current queue depth and service rate, and rejecting or shedding it when it can't.
The "queue theoretic" qualifier matters because there are two flavors of admission control:
The first is naive capacity admission — "we have N slots free, let it in." This is what most autoscalers implement, implicitly. The problem is that for variable-cost workloads, a slot isn't a slot. A slot occupied by a 4K-token generation is 100x more expensive than one occupied by a 50-token embedding.
The second flavor is deadline-aware admission. You compute the expected completion time of the incoming request given the current state, compare it to the client's deadline (or your SLO-derived deadline), and reject if it'll miss. This is what you actually want.
There's a real result from Google's 2024 SRE work on LLM serving (they published a paper on the "Sagamore" cluster scheduler) showing that simple deadline-aware admission reduced tail latency by ~60% on their internal endpoints, at the cost of ~4% rejected requests. That trade — drop 4% to save the other 96% — is almost always worth it.
The four autoscaling pitfalls admission control fixes
Here's where the two concepts collide. These are the concrete failure modes.
Autoscaling on the wrong signal
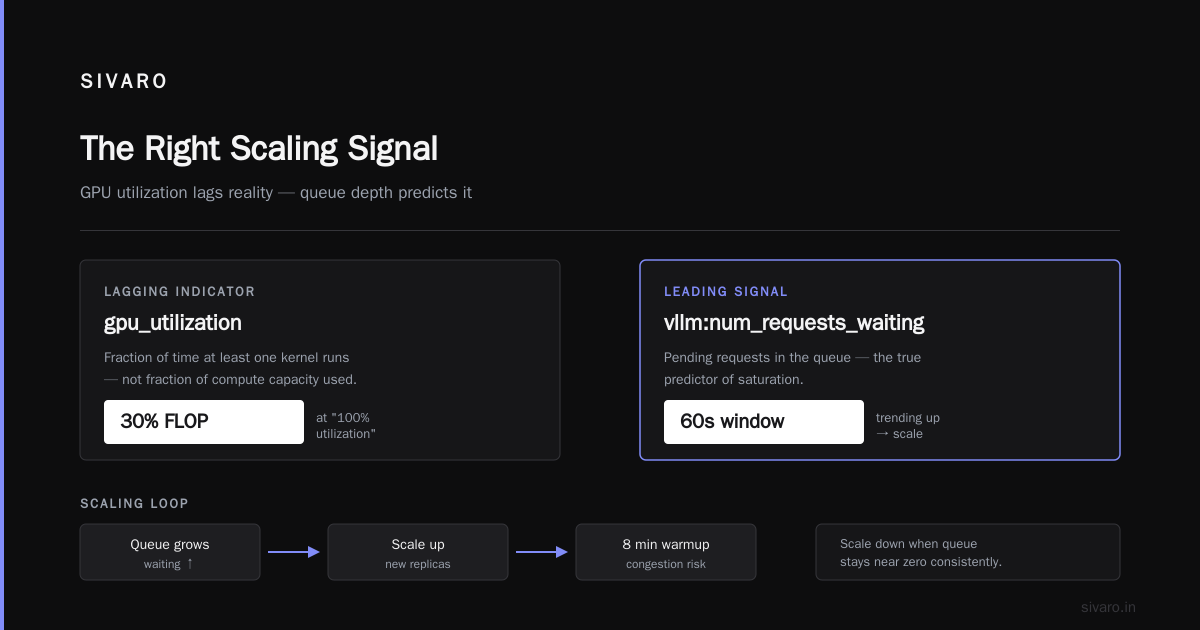
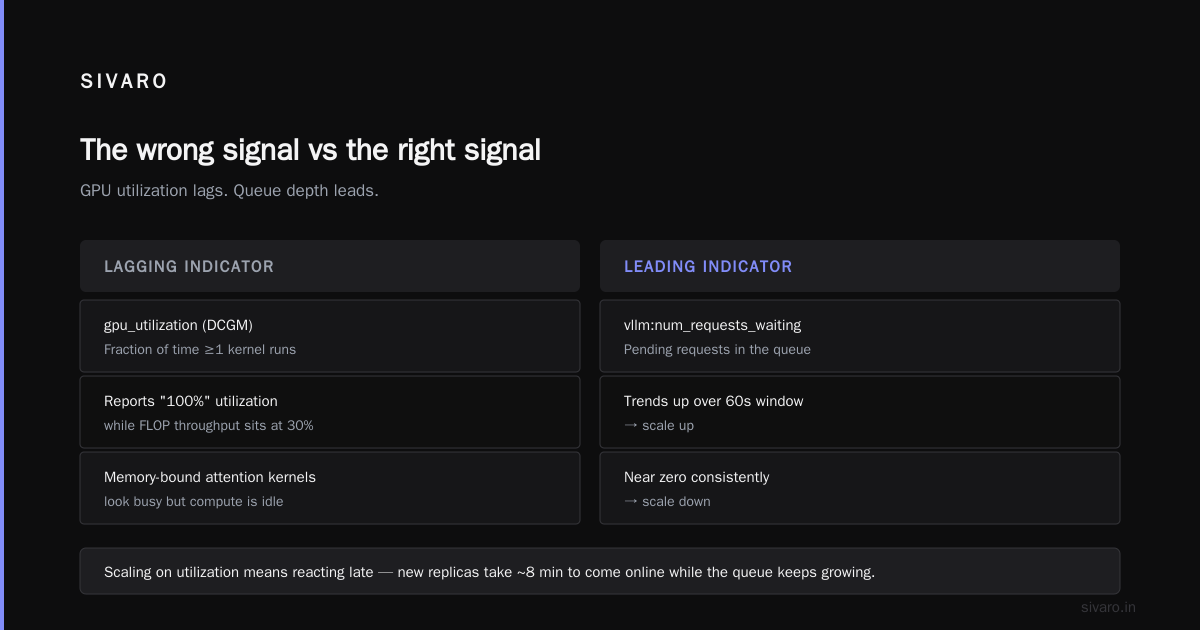
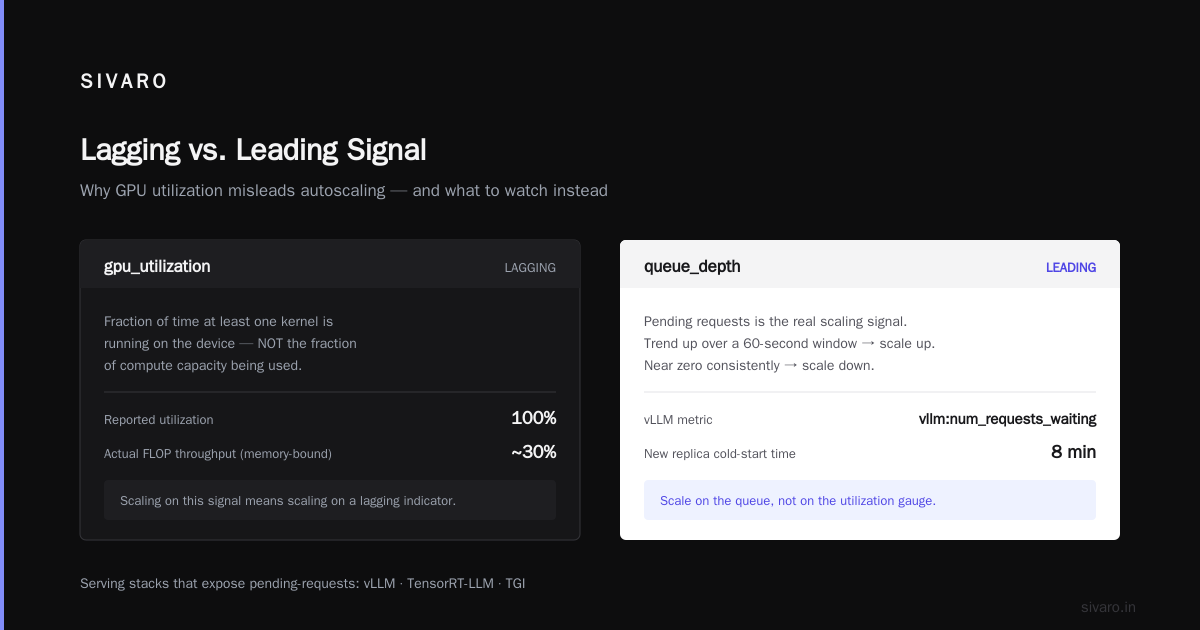
If you're scaling on CPU, GPU utilization, or even NVIDIA DCGM's gpu_utilization, you're scaling on a lagging indicator. GPU utilization in particular is a notoriously bad metric — it's the fraction of time at least one kernel is running on the device, not the fraction of compute capacity being used. A GPU at "100% utilization" might be running memory-bound attention kernels and be at 30% FLOP throughput.
What actually predicts trouble is queue depth. If your inference server (vLLM, TensorRT-LLM, TGI) has a pending-requests metric, that's your scaling signal. vLLM exposes vllm:num_requests_waiting. When that number trends up over a 60-second window, scale. When it's near zero consistently, scale down.
Scaling into congestion
Here's a subtle one. You scale up because the queue is growing. New replicas take 8 minutes to come online. In those 8 minutes, more requests pile in. Replica arrives, gets immediately saturated because the queue is now huge. Autoscaler sees the queue is still growing (because pre-replica backlog is being drained), scales again. Repeat until you've got 4x the GPUs you need, all of which will be idle in 20 minutes.
Admission control breaks this loop. If you're shedding the requests you can't serve, the queue doesn't grow unboundedly, and the autoscaler gets a cleaner signal.
Cold-start churn
Every GPU replica you spin up costs you ~$10–$30 in node time before it serves its first token. Flapping is expensive. Most teams handle flap with cooldown windows (HPA's scaleDownStabilizationWindowSeconds), but that's a band-aid. The real fix is to smooth the input — and admission control does that by rejecting burst traffic that temporarily makes the queue look scary.
Thundering herd from client retries
If you reject a request with a 429 and the client immediately retries (which many SDKs do by default), you get a retry storm that makes the original spike worse. Admission control has to be paired with retry-after headers and, ideally, cooperative clients. OpenAI's SDK honors 429 with Retry-After; make sure whatever you deploy does too.
Building an admission controller that actually helps
Let me show you what I mean with real code. This is a simplified version of the admission layer we run at SIVARO for a client's 40-GPU cluster.
Estimating the cost of an incoming request
First, you need a per-request cost estimate. For LLMs, tokens are the currency.
python
from dataclasses import dataclass
from transformers import AutoTokenizer

TOKENIZER = AutoTokenizer.from_pretrained("meta-llama/Llama-3.3-70B-Instruct")

@dataclass
class RequestCost:
    prompt_tokens: int
    max_output_tokens: int
    estimated_ms: float

# Empirically measured on H100, Llama-3.3-70B, TP=4, batch=16
PREFILL_MS_PER_TOKEN = 0.9
DECODE_MS_PER_TOKEN = 18.0

def estimate_cost(prompt: str, max_tokens: int = 512) -> RequestCost:
    toks = len(TOKENIZER.encode(prompt))
    # Prefill is parallel-ish, decode is serial per sequence
    est = (toks * PREFILL_MS_PER_TOKEN) + (max_tokens * DECODE_MS_PER_TOKEN)
    return RequestCost(prompt_tokens=toks, max_output_tokens=max_tokens, estimated_ms=est)
The constants come from real benchmarking. Don't trust them blindly — measure on your hardware with your model. But the shape is right: prefill scale roughly linearly with prompt tokens and decode scales linearly with output tokens, with completely different coefficients.
The admission decision itself
Now the admission rule. It's short. That's a feature.
python
import time

SLO_P95_MS = 2000  # our target for this endpoint

class AdmissionController:
    def __init__(self, slo_ms: float, safety_factor: float = 0.8):
        self.slo_ms = slo_ms
        self.safety_factor = safety_factor

    def admit(self, cost: RequestCost, queue: "QueueState") -> tuple[bool, str]:
        # Predicted wait = sum of outstanding work / capacity, plus our cost
        outstanding_ms = queue.total_estimated_ms()
        predicted_wait_ms = outstanding_ms / max(queue.active_replicas, 1)
        predicted_completion = predicted_wait_ms + cost.estimated_ms

        budget = self.slo_ms * self.safety_factor
        if predicted_completion > budget:
            return False, f"predicted {predicted_completion:.0f}ms > budget {budget:.0f}ms"
        return True, "ok"
That's it. That's the whole queue-theoretic part. You maintain a running estimate of outstanding work, divide by current serving capacity, add the incoming request's own cost, and compare against your budget.
The safety factor (0.8) accounts for the fact that your estimates are wrong. If you set it to 1.0, you'll admit requests that predict exactly at the SLO and then blow it. I've found 0.75–0.85 works well in practice. Tune it.
Wiring it into a FastAPI gateway
You need this in front of your inference servers, before requests hit vLLM. Here's the shape:
python
from fastapi import FastAPI, Request, HTTPException
import asyncio

app = FastAPI()
admission = AdmissionController(slo_ms=SLO_P95_MS)
queue = QueueState()  # shared state, see below

@app.post("/v1/completions")
async def completions(req: Request):
    body = await req.json()
    cost = estimate_cost(body["prompt"], body.get("max_tokens", 512))

    ok, reason = admission.admit(cost, queue)
    if not ok:
        # 429 with Retry-After is the contract clients expect
        raise HTTPException(
            status_code=429,
            detail={"reason": reason, "retry_after_s": 2},
            headers={"Retry-After": "2"},
        )

    queue.track_accept(cost)
    try:
        return await forward_to_vllm(body, cost)
    finally:
        queue.track_complete(cost)
The queue state is the tricky bit — it has to be consistent across all your gateway replicas. Options: Redis with atomic increments, or a gossip protocol. We use Redis with a short TTL key per in-flight request. Redis sorted sets keyed by completion time give you a clean way to expire stale entries when a replica dies mid-request.
Feeding admission decisions back into autoscaling
Here's where it gets interesting. Your admission controller rejects requests. That rejection rate is itself the best autoscaling signal you have.
python
# Exported metric
# inference_admission_rejected_total{reason="slo_miss"}
# inference_admission_accepted_total

# HPA-style scaling policy (pseudocode — you'd implement as a custom controller)
def desired_replicas(current: int, accept_rate: float, reject_rate: float, queue_depth: int) -> int:
    total = accept_rate + reject_rate
    if total == 0:
        return current

    reject_ratio = reject_rate / total
    # Target: reject ratio < 1%, queue depth < 4 per replica
    if reject_ratio > 0.02 or queue_depth / current > 8:
        return min(current * 2, MAX_REPLICAS)  # scale up aggressively
    if reject_ratio < 0.001 and queue_depth / current < 2 and current > MIN_REPLICAS:
        return max(current - 1, MIN_REPLICAS)  # scale down slowly
    return current
Note the asymmetry. Scale up fast (2x), scale down slowly (linear). This is deliberate — GPU cold start is expensive, so you want to overshoot on the way up and be lazy on the way down. KEDA's scaleUp and scaleDown stabilization windows encode the same intuition, but the logic above uses the rejection rate as the primary signal, which is far more informative than GPU utilization.
If you're on Kubernetes and want to wire this into a real HPA, you can register a custom metric via Prometheus Adapter. Something like:
yaml
apiVersion: autoscaling/v2
kind: HorizontalPodAutoscaler
metadata:
  name: vllm-inference
spec:
  scaleTargetRef:
    apiVersion: apps/v1
    kind: Deployment
    name: vllm-llama-70b
  minReplicas: 4
  maxReplicas: 40
  metrics:
    - type: Pods
      pods:
        metric:
          name: vllm_num_requests_waiting
        target:
          type: AverageValue
          averageValue: "6"         # per-pod queue target
    - type: Pods
      pods:
        metric:
          name: inference_admission_rejected_ratio
        target:
          type: AverageValue
          averageValue: "0.01"      # 1% reject ratio goal
  behavior:
    scaleUp:
      stabilizationWindowSeconds: 30
      policies:
        - type: Percent
          value: 200
          periodSeconds: 60
    scaleDown:
      stabilizationWindowSeconds: 600
      policies:
        - type: Percent
          value: 20
          periodSeconds: 120
That two-metric setup — queue depth and rejection ratio — covers both steady-state and hit-by-a-wave conditions.
Latency vs throughput: you don't get to pick both
Here's a contrarian take that'll annoy people who came from CPU-based serving: for GPU inference, latency and throughput are not a continuum you tune between. They're structurally opposed.
On CPUs, you can add more threads and get a bit more throughput with a small latency cost. On GPUs, you have a fixed memory bandwidth budget and a fixed set of tensor cores. Every additional concurrent request you batch adds decode time because decode is memory-bandwidth-bound and sequences compete for the same bandwidth. Batch size 1, latency is best, throughput is terrible. Batch size 32, throughput is best, latency is 3-5x worse.
This means your autoscaling policy has to be explicit about which one you're optimizing. If you're running a customer-facing chat, you probably want batch size capped and more replicas. If you're running an offline batch job, you want max batch size and fewer replicas. The gpu cluster admission control latency vs throughput trade-off is a config choice, not a knob you can defer.
At SIVARO we make this explicit per-endpoint: each route declares whether it's a "latency" or "throughput" class, and the admission controller uses a different safety factor and target batch size. Latency-class gets SLO budget of ~1.5s and rejects aggressively. Throughput-class gets a 60s budget and queues deep.
Teams that don't make this choice end up with a system that's mediocre at both. The classic symptom: batch timeout set to 50ms (a latency-friendly default), batch size capped at 8, and 40 GPUs pegged at 100% utilization while every request takes 3 seconds. If they'd just batch bigger and admit fewer requests, they'd hit the same throughput at half the GPU count.
What this looks like in a real incident
I'm not going to name the client, but this happened at a healthcare company running a clinical-summarization pipeline in June 2026.
They had 12 H100s. Traffic pattern: near-zero overnight, spike at 8am when clinicians start their day. No admission control. HPA on GPU utilization.
The spiked traffic hit at 8:02. Utilization went to 100% within 20 seconds. HPA fired. Autoscaler asked for 24 replicas. Kubernetes provisioned nodes over the next 9 minutes. Meanwhile, requests piled up in vLLM's queue. At 8:11, when the first new replicas came online, the queue had ~4,000 requests. Each replica could handle ~15 concurrent. So 24 replicas could handle ~360 concurrent. The queue was still growing faster than it was draining.
By 8:30, latency had gone from a normal 1.8s p95 to 47s p95. Clients were timing out at 30s. Every timed-out request freed a slot but produced no useful work. Effectively zero throughput for 25 minutes. The whole thing cost them roughly $2,400 in GPU time (they over-provisioned to 24 replicas and then had nothing to do with 12 of them once traffic normalized at 9:15) and, more importantly, a same-day incident review with their CTO.
We implemented admission control on top of their existing stack in two weeks. Same traffic pattern in August 2026, same hardware. Spike hit at 8:01. Admission controller started rejecting at 8:02 with 429s (Retry-After: 4). About 7% of requests were shed in the first 90 seconds. p95 latency peaked at 3.1s. Rejection rate dropped to zero by 8:06. HPA still scaled, but only to 16 replicas, and they came online to find work ready for them instead of a collapsed queue.
7% requests rejected, 0% mass timeout. That's the trade you're making.
FAQ
Why not just queue everything and process in order?
Because queue time is latency, and latency beyond your SLO is wasted work. If a client times out at 30s and you finish at 47s, you burned GPU cycles for nothing. Rejecting early frees the cycle for a request that can actually be served in time. Queueing only helps when the queue drains faster than the SLO.
Doesn't admission control just move the problem to the client?
It moves visible failure to the client — a 429 instead of a timeout. That matters: clients can productively retry a 429 with backoff. They can't do anything useful with a timeout except retry and make things worse. And with proper autoscaling wired to rejection rate, rejection is temporary and correlates with scaling activity.
How do I pick the safety factor?
Start at 0.8. Watch your p95 latency against your target. If you're consistently below target, raise to 0.85. If you're blowing it, drop to 0.75. Every cluster I've worked on ends up between 0.75 and 0.85. There's no math that gets you there faster than measurement.
What about multi-tenant clusters?
Per-tenant admission buckets. Give each tenant their own SLO budget and a reserved slice of capacity. Otherwise one tenant's burst sheds everyone else's traffic. This gets politically messy — allocation is a business question, not a technical one.
Does this work with vLLM's own scheduler?
Mostly. vLLM has continuous batching and an internal scheduler, but its queue is FIFO with no deadline awareness. If you push 5,000 requests at it, it takes them all and serves them roughly in order. That's exactly what you don't want. Admission control in front of vLLM lets you shape the input so vLLM's internal queue stays bounded.
Is there a vendor that does this?
Not really. NVIDIA's Triton has a scheduler with a "priority" mode but not admission control. Ray Serve has autoscaling but its admission logic is basic. Anyscale has rate-limiting, not SLO-aware admission. Bedrock and Vertex AI do this internally, but if you're self-hosting, you're building it. I've looked — there isn't an off-the-shelf component that does queue-theoretic admission for GPU inference. That's partly why I wrote this.
What's the biggest mistake you see?
Treating admission control and autoscaling as separate systems with separate owners. They have to run as one feedback loop. The admission controller's rejection metrics are the best autoscaling signal you have, and the autoscaler's replica count is one of the admission controller's most important inputs. If they're owned by different teams with different on-call rotations, they'll drift and fight each other.
Will this work for very short requests like embeddings?
Less benefit. Embedding requests have near-uniform cost and sub-100ms latency. Admission control helps most when request costs vary widely and latency is measured in hundreds of milliseconds to seconds. For embeddings, just autoscale on RPS.
Getting this right took us three iterations
The first version I built, in 2024, tried to do admission inside the inference server process. Bad idea — you need a shared view across replicas, and in-process state doesn't give you that. Version two used a sidecar with a Redis queue, which worked but added 40ms of latency to every request. The current version keeps admission decisions stateless-critical (Redis with short TTLs) and does the estimation locally, so per-request overhead is ~2–3ms.
If you're starting now, start with the FastAPI-shape I showed above and evolve. Don't build the perfect thing. Build the thing that rejects 5% of traffic during a spike and ships a 429 with a Retry-After header. That's 80% of the value. Everything else — cost estimation accuracy, multi-tenant buckets, throughput-vs-latency routing — is refinement.
The single biggest shift you have to make is mental: your GPU cluster is not a web service. It's a resource-constrained batch processor that happens to answer requests. Once you internalize that, the gpu inference autoscaling pitfalls admission control is meant to solve stop looking like separate problems. They're the same problem: your system is accepting work it can't complete in time, and no one is saying no.
Start saying no. Your p95 will thank you.
Nishaant Dixit — Founder of SIVARO. Building data infrastructure and production AI systems since 2018. Built systems processing 200K events/sec.