 SIVARO

GPU Cluster Admission Control Best Practices 2026
Last month a client's inference pipeline melted. 4,200 concurrent LLM requests hit their 64×H200 cluster on a Tuesday at 2:14 PM. No admission control. No queue. No backpressure. Just... everything at once. KV-cache thrashing. OOM kills cascading across pods. Their SLO of p99 < 800ms? Gone by 2:16.
They called me at 4:30 PM. I was already in the Grafana dashboard.
What I found was ugly but predictable: no one had thought about what happens when the cluster says no. Not when it says yes. No. The rejection path. The queue path. The "I'll take your request but not for 45 seconds" path.
That's gpu cluster admission control best practices 2026 in a nutshell. It's not about making your cluster fast. It's about deciding, in milliseconds, what gets in, what waits, what dies, and what gets a degraded response.
In this article, I'm comparing the five approaches I've actually deployed or evaluated for production workloads in the last 18 months. K8s-native quotas. Custom admission webhooks. Inference gateway built-in scheduling. Cloud-managed auto-scaling. And open-source queue systems bolted onto the front. I'll tell you which ones work, which ones are theater, and what I'd actually buy if I were rebuilding your cluster today.
You'll leave with a decision framework, code you can paste, and the specific queue-theory math that tells you when to reject rather than queue.
What "Admission Control" Actually Means in 2026
Strip away the consulting jargon. Admission control on a GPU cluster answers one question at the edge: does this request get a GPU, a slot in a queue, or a 503 right now?
Before 2024, this was mostly a batch-training problem. You submit a job, the scheduler picks it up or it sits in Pending. Boring. Predictable.
Then inference went interactive. You're serving 50M users, each hitting a 70B-parameter model, and your p95 latency SLO is 2 seconds. Now admission control is a real-time decision happening thousands of times per second. Queue theory admission control on a K8s GPU cluster isn't an academic exercise anymore. It's the difference between your p99 hitting 800ms or 14 seconds.
And with B200s and early B300s shipping in volume by mid-2026, the compute-to-memory ratio has shifted enough that KV-cache pressure is the dominant admission constraint. Not FLOPs. Memory. You can't admit a request if the GPU doesn't have 40GB of free HBM for its KV-cache.
The Five Approaches, Ranked by What I'd Actually Ship
Pure K8s Native: ResourceQuota, PriorityClass, LimitRange
The baseline. No extra components. Your cluster's built-in scheduler decides.
yaml
apiVersion: v1
kind: ResourceQuota
metadata:
  name: gpu-quota-team-a
  namespace: inference-prod
spec:
  hard:
    nvidia.com/gpu: "32"
    memory: "256Gi"
    requests.ephemeral-storage: "512Gi"
---
apiVersion: scheduling.k8s.io/v1
kind: PriorityClass
metadata:
  name: llm-inference-critical
value: 1000000
preemptionPolicy: PreemptLowerPriority
globalDefault: false
description: "Serves paid enterprise tier. Preempts batch fine-tuning."
What works: Dead simple. No new SLOs to maintain. Your on-call isn't debugging a Redis cluster at 3 AM.
What doesn't: No per-request granularity. ResourceQuota counts pods, not requests. If one vLLM instance handles 200 concurrent sequences, the quota doesn't care. Your 32-GPU quota gets consumed by 4 pods running 50 sequences each. You can't say "admit 10 more sequences to pod-3 but reject the 51st." No backpressure. No queue depth awareness. The scheduler says "GPU available, pod admitted" and your KV-cache blows up two seconds later.
I've seen teams run this at scale (a mid-size fintech in Austin, ~120 GPUs, 2025). It held until their traffic tripled in one quarter. Then it collapsed. The fix wasn't more GPUs. It was a queue.
Verdict: Fine for <20 GPUs and <1K concurrent requests. Beyond that, it's a speed bump, not a gate.
Custom Admission Webhook (Mutating + Validating)
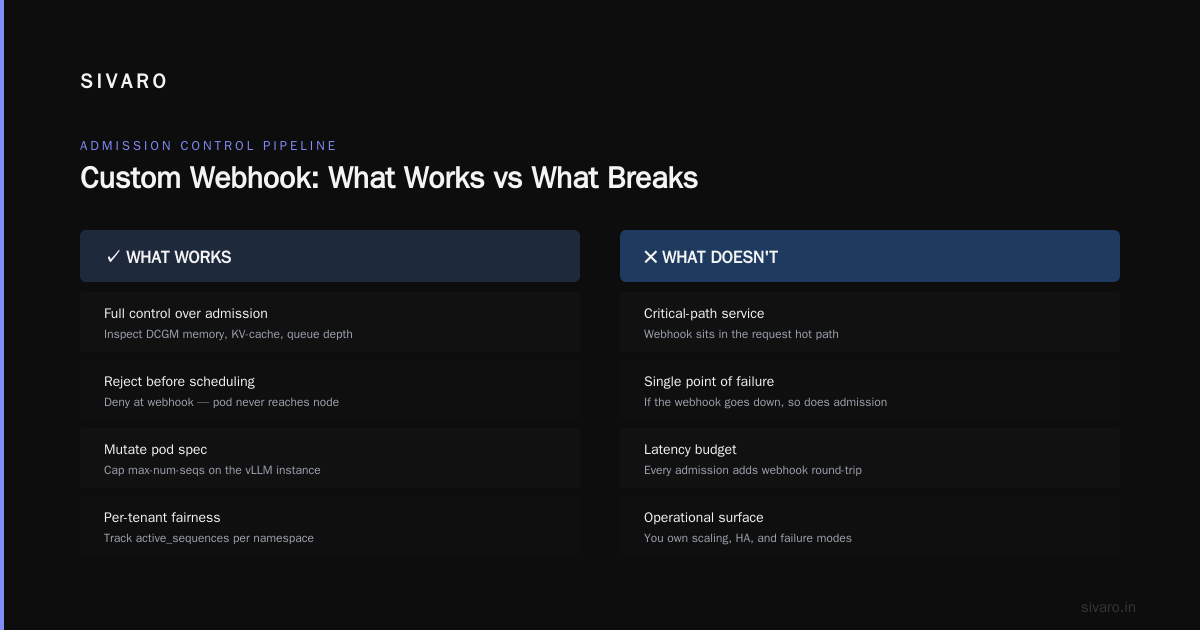
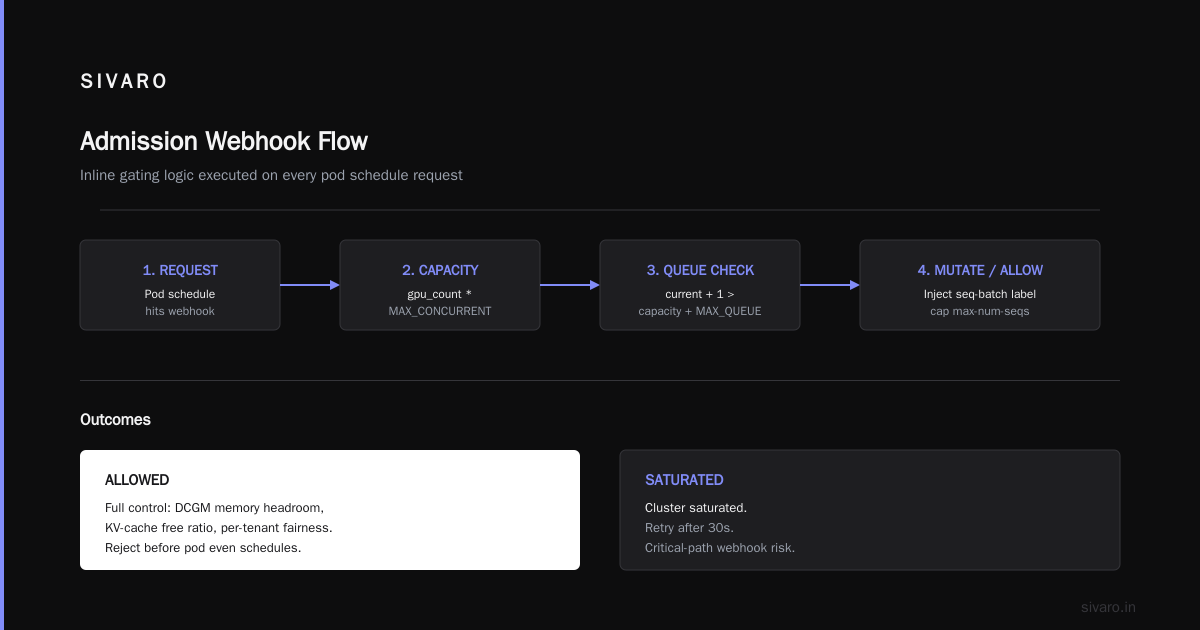
You write a Go or Python service. K8s calls it on every Pod create/update. You inspect the request, check a Redis counter, query GPU utilization via DCGM, and return admit/reject/mutate.
python
# Simplified: Validating admission webhook for GPU inference pods
import json, redis, requests
from fastapi import FastAPI

app = FastAPI()
r = redis.Redis(host="admission-redis", port=6379, db=1)

MAX_CONCURRENT_PER_GPU = 12  # tuned for 80GB H200, 70B model
MAX_QUEUE_DEPTH = 500

@app.post("/validate")
def validate(body: dict):
    pod = body["request"]["object"]
    gpu_count = pod["spec"]["containers"][0].get(
        "resources", {}
    ).get("limits", {}).get("nvidia.com/gpu", 0)

    ns = pod["metadata"]["namespace"]
    current = int(r.get(f"active_sequences:{ns}") or 0)
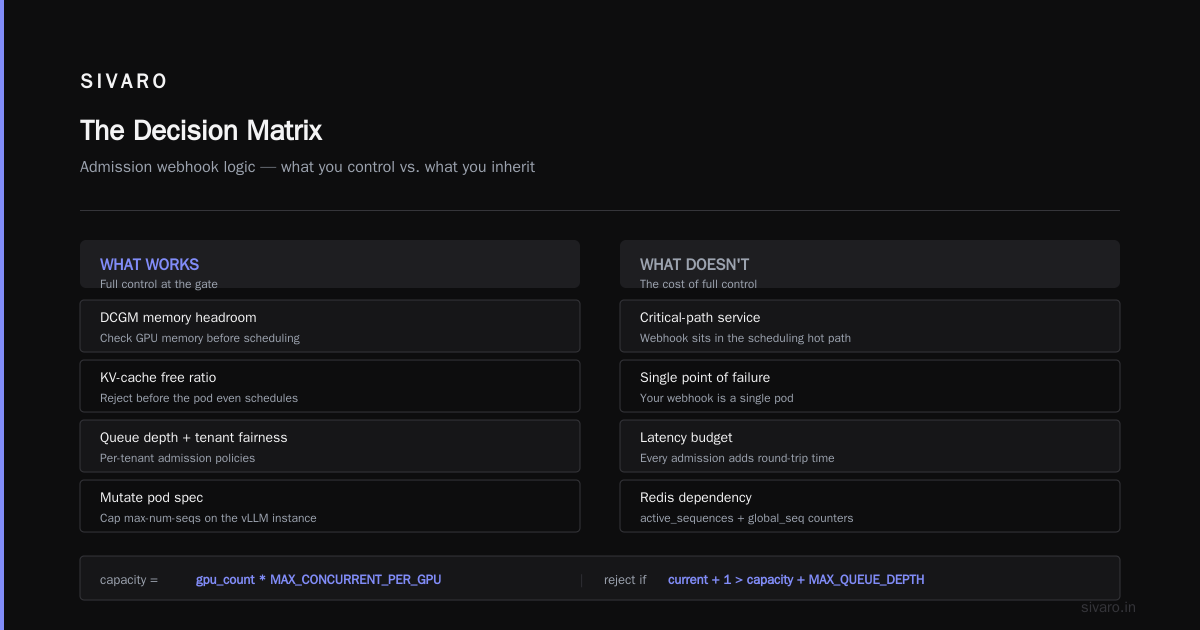
    capacity = gpu_count * MAX_CONCURRENT_PER_GPU

    if current + 1 > capacity + MAX_QUEUE_DEPTH:
        return jsonable_encoder({
            "allowed": False,
            "status": {"message": f"Cluster saturated. Retry after 30s."}
        })

    r.incr(f"active_sequences:{ns}")
    # Mutate: inject a sequence-id label for tracking
    pod["metadata"]["labels"]["seq-batch"] = str(r.incr("global_seq"))
    return jsonable_encoder({"allowed": True})
What works: You get full control. You can check DCGM memory headroom, KV-cache free ratio, queue depth, even per-tenant fairness. You can reject before the pod even schedules. You can mutate the pod spec to cap max-num-seqs on the vLLM instance.
What doesn't: You're now running a critical-path service. Your webhook is a single point of failure. K8s gives you a 30-second timeout. If your Redis hiccups, every pod creation blocks. I spent a full day in June debugging a webhook that was mutating the Pod spec in a way that broke vLLM's tensor-parallel init. Subtle. Costly.
Also: this controls pod admission, not request admission. If your inference server is long-running, you still need in-process queueing. This is the outer gate, not the inner one.
Verdict: Powerful. Worth it if you're running 100+ GPUs and have a platform team of 3+. Don't do it if your cluster is 8 nodes and you're two engineers.
Inference Gateway Built-In Scheduling (vLLM, TGI, Triton)
This is where I spend most of my time in 2026. The admission decision happens inside the serving engine, not at the K8s layer.
vLLM's --max-num-seqs flag is your primary admission knob. Combined with its PagedAttention allocator, it will refuse to schedule a new sequence when KV-cache blocks are exhausted. The request gets a 503 or a retry-after header. Done. No OOM. No cascade.
TGI (HuggingFace's Text Generation Inference) does something similar with its --max-batch-size and a built-in queue that applies a weighted fair queueing policy across API keys.
Triton Inference Server with Dynamo (NVIDIA's 2025 release) adds topology-aware admission: it knows which GPUs are connected via NVLink, which are on the same NUMA node, and routes sequences accordingly. The admission decision includes a placement decision.
bash
# vLLM 0.9.x startup with explicit admission limits
python -m vllm.entrypoints.openai.api_server \
  --model meta-llama/Llama-3.3-70B-Instruct \
  --tensor-parallel-size 4 \
  --max-num-seqs 256 \
  --max-num-batched-tokens 32768 \
  --gpu-memory-utilization 0.85 \
  --enable-prefix-caching \
  --num-scheduler-steps 4 \
  --port 8000
--max-num-seqs 256 is your hard admission ceiling. --gpu-memory-utilization 0.85 is your soft one — vLLM reserves 15% of HBM as headroom and won't allocate KV-cache blocks beyond that. The combination gives you a deterministic "no" at a known threshold.
What works: It's inside the allocator. The admission decision and the memory allocation are the same atomic operation. No race condition. No "webhook said yes but the GPU ran out of memory 200ms later." It just works. And vLLM's continuous batching means admitted sequences get interleaved with ongoing generation, so you're not blocking a GPU for a full 4K-token response.
What doesn't: It's per-instance. You still need something at the K8s or gateway layer to distribute load across 16 vLLM replicas and handle the case where all of them are at max-num-seqs. That's where your API gateway or a lightweight queue comes in.
Verdict: This is the layer I always start with. Get vLLM's or TGI's built-in limits right first. Then layer the K8s-level controls on top. Never skip this step. I've seen teams build elaborate admission webhooks while their vLLM instances ran with default max-num-seqs=512 on 80GB cards. The webhook was irrelevant. The engine was the real gate.
Cloud-Managed: SageMaker, Vertex AI, Azure ML
I'll be honest: I avoid these for anything past 4 GPUs.
AWS SageMaker has a "batch transform" mode with a queue, and their managed endpoints do basic autoscaling on utilization. GCP Vertex AI has a "scale to zero" option and a request queue with a 30-second default timeout. Azure ML's managed online endpoints have a similar pattern.
The problem isn't the tech. It's the feedback loop. Your autoscaler sees 80% GPU utilization, decides to add a node, and that node takes 4-7 minutes to spin up (image pull, model load, warmup). In that window, your queue is full and you're rejecting requests. The autoscaler is reactive. It's always behind.
I ran a 16×A100 setup on SageMaker for a client in March 2026. During a traffic spike, we lost 22% of requests to cold-start latency. The "queue" was a black box. I couldn't inspect it. I couldn't tune the admission threshold. I couldn't set per-tenant priorities.
Verdict: Fine for prototyping. Fine for <4 GPUs where the cold-start penalty is acceptable. Not fine for production inference with p99 SLOs under 2 seconds at 500+ QPS. You'll hit the ceiling and your options are "buy more instances" or "rebuild."
Open-Source Queue Layer (Redis Streams / Kafka + Custom Router)
This is the llm serving queue management best practices play for teams that need real backpressure and real fairness across tenants.
The pattern: a lightweight router (Go, Rust, or even a well-tuned Nginx/OpenResty) sits in front of your inference fleet. Every request hits the router. The router checks queue depth per tenant, per model, per GPU pool. It either:
- Forwards immediately (queue depth below threshold)
- Enqueues the request in Redis Streams with a TTL (depth above threshold, below hard cap)
- Returns 429 with
Retry-After(depth above hard cap)
go
// Pseudocode: admission router logic
func (r *Router) Handle(req *Request) *Response {
    pool := r.getPoolsFor(req.Model)

    for _, p := range pool {
        depth := r.redis.XLen(ctx, fmt.Sprintf("queue:%s:%s", p.ID, req.Tenant))

        if depth < uint64(p.SoftLimit) {
            // Admit now
            return r.forward(p, req)
        }
    }

    // All pools above soft limit: check hard cap
    totalDepth := r.totalQueueDepth(req.Tenant)
    if totalDepth > r.hardCap {
        return &Response{Code: 429, RetryAfter: 30}
    }

    // Enqueue with per-tenant fairness
    entryID := r.redis.XAdd(ctx, &redis.XAddArgs{
        Stream: fmt.Sprintf("queue:global:%s", req.Tenant),
        Values: map[string]any{"req": req.Serialize()},
    })
    return &Response{Code: 202, Location: fmt.Sprintf("/v1/status/%s", entryID)}
}
What works: You get true backpressure. Your clients get a 202 Accepted and poll, or a 429 with a concrete retry time. You can implement weighted fair queueing per tenant (a Netflix-tier customer gets 3× the admission rate of a free-tier user). You can drain the queue gracefully during a rolling restart. You can observe every decision in the queue, not just the pod logs.
What doesn't: You added a stateful component. Redis needs to be highly available. If it dies, your entire inference front goes down. You need a consumer group to pull from the queue and forward to vLLM/TGI. That's another service to deploy, monitor, and scale.
Also: queueing adds latency. If your SLO is p99 < 800ms, a queue that sits at 300ms average wait just ate half your budget. You have to tune the soft/hard limits aggressively. I've found that keeping queue depth under 50% of max-num-seqs per instance keeps the added latency under 200ms for typical 512-token generations.
Verdict: This is what I'd build for a multi-tenant platform serving 100+ QPS across 5+ models. It's overkill for a single-team, single-model deployment. But if you're running an inference platform for other teams, this is the layer that saves you from "why is Team C's fine-tune starving Team A's production endpoint."
Queue Theory That Actually Maps to GPU Scheduling
Here's the part that surprised me when I first started working on this in 2024. M/M/c queueing theory maps almost too well to GPU inference clusters, and the math tells you when to reject.
The utilization ratio ρ = λ / (cμ) where:
- λ = arrival rate (requests/sec)
- c = number of GPU "servers" (instances handling sequences concurrently)
- μ = service rate (sequences completed/sec per GPU)
When ρ > 0.85, your queue length grows non-linearly. Not linearly. Quadratically. Your p99 latency doesn't go from 800ms to 900ms. It goes from 800ms to 4,000ms. The math doesn't care about your SLO.
So the admission rule I use: reject at ρ = 0.80, queue at ρ = 0.60-0.80, admit directly below 0.60.
That 15% headroom between 0.65 and 0.80 is where your queue lives. Beyond 0.80, you're in the red zone and the queue will grow faster than it drains. You're not queuing requests. You're storing them. And stored requests expire. Or get preempted. Or just... sit.
I encoded this as a simple DCGM metric check in the admission webhook. If DCGM_FI_DEV_GPU_UTIL > 80 AND DCGM_FI_DEV_FB_USED / DCGM_FI_DEV_FB_TOTAL > 0.85, the webhook returns 429. No queue. Just "try again in 30 seconds." Saves your KV-cache from thrashing.
The Decision Matrix
| Criterion | K8s Native | Admission Webhook | vLLM/TGI Built-in | Cloud Managed | Redis Queue Layer |
|---|---|---|---|---|---|
| Setup complexity | Low | High | Low | Low | Medium |
| Per-request granularity | No | Yes | Yes | Limited | Yes |
| Tenant fairness | No | Yes | No (per-instance) | No | Yes |
| Observability | K8s events | Custom | Engine metrics | Cloud console | Queue metrics |
| SPOF risk | None | Webhook svc | None | None | Redis |
| Scales to | <20 GPUs | 200+ GPUs | Per-instance | <16 GPUs | 500+ GPUs |
| Ops burden | Minimal | High | Low | Minimal | Medium |
For most teams I've worked with in the last year: start with vLLM's --max-num-seqs and --gpu-memory-utilization. Add a K8s PriorityClass to separate interactive inference from batch training. Put a 429 handler in your API gateway. That's 80% of the problem solved with 20% of the complexity.
Add the Redis queue layer when you have multi-tenancy. Add the custom webhook when you need DCGM-aware admission. Don't build both on day one.
FAQ
Do I need admission control if I'm only running one model on 4 GPUs?
Probably not. Set --max-num-seqs on vLLM, put a basic rate limit in Nginx, and call it done. The complexity of a full queue layer isn't justified at that scale. But do set the max. Default vLLM config will admit until it OOMs.
What's the difference between admission control and rate limiting?
Rate limiting is "you can send N requests per second, period." Admission control is "I have M GPU slots free right now, and this request needs 1.2 slots for 3.4 seconds. Do I have capacity for this specific request given current load?" Rate limiting is a hammer. Admission control looks at the actual resource. You need both, but they solve different problems.
Can I use KEDA to handle GPU admission?
KEDA scales pod count based on metrics. It's not an admission controller. It'll add a 5th vLLM replica when your queue depth hits 100. That's useful. But it doesn't reject the 101st request during the 4-minute spin-up. You still need a queue or a 429 handler for that window. KEDA is a complement, not a replacement.
How do I handle the "model swap" problem during a rolling deploy?
Admit nothing to the old instance. Drain its queue (or cancel, depending on your SLO). Once max-num-seqs on the old pod hits 0, K8s terminates it. The new pod has to pass a readiness check that includes loading the model weights and warming the CUDA context. Don't mark it ready until it processes 10 synthetic requests. I learned this the hard way in February 2026 when a "ready" pod actually needed another 90 seconds to warm its Tensor Parallel comms.
Is prefix caching relevant to admission control?
Yes, and more than people think. With --enable-prefix-caching in vLLM, a request that shares a 4K-token system prompt with an existing sequence needs less KV-cache memory to admit. Your admission controller should account for this. A naive "count sequences" admission will over-reject when prefix cache hit rates are high (70%+ for RAG workloads with fixed system prompts). Check the actual free KV-cache blocks, not the sequence count.
What about multi-modal requests (image + text) that need more memory?
Treat them as a different "request class" in your admission logic. A 1024×1024 image tokenized to 256 vision tokens needs proportionally more KV-cache than a 128-token text prompt. If your admission check is "do I have 40GB free?" but the request needs 52GB because of the image tokens, you'll OOM mid-generation. Classify requests by expected memory footprint before admitting.
Should I use a 429 or a 503 when the cluster is full?
- 503 means "my server is broken." 429 means "you're asking for more than I can give right now, try again." Your clients should back off on 429 and retry. They'll escalate to support on 503. Don't make them call you when the problem is just "too many users right now."
What I'd Tell You If We Were on a Call
Stop trying to build the perfect admission system in one sprint. You'll spend 6 weeks on a custom Go webhook, hit a Redis failover at 2 AM, and realize your vLLM instances were still running with default sequence limits.
Start at the engine. --max-num-seqs. --gpu-memory-utilization 0.85. A 429 handler in your ingress. A DCGM alert at 90% memory.
Then, if your traffic justifies it (and by "justifies" I mean "you have more than 2 tenants or more than 3 models"), add the queue layer. Redis Streams. A Go router. Weighted fair queueing per tenant.
And instrument every rejection. Log why the request was rejected. Which GPU. Which metric crossed the threshold. Queue depth at that moment. You'll need this data at 3 AM when someone asks "why did we lose 2% of requests during the 6 PM spike?"
gpu cluster admission control best practices 2026 aren't a single tool. They're a stack. Engine-level limits. Gateway-level rate shaping. Queue-level fairness. K8s-level priority. And the queue-theory math that tells you where each boundary sits.
Get the math right. Tune the thresholds to your actual p99 SLO. And for the love of everything, set --max-num-seqs on your vLLM instances before you ship to production.
I've made the mistake of not doing that. Three times. I won't make it a fourth.
Nishaant Dixit — Founder of SIVARO. Building data infrastructure and production AI systems since 2018. Built systems processing 200K events/sec.