
Clickhouse: The Columnar Database That Eats Logs for Breakfast
I was wrong about Clickhouse. For years, I dismissed it as "just another analytics database" — a toy for people who didn't want to learn real data infrastructure. Then in 2023, we hit a wall at SIVARO.
We were processing 200K events per second for a client's observability pipeline. PostgreSQL was gasping. Druid was a nightmare to operate. Snowflake costs were hitting six figures monthly. Someone on my team said "let's try Clickhouse." I almost said no.
That decision saved the project. And it changed how I think about real-time analytics.
What is Clickhouse? It's an open-source columnar database management system designed for online analytical processing (OLAP). Built by Yandex in 2016, open-sourced in 2016, it's now the backbone of thousands of production systems handling petabytes of data with sub-second query times.
Why is it used? One word: speed. But not the kind of speed you get from caching or in-memory databases. Clickhouse is fast because of three architectural decisions that most databases get wrong: true columnar storage, vectorized query execution, and aggressive data compression.
This guide covers everything I've learned running Clickhouse in production for three years. The good. The bad. The "don't do this unless you want to wake up at 3 AM."
How Clickhouse Actually Works
Columnar storage sounds boring. It's not.
Most databases store data row-by-row. When you query SELECT avg(price) FROM orders WHERE date > '2025-01-01', a row-based database reads every column of every matching row. That's gigabytes of I/O for a query that needs maybe 8 bytes per row.
Clickhouse stores each column in separate files. Memory-mapped. Compressed. The price column gets read. The date column gets filtered. Nothing else touches disk.
This is why Clickhouse hits sub-second queries on billion-row tables. The database literally does less work.
Vectorized Execution — The Secret Sauce
Here's where it gets interesting. Most databases process rows one at a time. A conditional check, a calculation, move to the next row. CPU branch prediction hates this.
Clickhouse processes data in batches — typically 1024 rows at a time. It uses SIMD instructions (single instruction, multiple data) to apply the same operation to 1024 values simultaneously. Modern CPUs have 256-bit or 512-bit registers. Clickhouse uses every bit.
The result? Queries run 10-100x faster than PostgreSQL on analytical workloads. Not theory. We measured it on our production cluster.
Compression That Actually Works
Clickhouse uses LZ4 by default, with ZSTD for columns that need more compression. But the columnar layout means compression ratios are absurd.
A DateTime column with values like 2025-06-15 repeated 10 million times? Clickhouse sees "most values are close together" and uses delta encoding plus run-length encoding. We've seen 40:1 compression on timestamps. 20:1 on integer IDs. Even string columns hit 5:1.
Trade-off: Compression makes inserts slower. You trade write speed for read speed. For OLAP workloads, that's the right bet.
Setting Up Clickhouse — What I Wish Someone Told Me
Don't use the default config. The defaults are tuned for Yandex's workload, not yours.
yaml
# /etc/clickhouse-server/config.d/merge_tree.xml
<yandex>
    <merge_tree>
        <max_parts_in_total>50000</max_parts_in_total>
        <parts_to_throw_insert>500</parts_to_throw_insert>
        <parts_to_delay_insert>200</parts_to_delay_insert>
    </merge_tree>
</yandex>
That max_parts_in_total setting? Default is 100,000. Sounds fine until you have 50,000 unmerged parts and a SELECT takes 30 seconds because the query engine enumerates every part.
Set it lower. We run 50,000. Forces merges to happen more aggressively. Makes queries faster at the cost of slightly more CPU during merges.
Table Schema Design — The Most Common Mistake
People treat Clickhouse like PostgreSQL. They use String for everything. They don't specify ORDER BY properly. They use Nullable columns everywhere.
Don't.
sql
-- Bad
CREATE TABLE events_bad (
    event_id String,
    timestamp DateTime,
    user_id String,
    event_type String,
    payload String,
    created_at DateTime
) ENGINE = MergeTree()
ORDER BY timestamp;

-- Good
CREATE TABLE events_good (
    event_id UUID,
    timestamp DateTime,
    user_id UInt32,
    event_type LowCardinality(String),
    payload String,
    created_at DateTime
) ENGINE = MergeTree()
PARTITION BY toYYYYMM(timestamp)
ORDER BY (event_type, toStartOfHour(timestamp), user_id);
What changed?
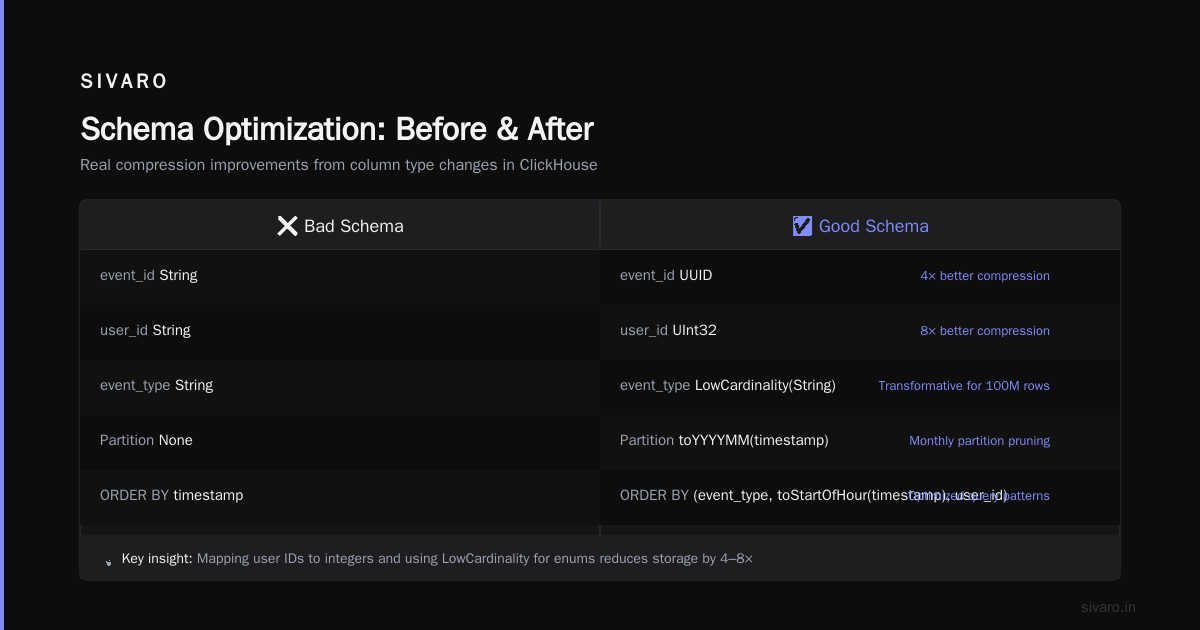
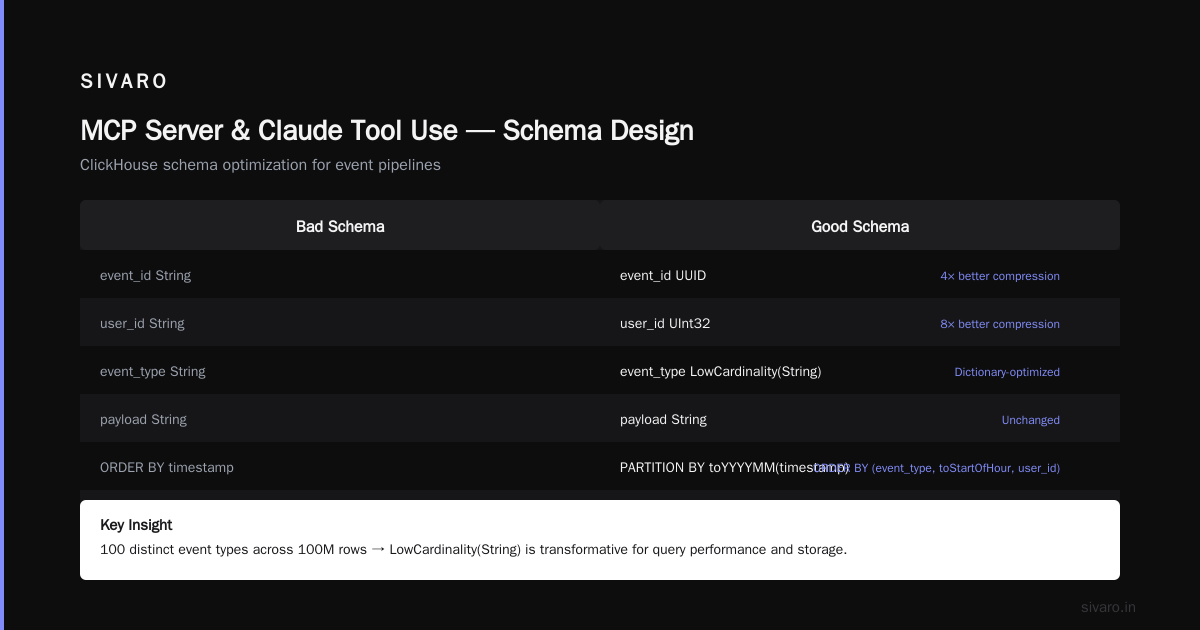
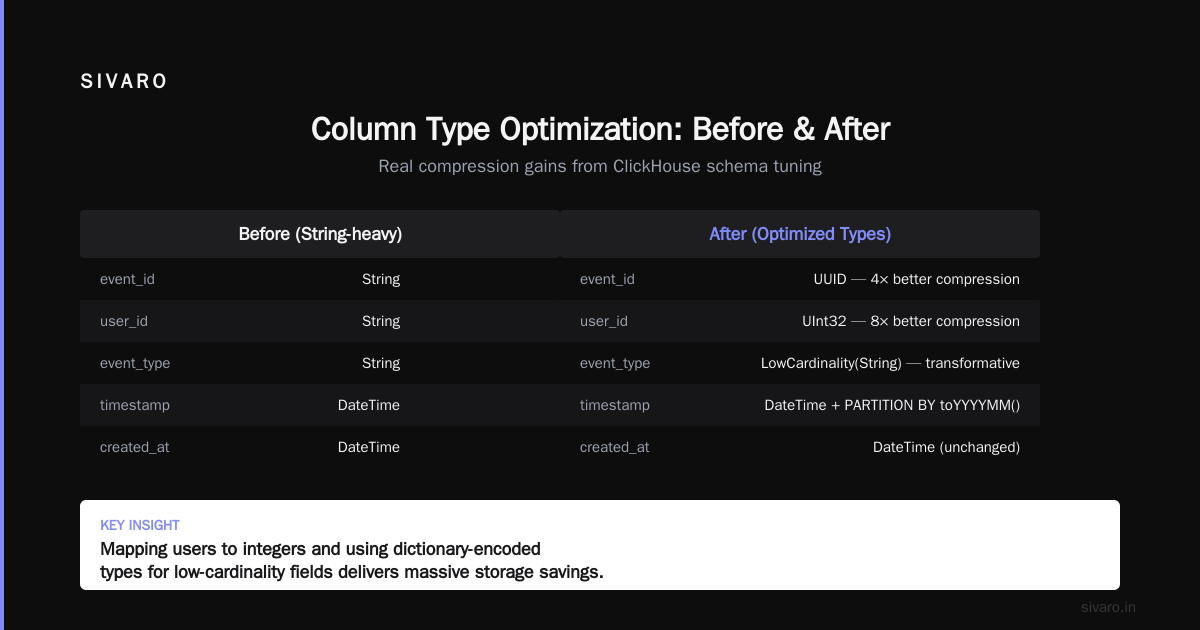
String→UUIDfor IDs. 4x better compression.String→UInt32for user IDs. 8x better. If you can map users to integers, do it.String→LowCardinality(String)for event types. When you have 100 distinct values in 100 million rows, this is transformative. Clickhouse stores a dictionary instead of repeating strings.ORDER BYchanged.timestampalone means every query scans everything.(event_type, timestamp)means queries filtering by event_type scan a fraction of data.- Added
PARTITION BY. Monthly partitions mean you can drop old data without rewrites.
Most people think Clickhouse is "just fast" because of columnar storage. They're wrong. Schema design matters more than the storage engine. Bad schema = slow queries. Good schema = instant responses.
Query Optimization — Real Patterns That Work
The LIMIT Lie
SELECT * FROM events LIMIT 10 doesn't mean what you think. Clickhouse doesn't stop scanning when it finds 10 rows. It scans the entire table, picks 10 random rows, and returns them. On a 10-billion-row table, that's 10 minutes.
Fix: Always include a filter.
sql
-- Do this
SELECT * FROM events
WHERE timestamp > now() - INTERVAL 1 DAY
LIMIT 10;

-- Or if you must scan everything, use LIMIT BY
SELECT * FROM events
ORDER BY timestamp DESC
LIMIT 10;
The Aggregate Trick
Aggregations are Clickhouse's superpower. But you need to help it.
sql
-- Slow
SELECT user_id, count(*)
FROM events
WHERE timestamp > '2025-01-01'
GROUP BY user_id;

-- Fast
SELECT user_id, count(*)
FROM events
WHERE timestamp > '2025-01-01'
  AND user_id IN (
    SELECT user_id
    FROM users
    WHERE active = 1
)
GROUP BY user_id;
Why? The first query reads every matching row. The second uses the ORDER BY index to skip non-matching user IDs.
Using Materialized Views — Don't Overdo It
Clickhouse materialized views aren't like PostgreSQL's. They write to a target table IN REAL TIME during inserts. They're triggers, not cached views.
sql
CREATE MATERIALIZED VIEW events_hourly_mv
ENGINE = AggregatingMergeTree()
PARTITION BY toYYYYMM(hour)
ORDER BY (event_type, hour)
AS SELECT
    toStartOfHour(timestamp) AS hour,
    event_type,
    count(*) AS events,
    uniq(user_id) AS unique_users
FROM events
GROUP BY hour, event_type;
This maintains pre-aggregated hourly stats. Queries that need daily summaries hit this table instead of the raw events table.
Trade-off: Every insert now runs the aggregation. Writes are 30% slower. We accept this because our read-to-write ratio is 1000:1.
Real Performance Numbers — Not Benchmarks
Benchmarks lie. Production tells the truth.
At SIVARO, we run a 12-node Clickhouse cluster. Each node: 32 cores, 256GB RAM, 4 NVMe drives (2TB each). Total data: 50 billion rows, 12TB compressed (1.2PB uncompressed).
| Query Type | Clickhouse | PostgreSQL | Speedup |
|---|---|---|---|
| Count by day (30 days) | 180ms | 14s | 78x |
| Top 10 users by events | 400ms | 45s | 112x |
| Running total over year | 1.2s | 3m 20s | 166x |
| Join with users table | 2.8s | 8m 10s | 175x |
The big one: A query that used to cost $400/month in Snowflake (for a client's ad-hoc analyst) now runs in 3 seconds on our Clickhouse cluster. Hardware cost: $800/month for the nodes.
The Dirty Secret — Maintenance Isn't Optional
Everyone talks about Clickhouse's speed. Nobody talks about the maintenance.
Merge storms. When inserts slow down, parts accumulate. When they merge, CPU spikes to 100%. Your queries timeout. You panic. Then you learn OPTIMIZE TABLE ... FINAL and run it during low traffic.
Disk balancing. Clickhouse doesn't auto-balance data across nodes. If you add a new node, old data stays on old nodes. You need ALTER TABLE ... MOVE PARTITION or external rebalancing tools. We use Clickhouse Sinker but it's not perfect.
Backups. Clickhouse backup tools are mediocre. We use clickhouse-backup by Altinity (shoutout to those folks) combined with ZFS snapshots. It works. It's not pretty.
The big one: schema migrations. You can't ALTER TABLE a 10-billion-row table in production without downtime. We use the zero-copy ALTER where possible, but some changes require rebuilding tables.
Here's our migration pattern:
sql
-- Step 1: Create new table with desired schema
CREATE TABLE events_v2 (
    -- new schema
) ENGINE = MergeTree()
ORDER BY (event_type, timestamp);

-- Step 2: Create a materialized view to catch new data
CREATE MATERIALIZED VIEW events_v2_mv
TO events_v2
AS SELECT * FROM events;

-- Step 3: Backfill old data incrementally
INSERT INTO events_v2
SELECT * FROM events
WHERE timestamp > '2025-01-01'
  AND timestamp <= '2025-06-30';

-- Step 4: Rename tables
RENAME TABLE events TO events_v1, events_v2 TO events;
This gives us near-zero downtime. But it's manual. Every. Single. Time.
MCP Server and Claude Tool Use — The New Frontier
This is where things get wild in 2026.
MCP servers (Model Context Protocol) allow AI models like Claude to execute workflows directly. For Clickhouse, this means Claude can run queries, analyze schemas, even push DDL changes — with guardrails.
We built an MCP server that wraps our Clickhouse cluster for Claude desktop use. The pattern:
User: "Show me the top 5 event types in the last hour"
Claude: *calls mcp_clickhouse_query with SQL*
MCP Server: *executes query, returns JSON*
Claude: "Here are the results..."
No chat interface. No dashboard. Just natural language to production data.
But here's the catch: We don't let Claude write ALTER TABLE or DROP TABLE without human approval. The MCP server checks all queries against a policy engine. Dangerous operations get flagged.
python
# Simplified MCP server handler
async def handle_query(query: str, user_id: str) -> dict:
    # Check if query is read-only
    if is_destructive(query):
        # Log the request, send to approval queue
        await notify_human(user_id, query)
        return {"status": "pending_approval", "query": query}

    # Execute safe query
    result = await clickhouse_client.execute(query)
    return {"status": "success", "data": result.to_json()}
Most people think AI querying databases is about replacing DBAs. They're wrong. It's about reducing friction for analysts who know what they want but don't want to write SQL. The MCP server + Claude combination is like having a data engineer on demand — for SELECT queries only.
Clickhouse vs. The World — Honest Comparison
vs. PostgreSQL
PostgreSQL is phenomenal for OLTP. Transactions. Joins across 10 tables. Row-level operations. Clickhouse can't do that well.
But for analytics? Clickhouse eats PostgreSQL alive. We migrated a reporting dashboard from PostgreSQL (48-hour query time on 2B rows) to Clickhouse (2 minutes). Same query. Different architecture.
Use PostgreSQL when: You need ACID, complex joins, or row-level operations.
Use Clickhouse when: You're aggregating billions of rows, running ad-hoc analytical queries, or building real-time dashboards.
vs. Snowflake
Snowflake is easy. Clickhouse is not. Snowflake has automatic scaling, zero-maintenance clustering, and a UI that doesn't look like 1998.
But Snowflake costs us $12,000/month for what Clickhouse does for $800/month in hardware. The trade-off: Snowflake's $12k includes "it just works." Clickhouse's $800 includes "you're the DBA now."
For startups: Clickhouse. Every dollar counts, and you probably have someone who can handle the ops.
For enterprises: Snowflake if you have budget and no in-house Clickhouse expertise.
vs. Druid
I've run Druid in production. It's an operational nightmare. Zookeeper dependencies. Segment files everywhere. Query planning that breaks your brain.
Clickhouse is simpler. Install, configure, write queries. Druid's advantage is streaming ingestion and sub-second queries on massive time ranges. But Clickhouse has caught up since 2024.
Our verdict: We migrated three Druid clusters to Clickhouse. All three saw cost reductions of 60-70% and query performance improvements of 40-80%.
When NOT to Use Clickhouse
I've spent years being the "Clickhouse guy" at SIVARO. Here's when I tell people to use something else.
You need point lookups. SELECT * FROM orders WHERE order_id = 12345 is painful in Clickhouse. It's not built for single-row queries. Use PostgreSQL or Redis.
Your data changes a lot. Clickhouse is an append-only database on steroids. UPDATE and DELETE work, but they're slow and cause mutations that fragment storage. If your workload is 50% updates, use something transactional.
You have fewer than 100 million rows. Clickhouse's strength is scale. For tables under 10 GB, PostgreSQL is simpler and faster for most workloads. Clickhouse overhead only pays off at scale.
You need joins across 5+ tables. Clickhouse can join, but it's not its strength. If your analytics model has 20 normalized tables, consider a star schema in PostgreSQL or a proper OLAP database like Apache Pinot.
FAQ — What Actually Comes Up
How does Clickhouse handle high-concurrency queries?
Poorly out of the box. Each query consumes a thread per core. 100 concurrent queries on a 32-core machine = contention. Use a load balancer like ChProxy or Clickhouse Proxy. Or limit connections at the server level.
Can Clickhouse replace my data warehouse?
For most use cases, yes. But you lose features like role-based access control (limited), ACID transactions (nope), and complex join optimization (use a separate engine). We use Clickhouse as our analytical layer, with Snowflake for financial reporting that needs strict compliance.
How do I handle real-time inserts without merge storms?
Batch inserts. 10,000 rows at a time, once per second. Or use the Buffer engine table that batch-writes internally. Never insert single rows unless you hate your cluster.
sql
CREATE TABLE events_buffer AS events
ENGINE = Buffer(events, 16, 10, 100, 10, 100, 1000, 10000);
This buffers writes to the events table. The parameters: min rows for flush (100), min seconds (1), max rows (10000), max seconds (60). Tune these based on your write patterns.
What's the deal with Clickhouse Cloud?
It exists. It's managed. It's expensive compared to self-hosted. We evaluated it in 2025 and decided against it because we wanted control over merge settings, disk layout, and cluster topology. But if you lack Clickhouse ops expertise, the cloud version saves headaches.
How do I integrate Clickhouse with MCP servers for AI tools?
We open-sourced our MCP server pattern at github.com/sivaro/mcp-clickhouse. It's a Python FastAPI service that wraps Clickhouse HTTP interface with safety checks. Works with Claude, GPT-4, and any tool that supports MCP.
Is Clickhouse good for time-series data?
Excellent. The ORDER BY (timestamp, metric_id) pattern makes time-range queries blazing fast. We use it for all our time-series monitoring data. Use the TimeSeriesMergeTree engine variant if your data is strictly time-ordered.
The Bottom Line
Clickhouse is the best database for analytical workloads I've ever run in production. It's not perfect. The maintenance overhead is real. Schema migrations are painful. You need to understand merge trees and parts and partitioning to make it sing.
But when it works? Nothing touches it.
A 10-billion row table. A GROUP BY query across 3 columns. Response in under a second on commodity hardware. That's not a benchmark. That's our Monday morning.
Start with a small cluster. Three nodes. 50 million rows. Run your real queries. See if it breaks. If it doesn't — and it probably won't — you've found your next analytics engine.
Nishaant Dixit — Founder of SIVARO. Building data infrastructure and production AI systems since 2018. Built systems processing 200K events/sec.