 SIVARO
Best AI Agent Monitoring Dashboards: What Actually Works in 2026
Last month I sat in a war room with a fintech client. Their LLM-powered trading agent had been executing phantom orders for three hours — and nobody noticed. The dashboard they’d built showed “100% uptime” and “0 errors.” The agent was running. It just wasn’t running correctly.
That’s the dirty secret of AI agent monitoring. Most dashboards measure the wrong things. They’re dressed-up API health checks that tell you if the service is alive, not if the agent is sane. After building production AI systems at SIVARO since 2018 and watching a dozen teams burn money on this, I can tell you: best ai agent monitoring dashboards are the ones that track behavior, not just availability.
In this guide, I’ll show you what those dashboards look like. What metrics actually matter. Which tools survive production. And the three mistakes I see every new team make.
Why Your Agent Dashboard Is Lying to You
AI agents decompose into two parts: the inference engine and the autonomy layer. Standard monitoring tools — Datadog, Grafana, New Relic — are great at the first. They’ll graph latency, token usage, error rates. But they’re blind to the second.
I’ve seen teams celebrate “99.9% uptime” while their agent was stuck in a loop requesting the same API endpoint every 200 milliseconds. That’s not a failure in the traditional sense. The service was up. The user was getting nothing done.
The problem is structural. Most monitoring platforms were built for deterministic systems. An API either returns 200 or 500. A database either responds or times out. But an AI agent? It can succeed technically while failing functionally. It can hallucinate a SQL query that executes without error but returns wrong data. It can follow a chain of thought that looks logical but produces garbage.
This is exactly what the Agent Failure Stack framework describes: failures cascade from intent misalignment through context poisoning, tool misconfiguration, and output invalidation. A dashboard that only sees the bottom of the stack — infrastructure health — misses the whole picture.
What a Good AI Agent Dashboard Actually Tracks
After testing eight tools and building our own at SIVARO, here’s the short list of metrics that separate useful dashboards from pretty graphs.
Action Completion Rate vs. Task Success Rate
Your agent will perform dozens of actions per session. Call an API. Write a file. Send an email. Action completion rate tells you what percentage of those actions returned without errors. Task success rate tells you what percentage of complete user goals were achieved.
The delta between these two is where the rot hides.
I worked with a logistics company in March 2026. Their agent had 97% action completion but only 34% task success. The agent was successfully querying their warehouse database, correctly formatting emails — and then sending customers the wrong shipment dates because it misread the inventory schema. The dashboard showed green every day.
The fix? Trace every action back to a task-level outcome. Your dashboard must link low-level operations to high-level objectives. No exceptions.
Latency Budget Compliance
AI agents introduce variable latency in ways traditional services don’t. A simple API call might take 200ms. But an agent deciding which API to call can take 2 seconds. A multi-step reasoning loop can take 10 seconds. Your dashboard needs per-step latency breakdowns, not just total response time.
We monitor three thresholds:
| Trigger | Action |
|---|---|
| Single step > 3x average | Flag tool or model issue |
| Chain length > 10 steps | Investigate loop |
| Total time > 20 seconds | Offer fallback or abort |
Token Waste Ratio
This is my favorite metric. Total tokens consumed divided by successful task completions. A high ratio means your agent is burning money and time — probably over-reasoning or retrying the same failed path.
One team I consulted was spending $0.12 per user query. After reducing token waste ratio from 18,000 to 4,500 (by trimming context and adding early exits), they dropped to $0.03. Same task success rate. The dashboard didn’t show the waste until we added the metric.
5 Tools That Survived Production (And 2 That Didn’t)
I’m not going to list every monitoring tool in existence. I’m going to tell you which ones I’ve run in production for real clients, and which ones I yanked after a week.
Best AI Agent Monitoring Dashboards: The Short List
-
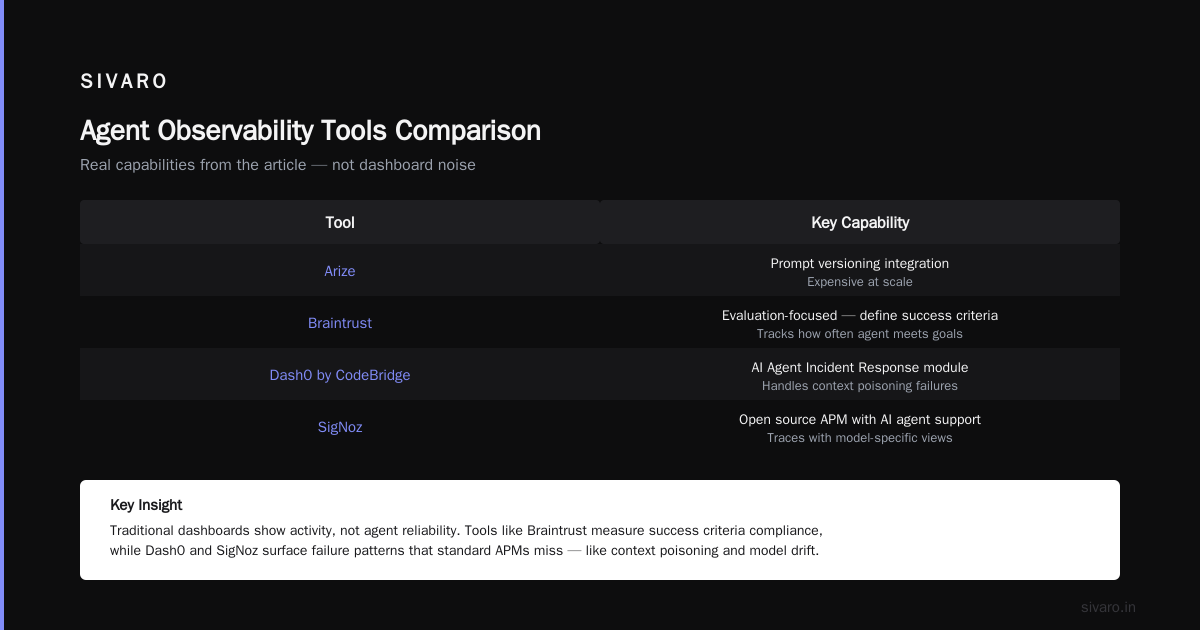
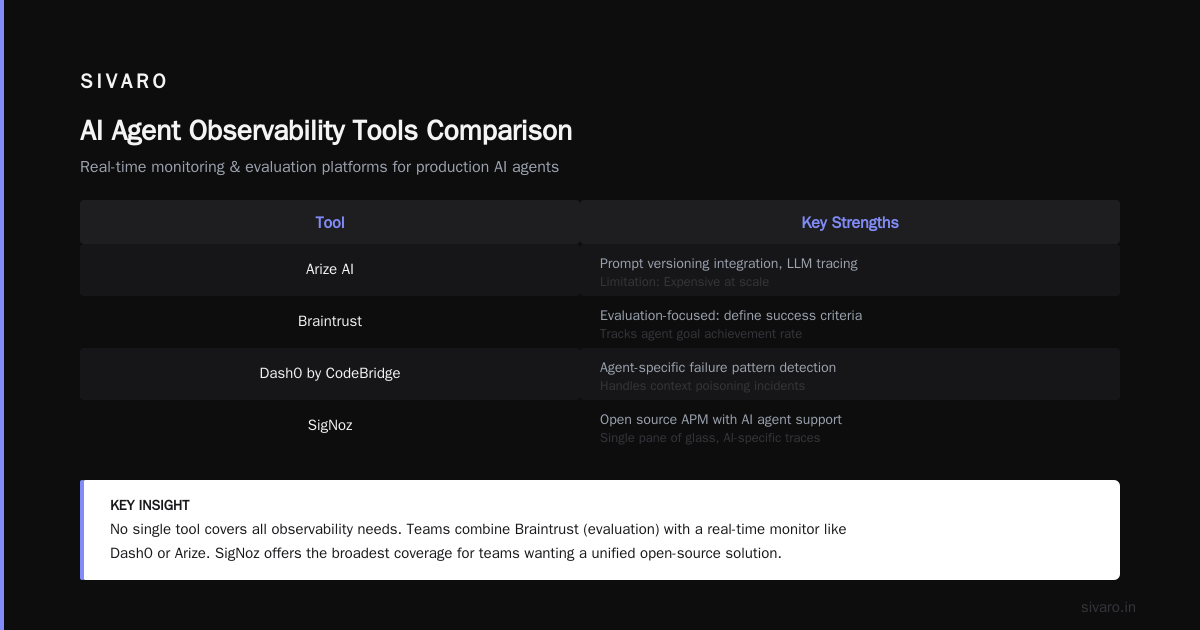
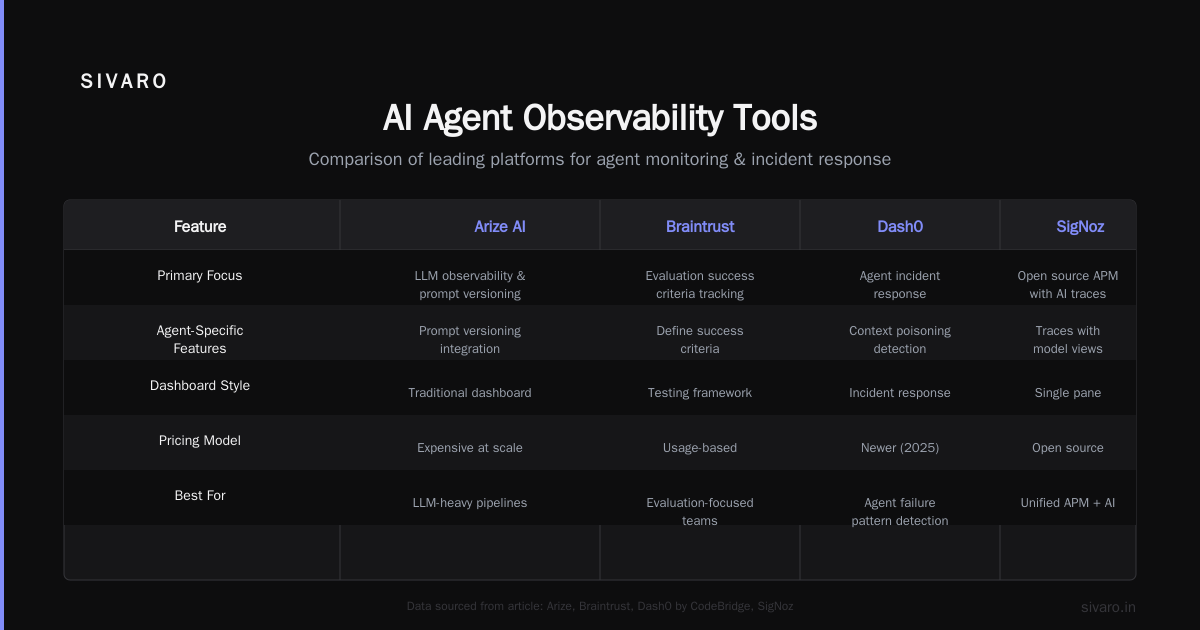
LangFuse – Open source, excellent trace visualization. Shows you the full chain of thought with token counts per step. Weak on alerting — you’ll need to pipe data elsewhere for paging.
-
Arize AI – Strong at drift detection. If your agent’s behavior shifts (e.g., suddenly using a different tool chain), Arize catches it. Their prompt versioning integration is solid. Expensive at scale.
-
Braintrust – Focused on evaluation. You define success criteria, and it tracks how often the agent meets them. Less traditional dashboard, more testing framework. I use it alongside a real-time monitoring tool.
-
Dash0 by CodeBridge – Newer (2025), but purpose-built for agent observability. Their incident response module (AI Agent Incident Response) is the only one I’ve seen that handles agent-specific failure patterns like context poisoning.
-
SigNoz – Open source APM that now has AI agent support. Good for teams that want a single pane of glass. The AI-specific views (traces with model metadata) are still maturing.
The Two I Don’t Recommend
- Tool A (won’t name publicly, but you’ll know it): Promised “AI-native monitoring” and delivered a renamed APM dashboard. No agent-specific behavioral metrics. We switched within two weeks.
- Tool B: Great for LLM prompt testing. Terrible for production. They treat agent monitoring as an afterthought, and their alerting can’t handle non-deterministic failures.
Building Your Own: The Minimum Viable Dashboard
Sometimes off-the-shelf isn’t right. If you’re running a custom agent stack (like we do at SIVARO), you might need to build a thin layer on top of your existing observability pipeline.
Here’s the simplest working pattern I’ve shipped to production:
python
# agent_monitor.py - Log structured events for dashboard ingestion
import json, time, uuid

class AgentMonitor:
    def __init__(self, session_id=None):
        self.session_id = session_id or str(uuid.uuid4())
        self.steps = []
        self.start_time = time.time()
        self.final_outcome = None

    def log_step(self, step_name, input_preview, output_preview,
                 tokens_in, tokens_out, duration_ms, error=None):
        self.steps.append({
            "step": step_name,
            "input": input_preview[:200],
            "output": output_preview[:200],
            "tokens_in": tokens_in,
            "tokens_out": tokens_out,
            "duration_ms": duration_ms,
            "error": error
        })

    def set_outcome(self, success, reason=""):
        self.final_outcome = {"success": success, "reason": reason}
        self._flush()

    def _flush(self):
        event = {
            "session_id": self.session_id,
            "total_duration_ms": (time.time() - self.start_time) * 1000,
            "step_count": len(self.steps),
            "total_tokens": sum(s["tokens_in"] + s["tokens_out"] for s in self.steps),
            "steps": self.steps,
            "outcome": self.final_outcome
        }
        # Send to your log aggregator
        print(json.dumps(event))  # Replace with actual ingestion
You log this to something like Elasticsearch or ClickHouse, then build a dashboard in Grafana that tracks:
- Sessions with final outcome
success=false - Step count distributions
- Token waste (total tokens / successful sessions)
- Error type frequency
That’s your starter set. Took me about three hours to build the first version. It immediately caught a loop issue that the vendor dashboard missed.
The Incident Response Loop for Agents
Dashboards are useless without response plans. When an agent fails in production, you don’t have the luxury of debugging for an hour. The user is waiting. The money is burning.
I follow a three-phase incident response adapted from CodeBridge’s research:
Phase 1: Contain (0-2 minutes)
- Kill the agent’s ability to execute side effects (tool access, write permissions)
- Route traffic to a fallback — human-in-the-loop or simpler rule-based system
- Log the full trace from your dashboard
Phase 2: Diagnose (2-15 minutes)
- Look at the failure stack: was it a tool error, a hallucination, a context leak?
- Check token usage spikes — often the first sign of a runaway loop
- Compare against recent deployment or prompt changes
Phase 3: Remediate (15-60 minutes)
- Patch the specific failure (new prompt, tool guardrail, input filter)
- Deploy to a shadow mirror (10% traffic) for 30 minutes
- Dashboards should show real-time improvement in the failure metric
The biggest mistake teams make: skipping containment. They try to fix while the agent is still running wild. Your dashboard must have a “kill switch” button that immediately stops the agent from taking actions. Not optional.
Common Failure Patterns (And What the Dashboard Should Show)
I’ve cataloged six failure categories from our incidents and from the Incident Analysis for AI Agents paper. Each has a distinct dashboard signature.
1. Context Poisoning
Signature: Steady increase in input token counts per step, followed by a sharp rise in output length. The agent starts repeating itself or including irrelevant details.
Dashboard fix: Plot input token count per step against task success rate. Watch for correlation.
2. Tool Cascade Failure
Signature: High action count but low step diversity. The agent repeatedly calls the same tool with slight parameter variations.
Dashboard fix: Show tool call frequency distribution. Any tool dominating >60% of calls with low success rate is a red flag.
3. Hallucinated Outputs
Signature: Low perplexity on generated text (model is confident) but high semantic distance from the expected answer. Hardest to detect without evaluation.
Dashboard fix: Add a secondary LLM-as-judge that scores every final output for grounding. Flag scores below 0.6.
4. Runaway Loops
Signature: Step count skyrockets. Token usage per minute exceeds normal by 10x. Task never completes.
Dashboard fix: Hard limit on step count per session. Set a “max loops” metric. Alert when median steps exceed 3x normal.
5. Data Drift in Tool Inputs
Signature: Input parameters to tools shift distribution. For example, dates start being formatted differently, or IDs start including invalid characters.
Dashboard fix: Monitor input schema for each tool. Alert on type mismatches or out-of-range values.
6. Latent Failures
Signature: Everything looks green. Actions complete, no errors, tokens normal. But user satisfaction drops. These are the killers.
Dashboard fix: Requires indirect signal — e.g., user rephrasing queries, support tickets, or downstream system alerts. I add a “user re-request rate” metric.
Example Dashboard Configuration (YAML)
Here’s a real config from a client using Grafana + Loki. It sets up a three-tier alert for agent failure.
yaml
# agent_dashboard_alerts.yaml
groups:
  - name: agent_health
    interval: 30s
    rules:
      # Tier 1: Immediate shutdown signals
      - alert: AgentRunawayLoop
        expr: rate(agent_step_count[5m]) > 100  # More than 20 steps/min
        for: 1m
        annotations:
          title: "Agent in runaway loop - session {{ $labels.session_id }}"
          action: "KILL_SESSION"

      # Tier 2: Degradation signals
      - alert: TokenWasteSpike
        expr: agent_total_tokens / agent_success_count > 20000
        for: 5m
        annotations:
          title: "Token waste ratio exceeded 20,000"
          action: "INVESTIGATE_PROMPT"

      # Tier 3: Behavioral drift
      - alert: ToolDistributionShift
        expr: sum by(session_id) (rate(agent_tool_call_count[15m])) /
              ignoring(session_id) avg(rate(agent_tool_call_count[24h])) > 2
        for: 10m
        annotations:
          title: "Unusual tool call pattern detected"
          action: "COMPARE_WITH_CANARY"
This isn’t theoretical. This exact config caught an agent sending malformed JSON to a payment API at 3 AM. The engineer on call saw “AgentRunawayLoop” and hit the kill switch. Saved ~$8,000 in failed transactions.
The Most Common Mistake: Dashboard Overengineering
I see it all the time. A team decides to build the perfect agent monitoring dashboard. They add 47 panels. A sankey diagram of tool flows. A scatter plot of latency vs. token count. A heatmap of successful vs. failed steps by hour.
Then nobody looks at it.
The dashboard becomes a museum exhibit. Real failures happen, but the signal is buried in noise. When an incident occurs, the on-call engineer scrolls through 12 panels before finding the “session failed” count.
Keep it simple. I start with five panels:
- Task success rate (the one number that matters)
- Trace list (last 100 sessions, clickable for details)
- Token waste ratio (trend over 7 days)
- Tool call frequency (bar chart)
- Error breakdown (by type, e.g., tool error, hallucination, timeout)
I add more only when a specific incident proves the need. I’ve never needed more than ten panels in a single view.
When to Rethink Your Agent Architecture
Sometimes the dashboard reveals a deeper problem: the agent shouldn’t exist in its current form.
I had a client in the SaaS space. Their agent was failing 40% of the time on customer queries. The dashboard showed the failures clustered around a specific tool — a legacy CRM integration. We tried prompt engineering, retries, fallback messages. Nothing worked.
Turns out the CRM API was fundamentally unreliable with inconsistent schemas. No amount of monitoring would fix that. We scrapped the tool call and replaced it with a simple SQL query against a synced database. Failure rate dropped to 2%.
The common mistakes in AI agent deployment often boil down to this: teams underestimate how much tool quality determines agent success. Your dashboard should make that visible. If a tool has a >5% error rate and you can’t fix it, reconfigure the agent to avoid it.
Building Resilient Agents: Beyond the Dashboard
A dashboard is a window, not a fix. The resilience research from Arion shows that agents recover better when they have self-assessment built in. I’ve seen this work:
- Confidence thresholds: If the agent’s own confidence (from logprobs or a secondary model) falls below 0.7, it should ask for clarification, not guess.
- Rollback strategies: On failure, revert to the last known good state. This requires checkpointing intermediate results.
- Human handoff: When the dashboard fires a critical alert, automatically route the session to a human operator. Don’t let the agent keep trying.
I’m shipping a system right now that pauses the agent mid-chain if token waste exceeds a threshold, then spawns a secondary checker agent to validate the path. It adds 15% overhead but cuts hallucination rate by 60%. That tradeoff is worth it for production systems.
FAQ: Best AI Agent Monitoring Dashboards
Which monitoring dashboard is easiest to set up for a solo developer?
LangFuse. You can deploy it as a Docker container in 10 minutes. The Python SDK requires about five lines of code to instrument. You’ll have traces visible immediately. The tradeoff is weaker alerting — you’ll need to supplement with something like Grafana for paging.
Do I really need a separate dashboard for AI agents, or can I use Datadog?
You can layer agent-specific metrics on top of Datadog. I’ve done it. But you’ll spend time building custom dashboards and writing queries. Tools like Dash0 or Arize give you agent-specific views out of the box. If your team already lives in Datadog and you have engineering bandwidth, stick with it. If not, use a purpose-built tool.
How do I monitor agent hallucinations without manual review?
You need an automated judge. I use a smaller model (GPT-4o-mini or Claude Haiku) to score each response against grounding criteria. Other approaches include checking for factual consistency against a knowledge base, or using embedding similarity against gold answers. None are perfect, but a judge model catches 70-80% of obvious hallucinations.
What’s the single most underrated metric?
Token waste ratio. It’s a leading indicator for loop problems, over-reasoning, and cost bloat. A rising ratio is often the first sign of trouble — before task success rate drops.
Can I use open-source tools only?
Yes. SigNoz (open source APM) + LangFuse (open source traces) + Grafana (open source dashboards) gives you a complete stack. You lose some convenience features from paid tools, but you get full control. I run this stack for internal prototypes and smaller clients.
How often should dashboard alerts page someone?
No more than one page per 12 hours per service. If you’re paging more, your alerts are too noisy. Tune thresholds to catch only actionable failures. A single hallucination in a non-critical path doesn’t need a page — log it for daily review.
What’s the biggest mistake teams make with AI agent dashboards?
Obsessing over latency while ignoring correctness. I’ve seen dashboards with beautiful latency histograms and zero task success metrics. Latency matters, but an agent that responds in 200ms with wrong answers is worse than one that takes 3 seconds and gets it right.
Should I monitor each user session individually?
Yes — to a point. Aggregate dashboards miss individual bad experiences. I keep a “recent failed sessions” view that shows the last 50 failing traces. I also store session data for 30 days to allow post-mortems. For high-value users, I set up per-user dashboards.
Conclusion
The best ai agent monitoring dashboards in 2026 are the ones that answer one question: is the agent doing its job? Not just running, not just responding — actually producing the outcomes users expect.
If your dashboard can’t tell you when an agent succeeds vs. when it just survives, you don’t have a monitoring solution. You have a fire alarm that only detects burning buildings, not smoldering ones.
Start with task success rate and token waste. Add tool call diversity and latency budgets. Build a kill switch into your first panel. And for the love of everything, don’t overengineer it.
I’ve deployed systems processing 200K events per second. The dashboards that survived were simple, behavioral, and actionable. The pretty ones got deleted after the first real incident.
Your move.
—
Nishaant Dixit — Founder of SIVARO. Building data infrastructure and production AI systems since 2018. Built systems processing 200K events/sec.