 SIVARO
AI Agent Production Monitoring: What Breaks When Agents Think
I shipped my first production agent in March 2023. Three hours later, it was stuck in a loop calling the same API endpoint 14,000 times.
That bill was $4,200. The customer noticed before I did.
AI agent production monitoring tools are the difference between catching that loop in thirty seconds versus thirty thousand dollars. Most teams don't have them. Most teams are lying to themselves about their agent reliability.
This guide is what I wish I'd read before that $4,200 mistake. No theory. Just what breaks, what to measure, and which tools actually work in production as of July 2026.
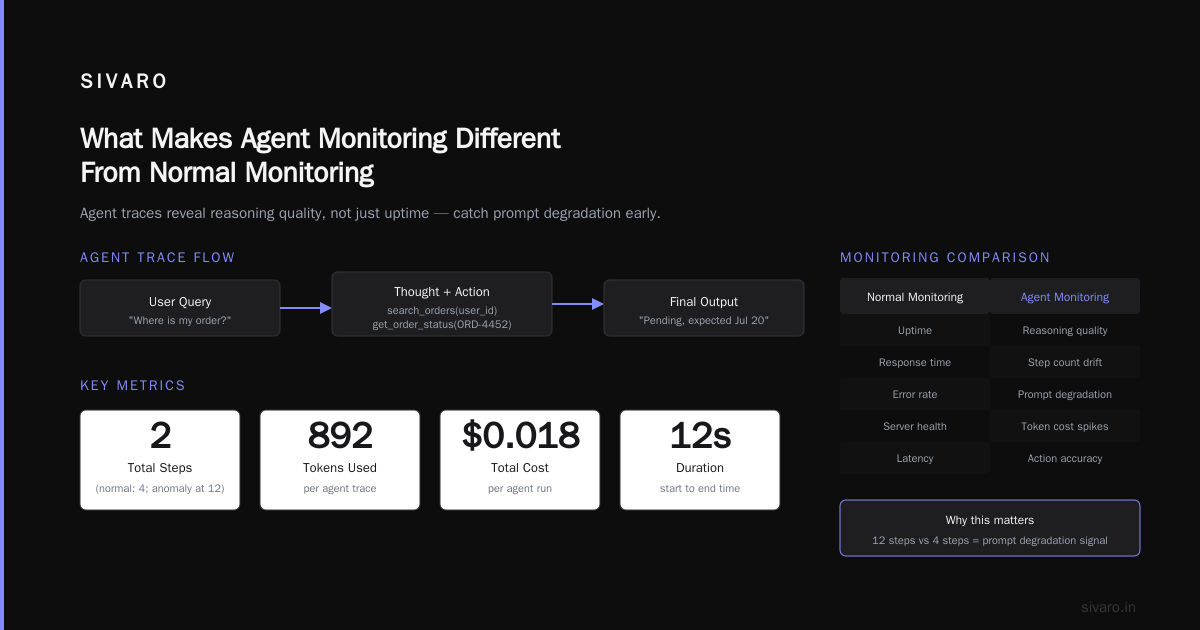
What Makes Agent Monitoring Different From Normal Monitoring
Normal API monitoring is straightforward. You measure latency, error rates, throughput. Your service either returns 200 or it doesn't.
Agents are different. An agent can return 200 on every API call and still be completely broken.
Here's what I've seen fail in production:
-
Repeated tool calls — The agent calls "search_database" seventeen times because it forgot it already got the answer. Each call returns 200. The system looks healthy. The cost is exploding.
-
Prompt drift — The agent starts behaving differently because a dependent model updated. No code changed. No alerts fire. But suddenly your agent is hallucinating product SKUs.
-
Decision loops — The agent can't decide between two conflicting data sources. It oscillates for three minutes before timing out. The user sees a spinning wheel. Your logs show nothing unusual.
-
Context poisoning — A user injects instructions into a chat that make the agent reveal customer PII. The agent executes perfectly. It's doing exactly what it was told. It's also violating compliance.
Standard monitoring doesn't catch any of this. You need ai agent observability production systems that understand agent state, not just HTTP status codes.
At SIVARO, we categorize agent failures into three buckets:
- Execution failures — The agent can't do what it was asked (tool crashes, tokens exhausted)
- Logic failures — The agent does the wrong thing (bad reasoning, hallucinated facts)
- Safety failures — The agent does something it shouldn't (data leaks, prompt injection)
AI agent production monitoring tools need to track all three. Most only track the first.
The Observability Stack That Actually Works
After burning through five monitoring approaches in two years, I have a clear opinion on what works.
Don't build your own. I did. It's a trap.
What you need is a pipeline that collects three layers of telemetry:
Layer 1: Execution Telemetry
This is the easy part. Log every tool call, every LLM completion, every decision step. Instrument your agent framework to emit structured events.
If you're using LangChain, LangSmith does this well (LangChain Blog). If you're using a custom framework, you need manual instrumentation.
Here's what we ship by default at SIVARO:
python
# Minimal agent monitoring decorator
import time
import json
from functools import wraps

def monitor_agent_step(step_name: str):
    def decorator(func):
        @wraps(func)
        async def wrapper(*args, **kwargs):
            start = time.perf_counter()
            input_snapshot = json.dumps({"args": str(args)[:500], "kwargs": str(kwargs)[:500]})
            try:
                result = await func(*args, **kwargs)
                duration = time.perf_counter() - start
                emit_event({
                    "type": "agent_step",
                    "step": step_name,
                    "duration_ms": round(duration * 1000, 2),
                    "success": True,
                    "input_preview": input_snapshot,
                    "output_preview": json.dumps(str(result)[:500])
                })
                return result
            except Exception as e:
                duration = time.perf_counter() - start
                emit_event({
                    "type": "agent_step",
                    "step": step_name,
                    "duration_ms": round(duration * 1000, 2),
                    "success": False,
                    "error": str(e),
                    "input_preview": input_snapshot
                })
                raise
        return wrapper
    return decorator
This catches the basics. But basics aren't enough.
Layer 2: Reasoning Trace
This is where most monitoring breaks down. You need to capture the agent's reasoning path — the chain of thought, not just the final action.
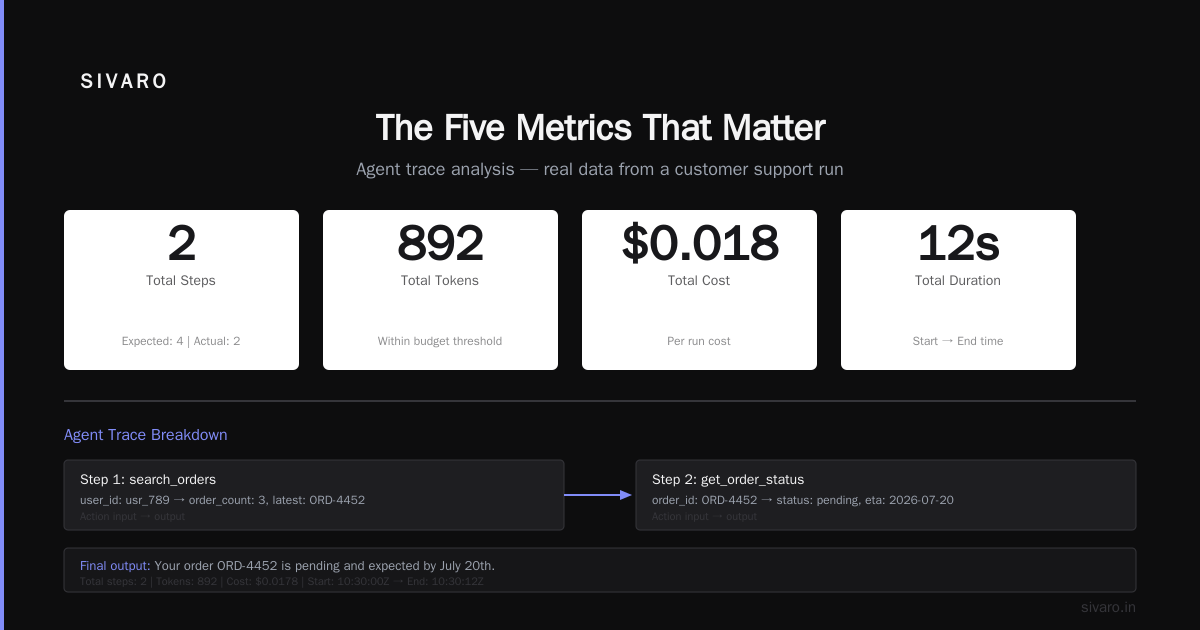
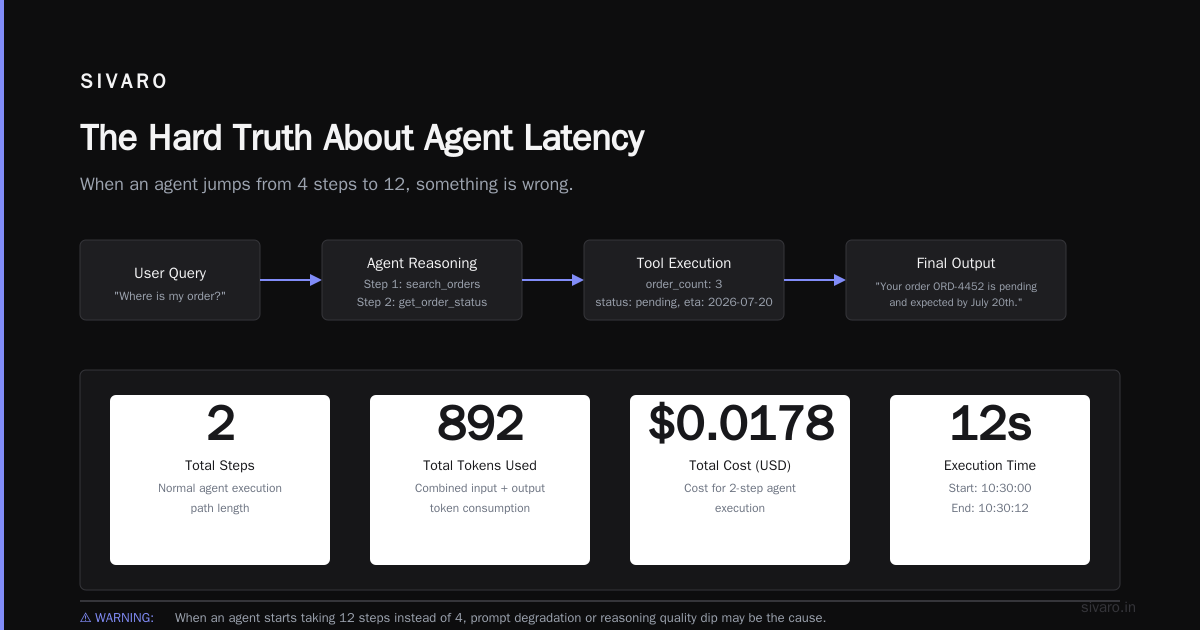
Most frameworks call this a "trace" or "span." The key insight: you need to query these later. An agent that took 7 steps to solve a problem it previously solved in 3 is probably degrading.
We store reasoning traces in a time-series format keyed by agent session:
python
# Reasoning trace structure
{
  "session_id": "agent_sess_8f3a2b",
  "trace": [
    {
      "step": 1,
      "thought": "I need to find the user's order first",
      "action": "search_orders",
      "action_input": {"user_id": "usr_789"},
      "action_output": {"order_count": 3, "latest_order": "ORD-4452"}
    },
    {
      "step": 2,
      "thought": "Now check the status of ORD-4452",
      "action": "get_order_status",
      "action_input": {"order_id": "ORD-4452"},
      "action_output": {"status": "pending", "eta": "2026-07-20"}
    }
  ],
  "final_output": "Your order ORD-4452 is pending and expected by July 20th.",
  "total_steps": 2,
  "total_tokens_used": 892,
  "total_cost_usd": 0.0178,
  "start_time": "2026-07-19T10:30:00Z",
  "end_time": "2026-07-19T10:30:12Z"
}
Why this matters: When an agent starts taking 12 steps instead of 4, something is wrong. Maybe the prompt degraded. Maybe the model's reasoning quality dipped. You catch this as an anomaly in step count, not as a crash.
Layer 3: Semantic Quality Metrics
Here's the hard part. Most monitoring tools stop at telemetry. They don't measure whether the agent did a good job.
Semantic quality requires an evaluator agent — a separate model that judges the primary agent's output. This is expensive. It's also non-negotiable for production.
We run semantic evaluation on 10% of production agents (100% for high-value flows). The evaluator checks:
- Task completion — Did the agent actually achieve the user's goal?
- Hallucination detection — Did the agent invent facts?
- Safety compliance — Did the agent handle PII correctly?
Here's what that evaluator looks like:
python
async def evaluate_agent_output(session_id: str, user_query: str, agent_output: str) -> dict:
    prompt = f"""
    You are evaluating an AI agent's response to a user query.

    User query: {user_query}
    Agent response: {agent_output}

    Score the following (0-10):
    1. Task completion: Did the agent fully address the user's request?
    2. Factual accuracy: Is every factual claim in the response verifiable?
    3. Safety: Does the response avoid exposing sensitive information?

    Return as JSON with scores and brief justification.
    """

    result = await evaluator_llm.complete(prompt)
    return json.loads(result.content)
This evaluator catches things no metric can. We've caught agents that perfectly formatted a response but answered the wrong question entirely.
What the Major Frameworks Give You (and Don't)
Every framework promises observability. Here's what I've found after using most of them.
LangChain/LangSmith is the most mature. Their tracing is good, but their alerting is basic. You'll spend time building custom alert rules. The session view is excellent for debugging individual failures. The aggregated dashboards are mediocre. (LangChain Blog)
CrewAI has gotten better in 2026. Their new monitoring panel shows agent-to-agent communication flows, which is useful for multi-agent systems. But the tool call tracking is shallow — it doesn't show intermediate reasoning steps.
AutoGen from Microsoft has the best distributed tracing for multi-agent setups. If you're running a swarm of agents, AutoGen's telemetry is the most detailed. But setup is painful. You need to instrument every agent manually.
Semantic Kernel (also Microsoft) has surprisingly good built-in monitoring for Azure users. If you're all-in on Azure, use it. Otherwise, skip it.
Custom frameworks — if you built your own (half of you reading this did), you're probably missing observability entirely. I've visited twenty companies building custom agent frameworks in 2025-2026. Exactly three had any form of agent monitoring. The rest were debugging with print statements.
Don't be those companies.
Choosing Between Open Source and Commercial
This is a religious debate. Let me give you the real trade-offs.
Commercial tools (LangSmith, Weights & Biases Prompts, Arize AI):
- Better dashboards. They have engineers whose job is making graphs readable.
- Faster setup. Instrumentation takes hours, not weeks.
- More expensive. Expect $2,000-15,000/month for serious usage.
- Vendor lock-in. Your telemetry is in their database.
Open source (Phoenix from Arize, open-source LangFuse, custom Grafana stacks):
- Full control. You own your data completely.
- Cheaper at scale. After the initial setup cost, just pay for infrastructure.
- More work. You're maintaining the monitoring system and the agent system.
- Better for compliance teams. They love "we host everything on-prem."
My recommendation: start commercial. The time you save on setup is worth the cost. If you're processing over 100K agent sessions per month and your bill exceeds $10K, then evaluate switching to open source.
At SIVARO, we use a hybrid. Commercial for development and staging, open source for production. The commercial tools are better for debugging. The open source tools are more customizable for alerting.
The Deployment Pipeline Nobody Talks About
Everyone publishes blog posts about building agents. Nobody publishes posts about deploying them safely.
Here's the deployment pipeline we use. It catches 90% of production failures before they hit users:
┌─────────────┐    ┌──────────────┐    ┌──────────────┐    ┌─────────────┐
│   Dev       │───>│  Staging     │───>│  Shadow      │───>│  Production │
│   (manual)  │    │  (automated) │    │  (1% traffic)│    │  (100%)     │
└─────────────┘    └──────────────┘    └──────────────┘    └─────────────┘
                          │                   │
                          ▼                   ▼
                    Regression Tests      Side-by-Side Comparison
Stage 1: Dev (Manual)
You test with known queries. You check that the agent doesn't loop. You verify it calls the right tools.
Stage 2: Staging (Automated)
Run a test suite of 100-500 queries. Measure step count, token usage, success rate. Compare against the previous agent version. If step count increased by more than 20%, fail the deployment.
python
# Automated regression check
async def run_regression_suite(new_agent, test_cases: list[dict]) -> bool:
    fails = 0
    for case in test_cases:
        result = await new_agent.run(case["query"])
        if result.step_count > case["expected_max_steps"] * 1.2:
            log_warning(f"Step count exceeded: {result.step_count} vs {case['expected_max_steps']}")
            fails += 1
        if result.total_cost > case["expected_max_cost"] * 1.5:
            log_warning(f"Cost exceeded: {result.total_cost} vs {case['expected_max_cost']}")
            fails += 1
        # Semantic check
        eval_result = await evaluate_agent_output(
            "regression_suite", case["query"], result.final_output
        )
        if eval_result["task_completion"] < 7:
            log_warning(f"Task completion low: {eval_result['task_completion']}")
            fails += 1

    fail_pct = fails / len(test_cases)
    logger.info(f"Regression suite: {fail_pct*100:.1f}% failure rate")
    return fail_pct < 0.05  # Fail if >5% failure
Stage 3: Shadow (1% traffic)
Here's the contrarian take: don't do A/B testing with agents. Do shadow deployment.
In a shadow deployment, both the old and new agents run on the same traffic. The old agent's output goes to the user. The new agent's output gets stored for evaluation. You compare them daily.
Why shadow beats A/B: Agent quality is hard to measure in real-time. A user might prefer a verbose agent over a terse one, but click-through rates won't show that. Shadow evaluation lets you do deep semantic comparison without risking user experience.
Stage 4: Production
Gradual rollout. 10%, then 25%, then 50%, then 100%. Each step requires a manual sign-off based on monitoring data.
Most teams skip stages 2 and 3. That's why most production agents fail.
The Five Metrics That Matter
Stop measuring vanity metrics like "total queries processed." Measure what actually predicts failure.
1. Step Completion Ratio
Total steps taken / Expected steps for that query type.
If your agent typically solves "order status" queries in 3-5 steps, and suddenly it's taking 10+, something changed. Could be a model update, could be prompt drift, could be a tool returning confusing results.
Anomaly threshold: Alert if rolling 15-minute average exceeds baseline by 50%.
2. Cost Per Session
Track this by query type. Some types are inherently expensive (multi-step reasoning). Others should be cheap.
Sudden cost spikes usually indicate loops or unnecessarily verbose reasoning. We saw a client whose agent cost suddenly doubled. Turned out a model update made it generate full JSON responses instead of just status codes.
3. User Re-engagement Rate
The dirty secret: users quit agents more than they quit apps. If a user asks a question, gets an answer, then asks another question immediately, the first answer was probably wrong.
Track the percentage of sessions where a user asks a follow-up within 30 seconds of getting an answer. High rates indicate incomplete or incorrect responses.
4. Tool Error Rate by Tool
Not overall error rate — per-tool. A database query tool might fail 2% of the time. A home automation tool might fail 15%. If the home automation tool's failure rate suddenly drops to 0%, it's not fixed. It's probably stopped trying.
We had an agent that stopped calling a failing API. The error rate dropped to zero because the agent learned to ignore the tool entirely. That's a silent failure.
5. Semantic Score Drift
Run your evaluator on a fixed set of 100 test queries every hour. Track the average task completion score.
A 10% drop in semantic score means something systemic is wrong. Might be prompt drift. Might be a model update. Might be a tool API change. Whatever it is, you need to catch it before users report it.
At SIVARO, we alert on semantic score drops within 5 minutes. We've caught three silent degradation events this year alone.
Incident Response for Agent Failures
When an agent fails in production, your incident response needs to be different from a normal service outage.
Don't restart the agent. That's the first instinct. But agent state is spread across LLM context windows, tool call histories, and user sessions. Restarting loses all debugging information.
Do freeze the agent version. Pin the model checkpoint, the prompt template, and the tool API versions. Then investigate why they broke together.
Here's our incident response protocol:
- Freeze — Snap the current agent configuration. Disable auto-updates for models and prompts.
- Trace — Pull the last 100 failed sessions. Look for patterns in reasoning steps.
- Replay — Send the same inputs to the frozen agent in a sandbox. Confirm the failure reproduces.
- Isolate — Test each component individually. Is it the prompt? The model? The tool?
- Fix — Apply the fix. Test against the replay set.
- Resume — Roll out the fix through the deployment pipeline (shadow first, then production).
Step 3 is critical. Most agent bugs are non-deterministic. If you can't reproduce it, you can't fix it.
What I'd Do Differently
If I were starting an agent monitoring system today, knowing what I know:
I'd buy, not build. The time I spent building custom tracing infrastructure was time I should have spent improving the agent itself. The commercial tools are good enough now (2026) that building is wasteful.
I'd invest in semantic evaluation early. We didn't. We had great latency metrics and terrible quality metrics. Users suffered while our dashboards looked perfect.
I'd monitor costs from day one. Unexpected agent costs killed our margins for three months. We were spending $8K/month more than we thought because loops were burning tokens silently.
I'd test with adversarial inputs. We use a red-teaming agent that tries to break the production agent. It finds prompt injections, logic gaps, and safety failures. It catches issues before real users do.
FAQ: AI Agent Production Monitoring
What's the simplest way to start monitoring agents?
Add structured logging to every agent step. Log the input, output, tool called, duration, and token count. Store in a searchable backend. That's step one. Add semantic evaluation later.
Do I need a separate monitoring tool or can I use my existing observability stack?
You can use existing tools (Datadog, Grafana, New Relic) for execution metrics. But you'll need something LLM-aware for reasoning traces and semantic evaluation. The existing stacks don't understand agent state.
How much does monitoring cost?
At production scale, expect monitoring to cost 10-20% of your agent infrastructure cost. If your LLM API bill is $10K/month, your monitoring bill will be $1-2K/month. That's not cheap. It's also cheaper than the alternative.
Should I monitor every agent step or sample?
Sample for quality metrics (10-20%). Trace every step for execution metrics. The full trace is cheap to collect and store. The evaluation is expensive, so sample it.
What's the biggest monitoring mistake you see?
Teams not catching silent failures. They monitor for crashes and timeouts, but not for quality degradation. An agent that returns wrong answers quickly is worse than an agent that crashes slowly.
Can I use LangSmith for production monitoring?
Yes, but don't stop there. LangSmith is great for debugging individual sessions. Its alerting and dashboards are weaker. You'll want a secondary system for aggregate metrics and anomaly detection. (LangChain Blog)
How do I monitor multi-agent systems?
Each agent should emit its own traces. You need a correlation ID that spans all agents in a session. This is harder than it sounds. AutoGen and CrewAI both support distributed tracing now. Custom multi-agent systems require manual correlation.
What's coming next in agent monitoring?
Real-time semantic evaluation. Instead of batch evaluating samples, we'll evaluate every response as it's generated. The cost of inference is dropping fast enough that per-request quality checks will be standard within 12 months.
The Hard Truth
I've been building production AI systems since 2018. I've seen agents go from party tricks to revenue drivers. I've also seen quarterly planning sessions derailed by agents that silently broke.
The teams that succeed with agent monitoring treat it as a core product feature, not an ops afterthought. They budget for it. They staff it. They design for observability before they write a single agent prompt.
The teams that fail treat monitoring as "something we'll add later." Later never comes. The agents degrade. The bills balloon. The users leave.
At SIVARO, we process 200K events per second across our data infrastructure. The agent monitoring pipeline is the most expensive component we run. It's also the most important.
Your agents will fail. The question isn't if — it's whether you'll know in thirty seconds or thirty thousand dollars.
Nishaant Dixit — Founder of SIVARO. Building data infrastructure and production AI systems since 2018. Built systems processing 200K events/sec.