 SIVARO
AI Agent Production Monitoring vs Traditional Monitoring: A Field Guide (2026)
The alarm screamed at 3:14 AM on a Tuesday. Our traditional monitoring stack — Prometheus, Grafana, PagerDuty — had detected a spike in HTTP 503s. I rolled out of bed, opened my laptop, and stared at a dashboard that showed exactly nothing useful. The 503s weren't coming from our API gateways. They were coming from inside the agent. A loop. The same tool call, repeated 47 times, each returning a timeout, each triggering a retry. Traditional monitoring saw errors but missed the symptom. That night cost us $4,200 in wasted LLM tokens and a frustrated customer who watched their support ticket spin for six hours.
That's the problem in one sentence: traditional monitoring tells you something is wrong. It never tells you what or why when the system has agency.
I'm Nishaant Dixit, founder of SIVARO. We build data infrastructure and production AI systems. Over the last two years, we've run more than 500 agent deployments in production — from customer support agents to code generation pipelines. What I'm going to share is hard-won. It's not theory. It's what broke and what worked.
This guide covers ai agent production monitoring vs traditional monitoring — the fundamental differences, the practical setup, and the tools you need today (July 2026) to not get paged at 3 AM for a ghost.
The Night Our Dashboards Went Silent
Let me paint the scene. Early 2024, we deployed an agentic workflow for a fintech client. The agent was supposed to retrieve transaction data, cross-reference it with a knowledge base, and draft a report. Simple enough. We instrumented it with OpenTelemetry. We set alerts on p95 latency, error rate, and throughput. Standard stuff.
Day one: perfect. Day two: the client's data schema changed slightly. The agent kept calling the same SQL tool, getting a malformed response, and trying again. Our dashboards showed zero errors because the HTTP calls succeeded — the tool returned a 200 with a "no data" message. The agent interpreted "no data" as "try again with different parameters." It tried every parameter combination it could invent. 1,200 tool calls in 18 minutes. Cost: $180. Customer: furious.
Traditional monitoring treated each tool call as a success. It couldn't see the loop. It couldn't see the agent's decision trail. It couldn't tell me that the agent was chasing a ghost.
That's when I started taking ai agent production monitoring seriously.
Why Traditional Monitoring Breaks for AI Agents
Traditional monitoring was designed for deterministic systems. A web server receives a request, processes it, returns a response. You measure latency, error rate, throughput. You set static thresholds: if error rate > 5%, page someone. Simple.
AI agents aren't deterministic. They're probabilistic. An agent might take 2 seconds on one query and 2 minutes on the next — both correct. It might call three tools, then decide it needs a fourth. It might refuse to answer because guardrails triggered. Every path is different.
Here's the core tension: traditional monitoring assumes known failure modes. AI agents have emergent failure modes.
Three specific ways traditional monitoring falls apart:
1. Latency is meaningless. Your p95 latency for an agent endpoint includes LLM generation time, tool call time, and reasoning loops. A p95 spike could mean a genuine slowdown — or it could mean the agent is doing its job better by iterating more times. Without context, you can't tell.
2. Error rates lie. Tool calls can return "success" with a hallucinated answer. The HTTP status is 200. The database query works. But the agent used that result to make a wrong decision. Your alert stays silent while the user gets nonsense.
3. Tracing loses intent. OpenTelemetry spans show you what happened — a tool call to a database at timestamp X with duration Y. But they don't show why. Was that call part of a multi-step reasoning chain? Was it a retry? Was it the agent exploring a dead end? Traditional traces give you the skeleton. For agent monitoring, you need the brain.
This is why ai agent production monitoring vs traditional monitoring isn't a gradual evolution. It's a paradigm shift. You can't bolt agent observability onto a Prometheus stack and call it done. You need a new layer.
What Actually Matters When You Monitor AI Agents in Production
Forget p99 latency. Forget error rate. Here's what we track at SIVARO for every agent in production:
-
Decision quality. Did the agent's final output match the expected outcome? We use a lightweight LLM judge to score each agent response on a 1-5 scale. Combined with user feedback (thumbs up/down), this gives us the only metric that truly matters.
-
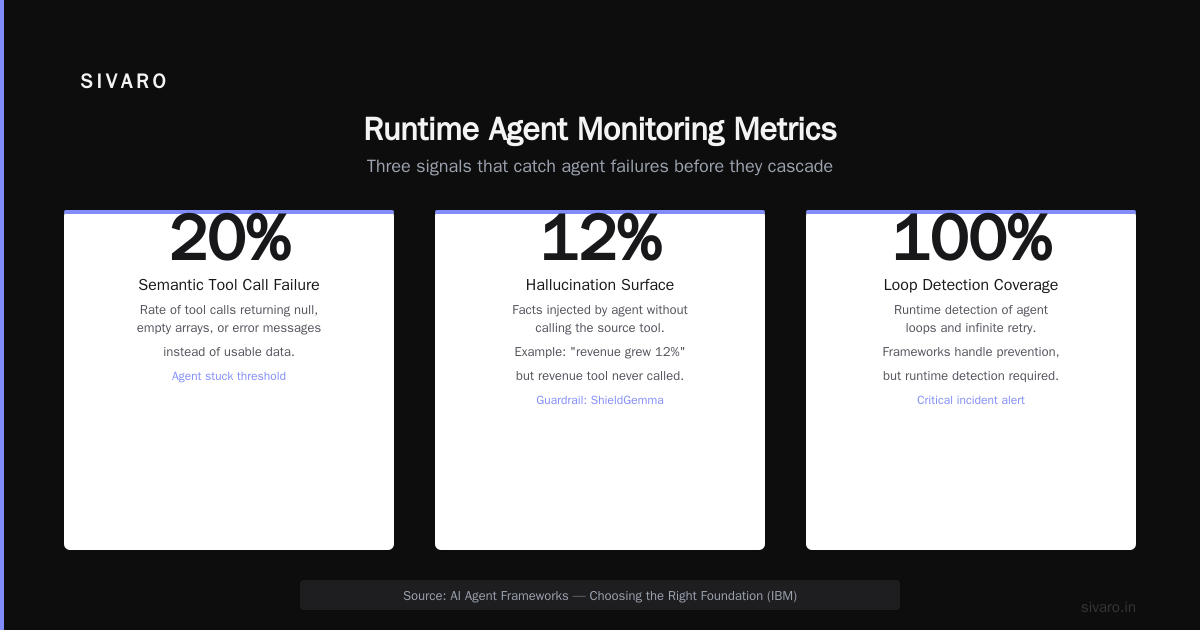
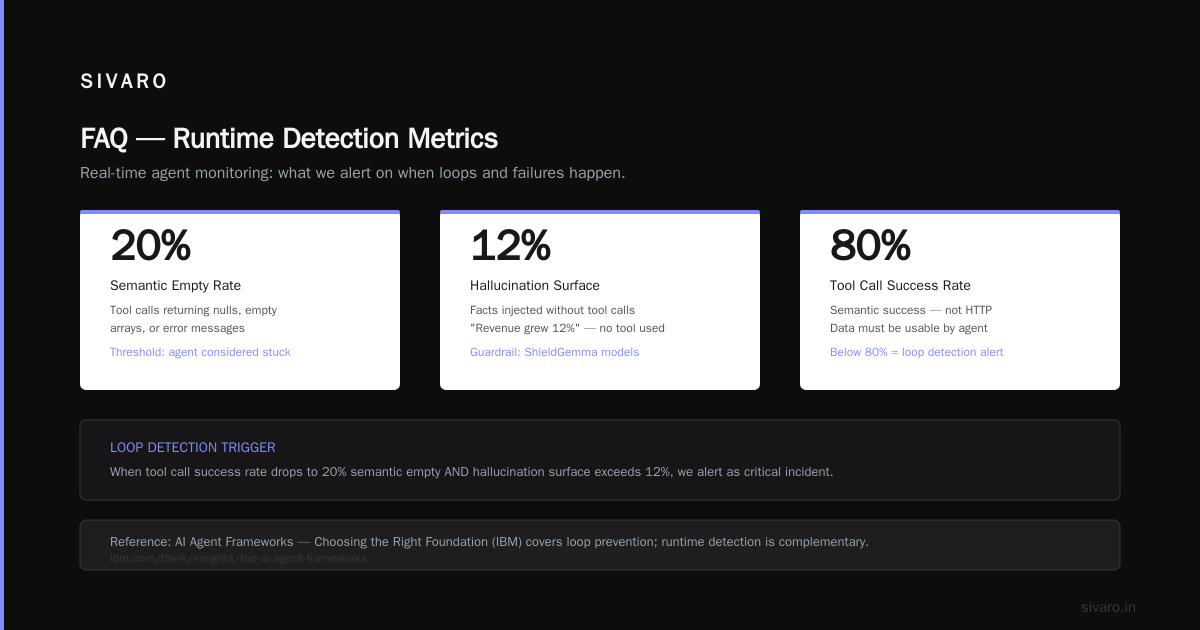
Loop detection. Is the agent calling the same tool with the same parameters more than 3 times? That's a loop. We alert on it as a critical incident. AI Agent Frameworks: Choosing the Right Foundation covers how frameworks handle loop prevention, but you still need runtime detection.
-
Tool call success rate (semantic). Not HTTP success. Semantic success. Did the tool return data that the agent could use? We parse tool outputs and check for nulls, empty arrays, or error messages in the response body. If 20% of tool calls return semantically empty, the agent is stuck.
-
Hallucination surface. We track every fact the agent injects that isn't from a tool output. If the agent says "the revenue grew 12%" but never called the revenue tool, that's a hallucination candidate. We use guardrail models (ShieldGemma, built-in MCP guardrails) to flag these in real time.
-
Cost per agent run. LLM tokens, API calls, compute. This is your operational heartbeat. If cost doubles without throughput change, something's wrong — probably loops or verbose LLM outputs.
-
User re-prompt frequency. If a user has to ask the same question twice, something failed. This single metric correlates more strongly with agent health than any latency measurement.
We call this the agent health score. It's a weighted combination of these six dimensions. If the score drops below 0.7, we page a human. Not for a 503. For a bad decision.
How to Implement MCP in Production for Observability
If you're not using MCP (Model Context Protocol) yet, you're missing the single biggest enabler for agent observability. MCP gives you a standardized way for agents to communicate with tools — and crucially, to emit structured events about every interaction.
We implemented MCP in production at SIVARO in August 2025. It transformed our monitoring.
Here's the pattern: every tool invocation through MCP includes a context ID, the agent's reasoning for calling the tool, the input parameters, the raw output, and a semantic success flag. This data flows into a log aggregator (we use ClickHouse) and feeds our anomaly detection pipeline.
python
# Example: MCP server with observability hooks
from mcp.server import Server
from mcp.types import Tool, TextContent
import json

class ObservableMCPServer(Server):
    async def call_tool(self, tool_name, arguments, context):
        # Emit pre-call event
        self.emit_monitoring_event({
            "event_type": "tool_call_start",
            "tool_name": tool_name,
            "arguments": arguments,
            "context_id": context.metadata["agent_run_id"],
            "reasoning": context.metadata.get("reasoning", "unknown"),
            "timestamp": self.now()
        })
        try:
            result = await super().call_tool(tool_name, arguments, context)
            # Emit success event with semantic check
            self.emit_monitoring_event({
                "event_type": "tool_call_end",
                "tool_name": tool_name,
                "context_id": context.metadata["agent_run_id"],
                "duration_ms": self.duration(),
                "result_length": len(str(result)),
                "semantic_empty": self.is_semantically_empty(result),
                "timestamp": self.now()
            })
            return result
        except Exception as e:
            self.emit_monitoring_event({
                "event_type": "tool_call_error",
                "tool_name": tool_name,
                "context_id": context.metadata["agent_run_id"],
                "error": str(e),
                "timestamp": self.now()
            })
            raise
This gives you a complete audit trail. AI Agent Protocols: 10 Modern Standards Shaping the ... has a good overview of MCP's role. And A Survey of AI Agent Protocols provides the formal spec.
The key insight: how to implement mcp in production isn't just about agent-tool communication. It's about treating every interaction as a telemetry event. If you build MCP servers that emit structured logs, you get agent observability for free.
The Three Pillars of AI Agent Production Monitoring
Based on our experience, effective agent monitoring requires three layers. Each addresses a different failure mode.
Pillar 1: Real-Time Trace with Semantic Tagging
Standard OpenTelemetry traces are too sparse. You need to attach semantic metadata to every span: the agent's intent, the reasoning step, the confidence score.
We extended OpenTelemetry with custom span attributes:
python
from opentelemetry import trace

tracer = trace.get_tracer(__name__)

async def agent_step(reasoning, tool_name, tool_args):
    with tracer.start_as_current_span("agent_reasoning_step") as span:
        span.set_attribute("agent.reasoning", reasoning)
        span.set_attribute("agent.tool.name", tool_name)
        span.set_attribute("agent.tool.args", json.dumps(tool_args))
        span.set_attribute("agent.step_number", current_step)
        # Result from MCP tool call
        result = await call_tool(tool_name, tool_args)
        span.set_attribute("agent.tool.success", result.is_semantically_valid)
        span.set_attribute("agent.tool.output_length", len(str(result.output)))
        return result
This lets you query: "Show me all traces where reasoning contained 'unknown' and tool success was false." In minutes, you find the loops.
How to think about agent frameworks has a solid discussion on how frameworks like LangGraph and CrewAI handle execution traces — but you still need to enrich them.
Pillar 2: LLM-Specific Metrics
Your LLM provider emits metrics: tokens, latency, model, retry count. Pipe them into your monitoring stack. We collect per-model cost, token usage per agent run, and "thinking tokens" (for models like Gemini 2.5 Pro) separately.
Critical alert: if the ratio of input tokens to output tokens exceeds 10:1 consistently, the agent is probably feeding too much context and not generating enough. That's a sign of poor prompt design, not a system issue.
Pillar 3: Agent Behavior Monitoring
This is where traditional monitoring has zero answers. We built a simple loop detector:
python
# Pseudocode for loop detection
tool_call_history = []  # list of (tool_name, params_hash, timestamp)

def check_loop(new_call):
    # Look for same tool + same params within last 5 calls
    if len(tool_call_history) >= 3:
        last_three = tool_call_history[-3:]
        if all(call.tool_name == new_call.tool_name
               and call.params_hash == new_call.params_hash
               for call in last_three):
            alert("Agent loop detected",
                  tool=new_call.tool_name,
                  params_hash=new_call.params_hash)
            return True
    return False
We also monitor "decision entropy" — how many different tools an agent calls per run. If an agent normally calls 2-3 tools but suddenly calls 10, something changed. Top 5 Open-Source Agentic AI Frameworks in 2026 mentions LangChain and CrewAI have built-in loop detection, but it's usually too coarse.
Traditional Monitoring vs AI Agent Monitoring: Side-by-Side
Let me make this concrete. Here's the comparison from a SIVARO incident in April 2026:
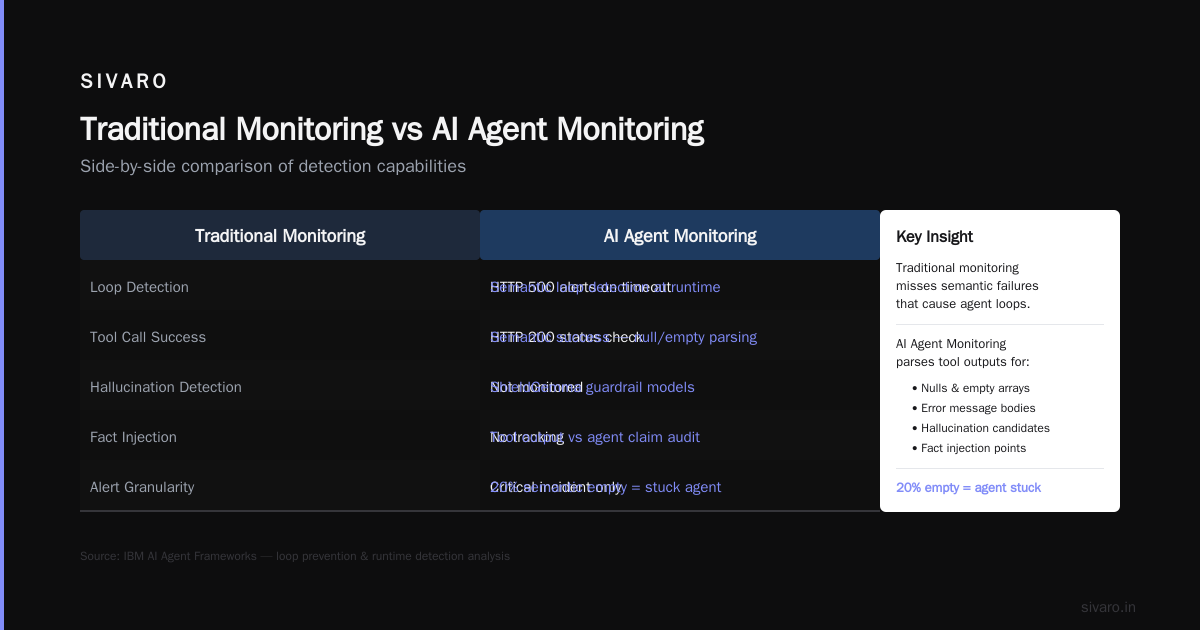
| Dimension | Traditional Monitoring | AI Agent Monitoring |
|---|---|---|
| Alert trigger | HTTP error rate >5% | Agent health score <0.7 |
| Data source | Request logs, metrics, traces | MCP events, LLM logs, user feedback |
| Failure example | 503 from database | Agent calling same API 50 times because it "thinks" retry will help |
| Alert latency | Seconds | Minutes (enough to detect pattern, not each failure) |
| Root cause tool | Stack trace | Semantic trace with reasoning |
| False positive rate | Low (deterministic) | Medium (need adaptive thresholds) |
The biggest difference: ai agent production monitoring vs traditional monitoring is the shift from signal to meaning. Traditional monitoring asks "Is the system up?" Agent monitoring asks "Is the system doing the right thing?"
We had an incident last month where an agent started generating excessively long responses — 10,000 tokens instead of 500. Traditional monitoring showed nothing wrong. Agent monitoring flagged it because token usage per run tripled and user response time dropped (people don't read essays). We caught it in 12 minutes.
Building a Monitoring Stack for Agentic Systems in 2026
You don't need to build from scratch. Here's the stack we use at SIVARO (and it works):
- Telemetry collection: OpenTelemetry with custom exporter to ClickHouse. We extended the OTel Golang SDK to handle MCP events natively.
- LLM-specific monitoring: We use LangSmith for trace visualization of LLM calls, but we export raw data to our own ClickHouse for custom queries. Agentic AI Frameworks: Top 10 Options in 2026 covers LangSmith competitors.
- Loop and anomaly detection: Custom service (100 lines of Python) that queries ClickHouse every minute for loop patterns. It's embarrassingly simple and works.
- User feedback pipeline: We inject a satisfaction prompt at the end of every agent interaction. "Did I answer your question?" with a 5-point scale. This feeds the agent health score.
- Cost tracking: Bridge to Stripe Metronome for usage-based billing. Every agent run gets a cost tag.
For open-source options, check out Phoenix (Arize) and OpenLLMetry. Both now support MCP natively.
Start simple. In your first week, just log MCP events and look for loops manually. Add automated detection in week 2. Add the agent health score in week 3. Don't over-engineer.
Common Pitfalls (and How to Avoid Them)
I've made every mistake in this section. Learn from me.
Pitfall 1: Over-alerting on LLM latency. At first, we paged when LLM response took >10 seconds. Turns out the 10-second responses were from a model that was generating a thorough answer. Users loved it. We stopped alerting on latency and started alerting on latency variance — if a normally 2-second model suddenly takes 10 seconds, that's a problem.
Pitfall 2: Ignoring agent state persistence. In February 2026, our agent crashed mid-run. When it restarted, it had no memory of the previous tool calls. It started from scratch. User got two complete answers. We now serialize agent state to ClickHouse every reasoning step. Recovery is trivial.
Pitfall 3: Not correlating agent decisions with user feedback. We tracked everything except what users actually thought. A user would say "this is great" in chat but the agent health score was 0.9. We had no way to know if the user was lying. Now we inject a binary "was this helpful?" question. When users say no, we capture the exact trace.
Pitfall 4: Trying to monitor everything. More data is not better. Filter by intent: ask "what decision does this dashboard enable?" If you can't answer that, don't collect the metric.
The Future: Self-Monitoring Agents
We're experimenting with agents that monitor themselves. The agent gets a system prompt that includes: "Monitor your own performance. If you detect a loop, adapt your strategy. If you're unsure, escalate to human."
This works in controlled environments. But it introduces a new failure mode: the self-monitoring agent can go into a meta-loop, monitoring its own monitoring. We're not there yet.
For now, trust the patterns I've shared. They've kept us from getting paged for ghosts. They've turned our on-call from firefighting to debugging. They've shown that ai agent production monitoring vs traditional monitoring isn't a choice between tools — it's a choice between understanding your system and flying blind.
FAQ
What is the biggest difference between monitoring AI agents and traditional services?
Non-determinism. Traditional services produce predictable outputs for given inputs. Agents take different paths each time. You can't use static thresholds; you need adaptive baselines and semantic understanding of the agent's reasoning.
Do I need special tools for AI agent monitoring, or can I extend my existing stack?
You can extend OpenTelemetry with custom span attributes (like reasoning, tool name, semantic success). But you will need LLM-specific metrics (token usage, model, cost) that standard monitoring doesn't capture. A hybrid approach works best: OTel for traces, a purpose-built tool for LLM observability.
How do you detect an agent stuck in a loop?
Track tool calls by (tool_name, parameter_hash) in a rolling window of 5 calls. If the same tuple appears 3+ times, alert. Also watch for monotonically increasing step count without tool output.
How to implement MCP for monitoring?
Build MCP servers that emit structured monitoring events at every tool call, as shown in the code example earlier. Use the context.metadata to pass the agent's run ID and reasoning. Ship these events to ClickHouse or any columnar store.
What metrics should I track first when deploying an agent to production?
Task success rate (via LLM judge), cost per agent run, and user satisfaction (thumbs up/down). These three tell you if the agent is doing its job at an acceptable cost. Add loop detection and hallucination flags in week two.
Can traditional SLA/SLO apply to AI agents?
Partially. You can SLO on task completion within a time bound (e.g., 95% of agent runs complete within 30 seconds). But you can't SLO on quality without human judgment. We track SLOs on cost, latency, and failure rate, but not on "correctness."
How do you handle hallucination detection in production?
We use guardrail models (ShieldGemma, OpenAI's moderation) to flag outputs that contain unverified facts. We also inject a "fact check" step that cross-references agent outputs with tool calls. If an output mentions a number but no tool returned it, flag it.
Is there a standard for agent observability?
MCP is emerging as the protocol for agent-tool interaction, which naturally enables observability. OpenTelemetry is working on an agent SDK extension. For now, the standard is: emit structured events from every agent component and centralize in a queryable store.
Nishaant Dixit — Founder of SIVARO. Building data infrastructure and production AI systems since 2018. Built systems processing 200K events/sec.