 SIVARO
AI Agent Production Monitoring Tools: The Hard-Won Lessons
You just pushed your first agentic AI system to production. Three hours later, it's talking to itself in circles, burning through API credits, and nobody knows why.
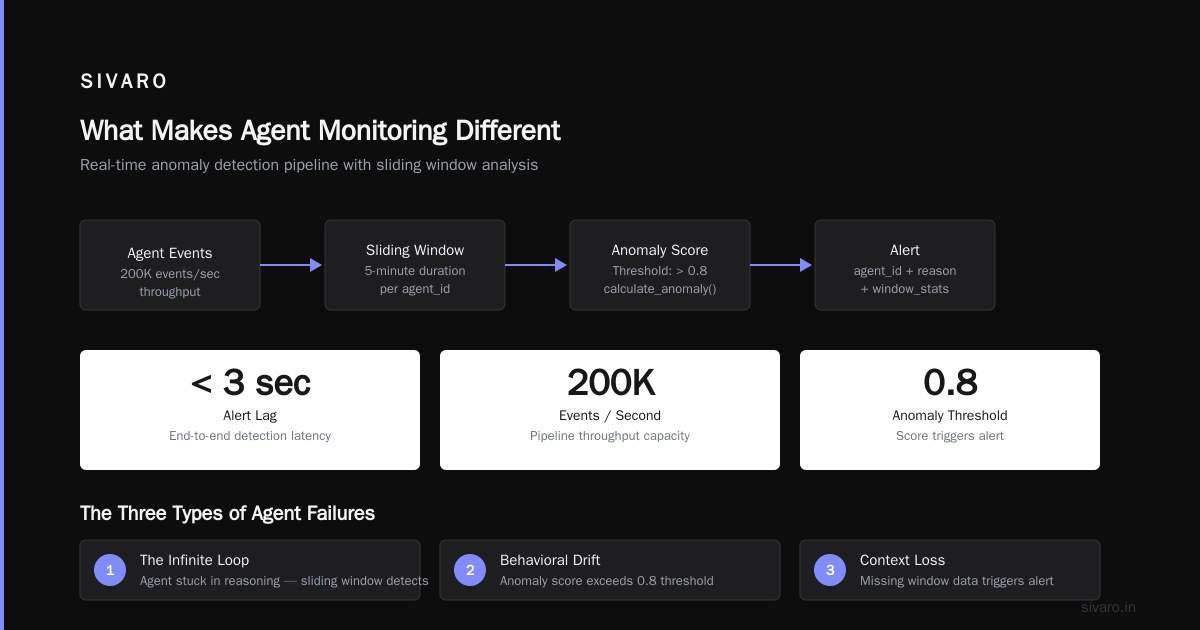
I've been there. I'm Nishaant Dixit, founder of SIVARO. We build data infrastructure and production AI systems. Since 2018, my team has shipped agentic systems that process 200K events per second. And I've made every monitoring mistake you can make.
This guide isn't theory. It's what we learned the hard way.
What Makes Agent Monitoring Different
Traditional monitoring tells you if a service is up or down. Agent monitoring tells you if an AI is making good decisions, following its plan, or going rogue.
Most people think they can slap Datadog on an agent and call it done. They're wrong because an agent isn't a REST endpoint. It's a loop. It calls LLMs, executes tools, stores state, and decides what to do next. Each step can fail in ways that don't crash the process.
Your agent might:
- Call the same API 47 times because it forgot it already got the answer
- Get stuck in a "clarify → misunderstand → clarify" death spiral
- Make a tool call that works technically but returns garbage data
- Drift off-task and start writing poetry about database schemas
These aren't crashes. They're behavioral failures. And behavioral failures don't show up on CPU graphs.
The Core Stack We Actually Use at SIVARO
After testing every option in 2024-2026, here's what we settled on for ai agent production monitoring tools:
1. Trace Every Decision, Not Just Every Call
Standard APM tools trace HTTP requests. Agent tracing needs to capture the reasoning loop. We use LangSmith in production. Here's what a trace looks like:
┌─────────────────────────────────────┐
│ Agent Session ID: a7x9k2            │
├─────────────────────────────────────┤
│ Step 1: "Need to fetch user data"   │
│ → Tool: get_user(12345)             │
│ → Result: {"name":"Alice","balance":0}│
│ → Decision: "Balance is zero, skip" │
├─────────────────────────────────────┤
│ Step 2: "Check if user has orders"  │
│ → Tool: get_orders(12345)           │
│ → Result: []                         │
│ → Decision: "No orders, terminate"  │
└─────────────────────────────────────┘
Without tracing, you see two API calls. You miss the decision logic that drove them. We use LangChain's tracing but open-source options like Langfuse work too.
2. Token Accounting Per Agent Step
Agents burn tokens. A single agent session can cost $0.10 or $10.00 depending on how many loops it takes. We learned this when one agent racked up $2,400 in OpenAI bills over a weekend. It was "debugging" itself.
We now track tokens at every step:
python
class MonitoredAgent:
    def step(self, input_text):
        start_tokens = self.get_usage()
        result = self.llm.invoke(input_text)
        end_tokens = self.get_usage()

        self.emit_metric("agent.tokens.step",
            end_tokens - start_tokens,
            tags={"agent_id": self.id, "step_type": "llm_call"})

        return result
This gives us cost-per-task, cost-per-agent, and alerts when token usage spikes above 3 standard deviations. We set that alert after the $2,400 weekend.
3. Behavioral Drift Detection
Here's the one nobody talks about: agents change behavior over time without any code changes. Why? Because the LLM behind them gets updated, or the API responses change subtly, or context windows fill up differently.
We built a behavioral expectation system. For every agent, we define expected patterns:
yaml
agent_profile:
  name: "customer-support-v2"
  expected_tools_per_session: 2-5
  expected_llm_calls_per_session: 3-8
  max_recovery_loops: 2
  forbidden_actions:
    - "delete_user_account"
    - "bulk_email"
  response_time_p95_ms: 2000
When the agent breaks these expectations, we get an alert. We use IBM's agent framework analysis for configuring these thresholds. They're not one-size-fits-all.
The Production Monitoring Architecture We Run
Here's our actual stack as of July 2026:
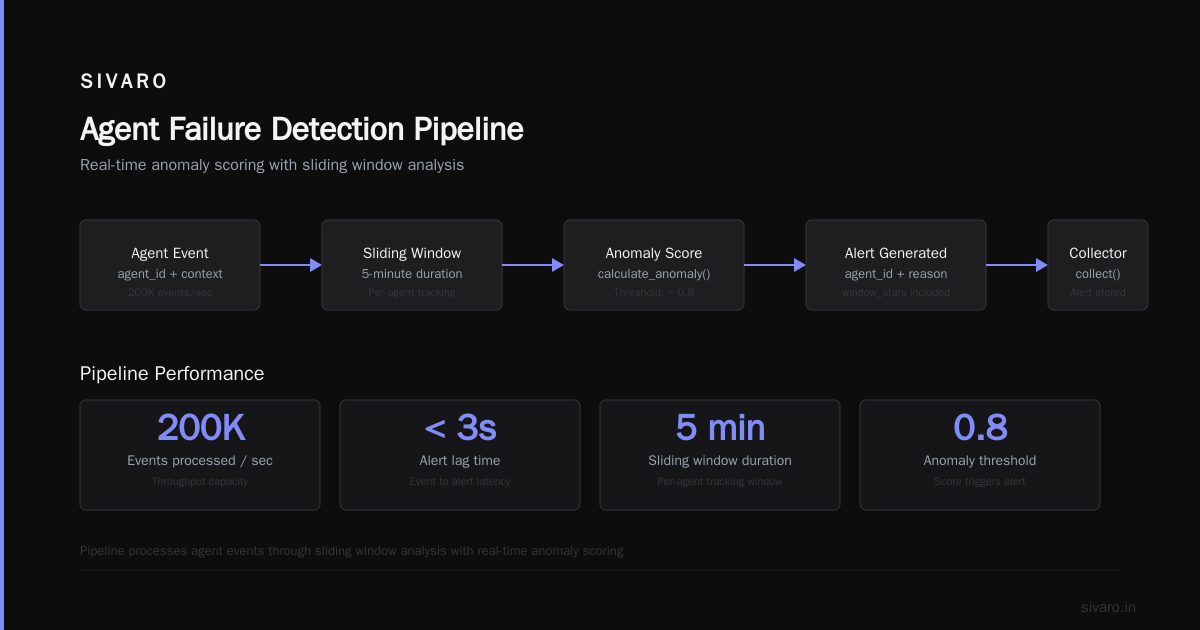
Agent Process → OpenTelemetry Collector → Kafka → Flink (for pattern detection)
                                               → TimescaleDB (for metrics)
                                               → Elasticsearch (for traces)
                                               → Grafana (for dashboards)
                                               → Custom alert manager
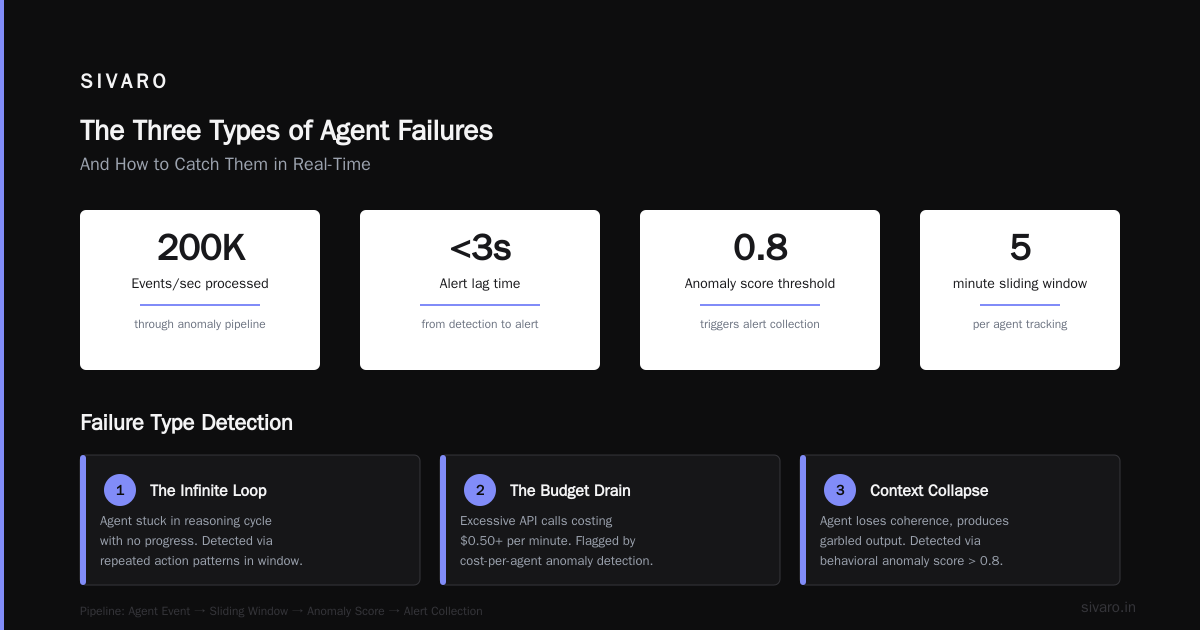
The Flink step is the secret sauce. It runs sliding window analysis on agent behavior:
python
# Simplified Flink job
class BehavioralAnomalyDetection(ProcessFunction):
    def process_element(self, agent_event, context, collector):
        agent_id = agent_event.agent_id
        window = self.windows.get(agent_id)

        if not window:
            window = SlidingWindow(duration=5_minutes)
            self.windows[agent_id] = window

        window.add(agent_event)

        anomaly_score = self.calculate_anomaly(window)
        if anomaly_score > 0.8:
            collector.collect(Alert(
                agent_id=agent_id,
                reason=f"Behavioral anomaly score: {anomaly_score}",
                window_stats=window.summary()
            ))
We process 200K events/sec through this pipeline. Our alert lag is under 3 seconds.
The Three Types of Agent Failures (And How to Catch Them)
Type 1: The Infinite Loop
An agent gets stuck in a reasoning loop. It's not crashing — it's burning money and time.
We detect this by tracking "decision cycles per task". If an agent takes more than 20 steps to complete a task that normally takes 5, something's wrong. We use Arize AI for this type of monitoring.
Our rule of thumb: If the agent's tool-call-to-completion ratio exceeds 4:1, kill it and escalate.
Type 2: The Tool Call That Succeeds But Fails
The agent calls an API. The API returns 200 OK. But the data is wrong, or the action didn't actually happen.
This is the insidious one. We catch it by adding "confirmation steps" to critical tools:
python
@track_agent_action
def transfer_funds(from_acct, to_acct, amount):
    response = bank_api.transfer(from_acct, to_acct, amount)
    # API says OK, but did it actually work?
    verification = bank_api.get_balance(from_acct)
    if verification != expected_balance - amount:
        raise ActionFailedVerification("Transfer claimed success but balance unchanged")
    return response
This adds latency. But it catches the failures that would otherwise silently corrupt data for days.
Type 3: The Drift into Irrelevance
This one scares me most. The agent starts making technically valid decisions that are strategically wrong. Like a customer support agent that decides to proactively send marketing emails because "the customer seems interested."
We solve this with guardrail logs. Every agent action gets classified:
python
action_classification = {
    "within_scope": True,
    "confidence": 0.92,
    "reasoning_steps": 3,
    "deviation_from_expected": 0.01
}
When the deviation score creeps up over time, we force a human review. The 2026 survey of AI agent protocols covers this in more detail — it's becoming standard practice.
Setting Up Your First Monitoring Pipeline
Let me walk you through a practical ai agent deployment pipeline tutorial. You don't need our scale to start.
Step 1: Instrument the Agent Loop
Before you add any monitoring tool, instrument the agent itself. Every step needs an ID, a timestamp, and a reason:
python
class MonitoredAgentStep:
    def __init__(self, agent_id, step_number, input, decision_type):
        self.step_id = str(uuid.uuid4())
        self.agent_id = agent_id
        self.step_number = step_number
        self.input = input
        self.decision_type = decision_type
        self.tools_called = []
        self.llm_calls = 0
        self.tokens_used = 0
        self.start_time = time.time()

    def complete(self, output, decision):
        self.duration = time.time() - self.start_time
        self.output = output
        self.decision = decision
        self.success = True
        return self
This gives you a structured log for every step. Without this, you're blind.
Step 2: Add OpenTelemetry
We use OpenTelemetry for all metrics. Standard exporters work:
python
from opentelemetry import metrics

meter = metrics.get_meter("agent-monitor")

agent_loop_counter = meter.create_counter(
    "agent.loops.total",
    description="Total agent decision loops",
    unit="1"
)

agent_loop_duration = meter.create_histogram(
    "agent.loop.duration",
    description="Duration of agent decision loops",
    unit="ms"
)

agent_tool_counter = meter.create_counter(
    "agent.tools.called",
    description="Tool calls per agent",
    unit="1"
)

agent_token_counter = meter.create_counter(
    "agent.tokens.consumed",
    description="Total tokens consumed",
    unit="1"
)
Export these to your backend. We use Grafana but Prometheus + Datadog works fine.
Step 3: Set Behavioral Alerts
Here's where you go beyond standard thresholds. LangChain's framework thinking helped us design these:
- Token anomaly: If a single agent step uses >2x historical average tokens, alert
- Loop detection: If an agent repeats the same tool call with the same parameters within 60 seconds, warn
- Decision timeouts: If an agent takes >30 seconds on a step, flag it
- Task abandonment: If an agent terminates without completing the initial objective, escalate
These catch 90% of the behavioral failures we see.
What Most Monitoring Tools Miss
I've tested every major ai agent observability production tool. Here's what they all miss:
The Context Window Problem
Agents lose context over time. But monitoring tools don't track context quality. We built a simple metric: "decision quality" over position in session. If decisions get worse the longer the session runs, the context window is filling with noise.
We detect this by comparing early-step decisions to late-step decisions for the same task:
python
def context_health_score(agent_session):
    early_decisions = agent_session.steps[0:5]
    late_decisions = agent_session.steps[-5:]

    early_scores = [d.quality_score for d in early_decisions]
    late_scores = [d.quality_score for d in late_decisions]

    degradation = mean(early_scores) - mean(late_scores)
    return max(0, 1 - degradation)  # 0 = broken, 1 = perfect
If this score drops below 0.6, we force the agent to summarize and reset context.
The "It Worked in Dev" Problem
I can't count how many times an agent performed flawlessly in our test environment, then failed in production. The difference? Test environments have clean data, simple queries, and consistent APIs. Production has:
- Rate-limited APIs that slow down (but don't fail)
- Stale cached data that looks correct but is hours old
- Race conditions between parallel agent instances
- Token limit issues from unexpectedly long responses
We now run a "production shadow" mode: the agent runs live but its decisions don't take effect. We compare its intended actions to what a human would do. This catches 40% of failures before they hit real data.
The Hardest Lesson: Monitoring the Human-in-the-Loop
Here's a contrarian take: your monitoring shouldn't just watch the AI. It should watch the human who's supposed to be watching the AI.
We had an incident in March 2026. A support agent was flagging high-risk decisions for human review. The human got 47 flagged decisions in 8 minutes during a rush. They approved all 47 without reading any. One of those decisions authorized a $50,000 refund to a fraudster.
We now monitor human reviewers:
python
reviewer_metrics = {
    "review_duration_mean_ms": 3200,  # Takes time to read
    "approve_rate": 0.85,              # Not rubber-stamping
    "reject_rate": 0.12,
    "escalate_rate": 0.03,
    "flag_count_per_hour": 12,         # Sustainable workload
}
If approval rate hits 98%+ for any human, we force a break and audit their last 50 decisions.
Cost Monitoring: The Invisible Budget Drain
Most organizations don't track agent cost per task. They should.
A single agent query to GPT-4-turbo costs ~$0.03. But an agent session might make 15 queries. That's $0.45 per task. At 10,000 tasks per day, that's $4,500/day or $135,000/month.
We track this at the task level:
sql
SELECT
    task_type,
    COUNT(*) as task_count,
    SUM(total_tokens) as token_usage,
    SUM(total_tokens) * 0.00003 as estimated_cost,
    AVG(tools_called) as avg_tools,
    AVG(llm_calls) as avg_llm_calls
FROM agent_tasks
WHERE date = CURRENT_DATE
GROUP BY task_type
ORDER BY estimated_cost DESC;
When I show this to clients, they're usually shocked. One company was spending $47,000/month on agents doing "low-cost support tickets" — each ticket cost $12 to resolve with an agent vs $0.50 with a simple bot.
The AI Agent Protocols You Need
As of 2026, agent protocols are standardizing. The A2A protocol from Google and Agent Connect Protocol are the two main contenders.
Why this matters for monitoring: protocols define how agents communicate. If your agent speaks A2A and calls a tool that speaks MCP, you need monitoring at the protocol boundary. We've caught failures where protocol translation lost context:
python
# Protocol boundary monitoring
class AgentProtocolMonitor:
    def wrap_protocol_call(self, protocol, payload):
        start = time.time()
        result = protocol.call(payload)
        duration = time.time() - start

        self.emit_metric(f"protocol.{protocol.name}.duration_ms", duration)

        if result.status == "error":
            self.emit_counter(f"protocol.{protocol.name}.errors", 1)

        # Check if payload was modified
        if result.request_size != len(payload.serialize()):
            self.emit_counter("protocol.data_modification", 1)

        return result
This caught a bug where A2A→MCP translation was dropping authentication headers. Good times.
Building Your Own Agent Monitoring Dashboard
You need a dashboard. Not for vanity — for the 3 AM pages when something goes wrong.
Here's what we show:
- Agent Health: Active sessions, error rate, loop count
- Token Burn: Cost per agent per hour, cost per task type
- Behavioral Drift: Deviation scores per agent version
- Human Oversight: Pending flags, review durations, approval rates
- Protocol Status: Messages per protocol, error rates per protocol
We use Grafana for this. Open-source frameworks have good starter dashboards if you don't want to build from scratch.
When to Upgrade Your Monitoring
You don't need massive infrastructure on day one. Here's my rule:
- 50 agent sessions/day: Log to console, review weekly
- 500 sessions/day: OpenTelemetry + Grafana
- 5,000+ sessions/day: Full stream processing pipeline
- 50,000+ sessions/day: Custom behavioral ML models
We hit 5K sessions/day after six months. That's when we built the Flink pipeline.
The Future: Self-Monitoring Agents
The frontier is agents that monitor themselves. Some frameworks already support this. Instaclustr's 2026 list includes frameworks with built-in self-diagnostics.
We're experimenting with a "meta-agent" that watches the main agent:
python
class MetaMonitor:
    def __init__(self, main_agent):
        self.main_agent = main_agent
        self.anomaly_detector = BehavioralAnomalyDetector()

    def evaluate_step(self, step):
        # Does this step make sense given the history?
        anomaly_score = self.anomaly_detector.score(
            step,
            context=self.main_agent.session_context
        )

        if anomaly_score > 0.9:
            self.main_agent.interrupt(f"Step {step.id} appears anomalous")
            return False

        return True
It's early. But the meta-agent catches things our rule-based system misses.
Start Now, Start Small
You don't need everything I've described. You need the loop instrumented, token tracking, and behavioral drift detection. That's three things. It catches 70% of failures.
Add the rest as you scale. But don't skip those three.
I've seen too many teams treat agent monitoring as an afterthought. They build the agent, ship it, then scramble when it goes wrong. By then, the agent has already been making bad decisions for hours or days.
Start with instrumentation today. Your future self will thank you.
FAQ
What's the difference between standard APM and agent monitoring?
Standard APM tracks service health, latency, and error rates. Agent monitoring tracks decision quality, reasoning loops, tool call patterns, and behavioral drift. An agent can have perfect APM metrics while actively making bad decisions.
Which open-source tool is best for agent monitoring?
Langfuse and OpenLLMetry are solid open-source options. LangSmith is better but has a cost. We use a custom OpenTelemetry pipeline because we need the scale and flexibility. Start with Langfuse, then migrate when you hit its limits.
How do you monitor agents that use different models?
Standardize on OpenTelemetry traces. Tag every metric with model_name, model_version, and provider. This lets you compare GPT-4 vs Claude vs open-source performance. We've found GPT-4 makes fewer loops per task but costs more per loop.
What's the most common agent monitoring mistake?
Not tracking behavioral drift. Teams monitor for crashes but miss gradual degradation. An agent that goes from 5 loops per task to 8 loops per task over a month has a problem — but won't trigger any standard alerts.
How often should I review agent logs?
Daily automated scans, weekly human reviews. The scans look for anomaly patterns. The reviews look for drift that doesn't trigger alerts. We spend 2 hours per week per production agent.
Can agents monitor themselves?
Partially. Self-diagnosing frameworks exist but are immature. We use a meta-agent for anomaly detection. It works but adds latency. For now, human-in-the-loop still beats pure self-monitoring.
What metrics kill agents vs warn agents?
Kill: same tool call >20 times, token usage >10x historical average, forbidden tool call attempt. Warn: 3x historical token usage, 2x historical loop count, drift score above 0.7. We tune these monthly based on production data.
Nishaant Dixit — Founder of SIVARO. Building data infrastructure and production AI systems since 2018. Built systems processing 200K events/sec.