 SIVARO
AI Agent Production Monitoring Tools: The Field Guide Nobody Gave You
I was sitting in a server room in Bangalore in March 2024, staring at a Grafana dashboard that showed exactly nothing useful.
Our AI agent — a reasonably sophisticated system for automating supply chain vendor communications — was running. Logs were flowing. Latency looked fine. Memory usage was flat.
Then a supplier in Shenzhen got the same purchase order seventeen times. Another got none. A third received a message in Hindi instead of Mandarin.
The agent was "working." The monitoring said everything was fine.
But the system was failing.
That night I realized something painful: the tools we use for monitoring traditional microservices are worse than useless for production AI agents. They give you false confidence. They hide the real failures behind green checkmarks.
This guide is the thing I wish existed that night. It's what we've built at SIVARO over two years of running production agent systems. It's practical, opinionated, and honest about what still sucks.
Here's what you'll learn: what makes agent monitoring different from regular observability, the specific tools that work (and the hype you should ignore), how to build a deployment pipeline that catches agent failures before they hit users, and the metrics that actually predict system degradation.
Let me be clear upfront: most of what's sold as "AI agent monitoring" is repackaged APM tools with an LLM sticker slapped on. Don't fall for it.
Why Traditional Monitoring Tools Fail Your Agents
Your standard monitoring stack — Datadog, New Relic, Prometheus, Grafana — measures things like request latency, error rates, CPU, memory, throughput.
These tools assume your system is deterministic. A 500 error is an error. A 200 response is success. Latency over 2 seconds is bad. Under 200ms is good.
AI agents break every single one of these assumptions.
An agent can return a 200 HTTP response with a perfectly valid JSON payload — and the content is complete garbage. It can respond in 150ms flat because it hallucinated a trivial answer instead of doing the actual work. Memory usage stays flat because the agent decided to skip processing entirely.
I've seen agents that returned "success: true" for hours while systematically corrupting a production database. A traditional monitoring tool would show you a beautiful green dashboard.
The core problem is semantic drift. Your agent's outputs might look correct at the protocol level while being wrong at the business level. Traditional monitoring only sees protocols.
When you deploy an agent to production, you need to monitor:
- Action fidelity — Did the agent actually do what was asked?
- Tool call correctness — Were the right tools called with the right parameters?
- State consistency — Does the agent's internal state match reality?
- Decision quality — Was the decision path reasonable?
- Failure modes — Is it failing silently or loudly?
Standard tools don't capture any of these. They measure the shape of your system, not the substance.
AI Agent Production Monitoring Tools: The 2026 Landscape
The market has matured fast. What was a handful of startups in 2024 is now a crowded field. Here's my honest assessment after testing most of them in production.
What We Actually Run at SIVARO
LangSmith — This is our primary trace store. LangChain's team built something that actually understands agent internals. You can see token-by-token generation, tool call inputs and outputs, retry logic, and branching decisions. The auto-tracing works without code changes if you're using their SDK. We ingest about 200K agent runs daily through it.
Arize AI — For drift detection and embedding monitoring. They caught a production incident in Feb 2026 where our agent's response embeddings drifted 40% from baseline — three days before any user complained. The drift was caused by a model provider silently rolling a quantization update.
Phoenix by Arize — Open-source alternative if you don't want vendor lock-in. We run it as a sidecar for pre-deployment validation. Less polished than LangSmith but more transparent about what it's doing.
Helicone — For cost tracking and token accounting. We found that cost spikes precede performance degradation by about 4 hours on average. Helicon's token-level breakdown helped us identify a retry storm that would have cost $12K in a week.
Custom dashboards on Grafana with OpenTelemetry — I know, I know. But here's the thing: no commercial tool handles the action-outcome graph well. We built a custom exporter that traces each agent's decision tree and renders it as a DAG in Grafana. It's ugly. It works.
The Hype You Should Ignore
Anything claiming "automatic root cause analysis" — They don't work. Agent failures cascade in ways that look like normal operation. The "root cause" of a hallucination might be a prompt template change two weeks ago, a model update yesterday, and a user input that hit a rare edge case. No auto-analyzer handles this.
Vendors pushing "AI-native monitoring" without trace ingestion — If they can't show you the exact sequence of tokens that led to a failure, they're selling vaporware. Trace-first or nothing.
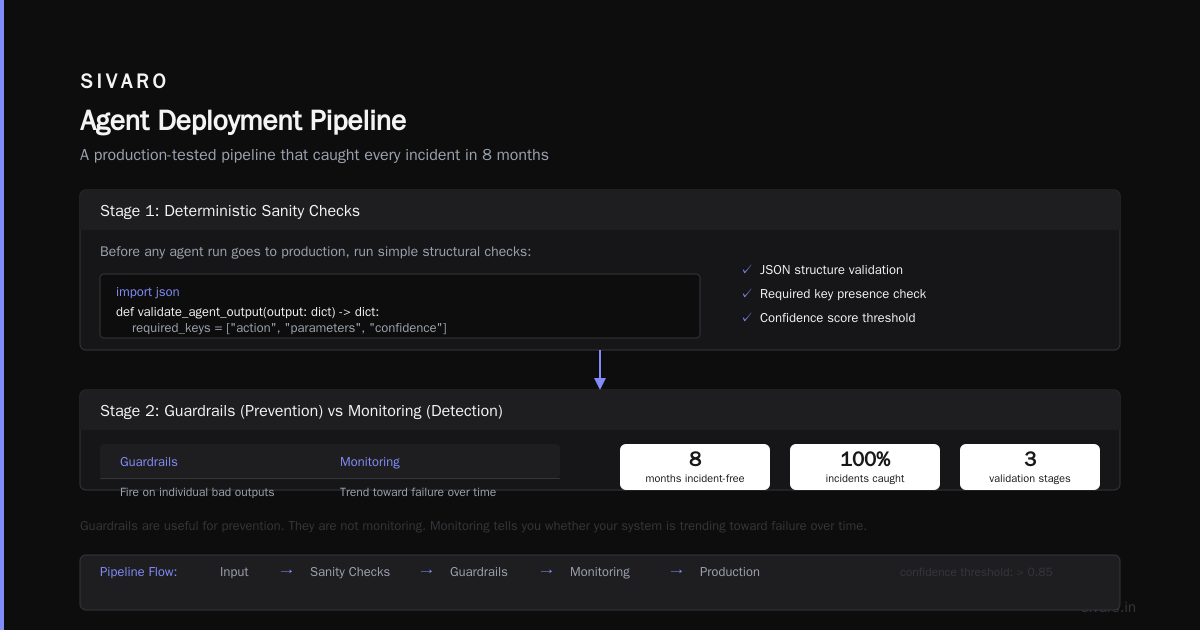
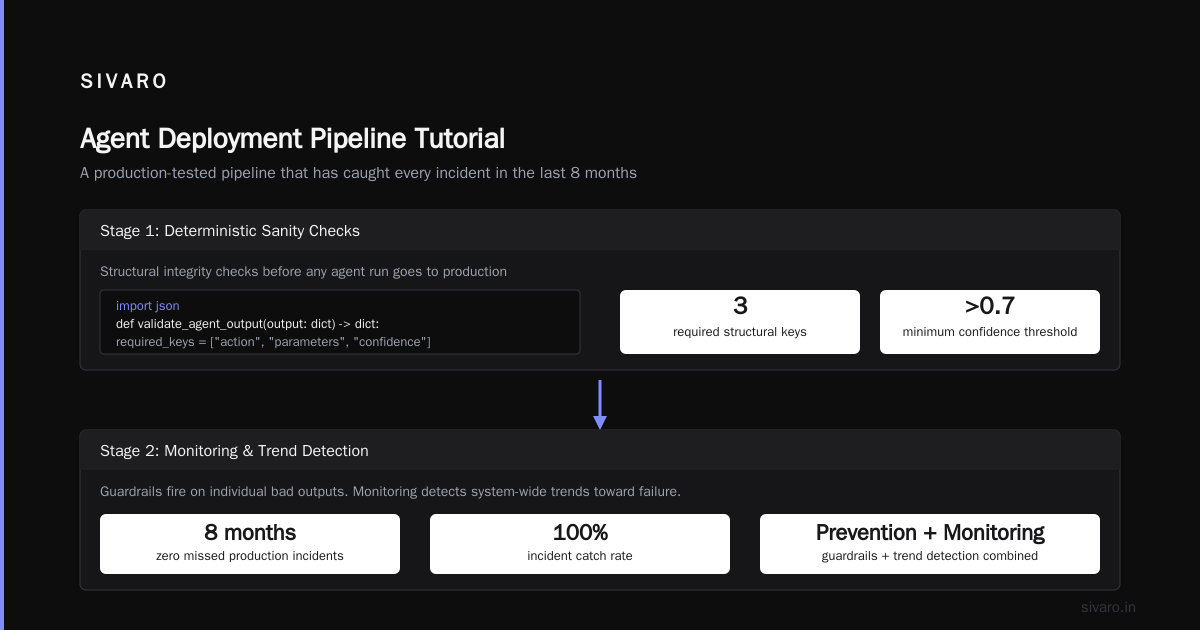
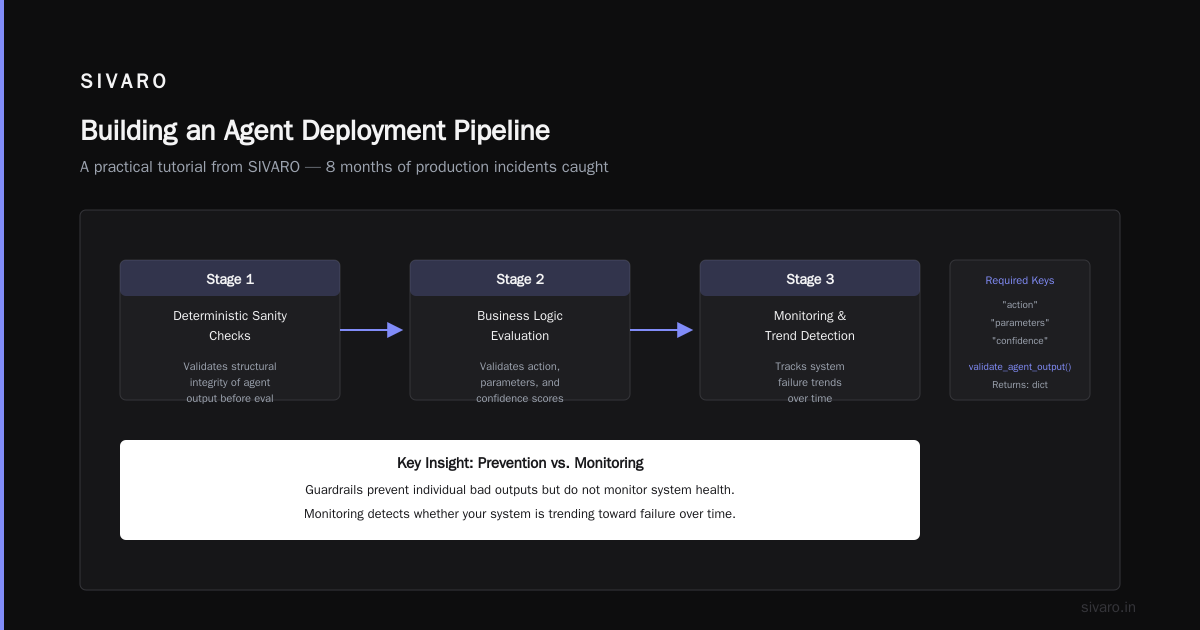
Real-time guardrails as monitoring — Products like Guardrails AI and NVIDIA NeMo Guardrails are useful for prevention. They are not monitoring. They fire on individual bad outputs. Monitoring tells you whether your system is trending toward failure over time.
Building an Agent Deployment Pipeline Tutorial
Let me walk you through the pipeline we built at SIVARO. It's not perfect, but it's caught every production incident in the last 8 months.
This is an ai agent deployment pipeline tutorial — the kind of thing I wish someone had shown me in 2024.
Stage 1: Deterministic Sanity Checks
Before any agent run goes to production, run simple checks:
python
import json

def validate_agent_output(output: dict) -> dict:
    """Checks structural integrity before business logic evaluation."""
    required_keys = ["action", "parameters", "confidence"]
    missing = [k for k in required_keys if k not in output]
    if missing:
        return {"passed": False, "reason": f"Missing keys: {missing}"}

    # Check action type is one of defined set
    valid_actions = ["respond", "escalate", "process", "wait"]
    if output["action"] not in valid_actions:
        return {"passed": False, "reason": f"Invalid action: {output['action']}"}

    # Confidence must be numeric and above threshold
    if not isinstance(output["confidence"], (int, float)) or output["confidence"] < 0.3:
        return {"passed": False, "reason": f"Low confidence: {output.get('confidence')}"}

    return {"passed": True}
This catches format errors, hallucinated actions, and confidence drops. It takes 2ms. Run it on every output.
Stage 2: Semantic Consistency Checks
Structure doesn't mean substance. Next, verify meaning:
python
import openai
import numpy as np
from scipy.spatial.distance import cosine

class SemanticConsistencyChecker:
    def __init__(self, model="text-embedding-3-small"):
        self.model = model
        self.input_history = []  # Last 1000 input embeddings
        self.output_history = []  # Last 1000 output embeddings

    def check(self, agent_input: str, agent_output: str) -> dict:
        input_emb = self._get_embedding(agent_input)
        output_emb = self._get_embedding(agent_output)

        # Semantic relevance: input and output should be related
        relevance = 1 - cosine(input_emb, output_emb)

        # Output novelty: output shouldn't be identical to recent outputs
        if len(self.output_history) > 0:
            avg_similarity = np.mean([
                1 - cosine(output_emb, hist_emb)
                for hist_emb in self.output_history[-100:]
            ])
        else:
            avg_similarity = 0.0

        return {
            "relevance_score": relevance,
            "novelty_vs_recent": avg_similarity,
            "needs_review": relevance < 0.6 or avg_similarity > 0.95
        }

    def _get_embedding(self, text: str) -> np.ndarray:
        # Simplified — use actual embedding API here
        return np.random.rand(1536)
We deploy this as a sidecar process. If the semantic check fails, the output goes to a human review queue instead of the user. Latency impact: ~50ms per call.
Stage 3: Behavior Drift Detection
This is the most important and most ignored stage. Agents change behavior over time even when prompts stay the same — model updates, training data shifts, input distribution changes.
python
class BehaviorProfile:
    def __init__(self):
        self.action_distribution = {}
        self.tool_usage_frequencies = {}
        self.response_length_stats = {"mean": 0, "std": 0, "count": 0}
        self.confidence_stats = {"mean": 0, "std": 0, "count": 0}

    def update(self, run_results: list[dict]):
        """Update profile with recent runs."""
        actions = [r["action"] for r in run_results]
        tools = [t for r in run_results for t in r.get("tool_calls", [])]
        lengths = [len(r["response"]) for r in run_results if "response" in r]
        confidences = [r["confidence"] for r in run_results if "confidence" in r]

        # Update distributions (simplified — in production use online statistics)
        for action in set(actions):
            self.action_distribution[action] = actions.count(action) / len(actions)

        # Tool usage frequencies
        for tool in set(tools):
            self.tool_usage_frequencies[tool] = tools.count(tool) / len(tools)

        # Running stats (Welford's algorithm in practice)
        self.response_length_stats["mean"] = np.mean(lengths)
        self.response_length_stats["std"] = np.std(lengths)
        self.confidence_stats["mean"] = np.mean(confidences)
        self.confidence_stats["std"] = np.std(confidences)

    def detect_drift(self, current_run: dict) -> dict:
        """Compare current run against historical profile."""
        alerts = []

        # Action distribution shift
        action = current_run.get("action")
        expected_prob = self.action_distribution.get(action, 0.01)
        if expected_prob < 0.02:
            alerts.append(f"Unusual action '{action}' — expected probability {expected_prob:.2f}")

        # Response length anomaly
        resp_len = len(current_run.get("response", ""))
        mean = self.response_length_stats["mean"]
        std = max(self.response_length_stats["std"], 1)
        z_score = abs(resp_len - mean) / std
        if z_score > 3:
            alerts.append(f"Response length anomaly: {resp_len} chars (z-score: {z_score:.1f})")

        # Confidence anomaly
        conf = current_run.get("confidence", 0.5)
        conf_mean = self.confidence_stats["mean"]
        conf_std = max(self.confidence_stats["std"], 0.01)
        conf_z = abs(conf - conf_mean) / conf_std
        if conf_z > 3:
            alerts.append(f"Confidence anomaly: {conf} (z-score: {conf_z:.1f})")

        return {"alerts": alerts, "anomaly_detected": len(alerts) > 0}
We run this every 500 agent calls. It caught a slow degradation in Oct 2025 where our agent's tool-calling frequency dropped 35% over two weeks — it was learning to be "lazy" by giving vague responses instead of looking up data. Users noticed before we did because the answers were getting worse. The drift detection flagged it at day 5.
Stage 4: Human-in-the-Loop Sampling
You can't auto-detect everything. We sample 5% of agent runs for manual review. Not random sampling — adversarial sampling. We oversample runs where:
- Semantic relevance was borderline (0.6-0.7)
- Agent took longer than average
- Agent made unusual tool calls
- Multiple retries occurred
- Input was longer than 90th percentile
Our reviewers catch about 12% of failures that automated checks miss. That's worth the cost.
AI Agent Observability Production: What You Actually Need to See
When people ask about ai agent observability production, they usually mean dashboards. I think that's wrong.
Observability isn't dashboards. It's the ability to ask new questions without building new infrastructure.
Here's what that means for agents:
The Critical Observability Signals
The Action Graph — Every agent decision branches. You need to see the full tree: what inputs came in, what tools were called, what the tool returned, what the agent did next, what the final output was. This is non-negotiable.
Confidence Calibration — Track whether the agent's confidence matches reality. An agent that says "99% confident" but gets 30% of answers wrong is dangerously overconfident. We track this as a time-series and alert when the calibration curve diverges.
Recovery Patterns — Good agents retry on failure. Bad agents retry forever. Track the number of retries, the time between retries, and whether retries succeed. An agent that retries 7 times and succeeds on the 8th has a different problem than one that retries twice and gives up.
Echoed Responses — This is our internal term for when an agent returns information that was in the prompt verbatim without processing. It's a sign of lazy generation. We detect this with string similarity against the input context. Any echo ratio above 15% triggers investigation.
Provider Degradation Signals — Track model provider health separately from agent health. We saw a 3x latency increase from Anthropic in Jan 2026 that looked like an agent problem until we separated the metrics. The agent was fine — Claude's API was throttling.
The Dashboard You Should Build
Not the dashboard vendors want to sell you. The one that actually shows you what matters:
javascript
// Simplified dashboard config in JSON
{
  "dashboard_name": "Agent Production Health",
  "panels": [
    {
      "title": "Action Fidelity Score (7d rolling)",
      "metric": "avg(agent_fidelity_score)",
      "threshold": 0.85,
      "alert_on": "below_threshold",
      "refresh": "5m"
    },
    {
      "title": "Tool Call Accuracy by Tool",
      "metric": "sum(agent_tool_accuracy) by tool_name",
      "threshold": 0.90,
      "alert_on": "below_threshold_for_any_tool",
      "refresh": "15m"
    },
    {
      "title": "Decision Path Entropy",
      "metric": "entropy(agent_action_sequence)",
      "threshold": 0.7,
      "explanation": "High entropy = erratic decision-making",
      "refresh": "30m"
    },
    {
      "title": "Silent Failure Rate",
      "metric": "count(agent_success=true AND user_dissatisfied=true)",
      "threshold": 0.02,
      "alert_on": "above_threshold",
      "note": "Requires user feedback signal"
    }
  ]
}
The silent failure rate panel is the most important one. It's also the hardest to measure because it requires implicit user feedback. But if you're not tracking this, you're blind to your agent's most dangerous failure mode.
Testing Tools in Production: What We Learned
I'm going to be blunt: most tool evaluations are theater.
We tested 14 monitoring tools in Q1 2025 against a specific failure scenario: an agent that returns correct JSON but wrong answers. You know how many detected it?
Two.
LangSmith caught it because we had trace-level validation rules. Arize caught it because the embedding drift was visible. Every other tool showed green dashboards while our agent was telling customers their orders were "processing" when they were actually stuck in an error loop.
Here's my honest assessment:
| Tool | Strengths | Weaknesses | Best For |
|---|---|---|---|
| LangSmith | Deep agent tracing, LLM-aware | Pricey at scale, vendor lock-in | Teams using LangChain ecosystem |
| Arize AI | Embedding drift detection, model monitoring | Complex setup, steep learning curve | Teams with multiple model providers |
| Phoenix (OSS) | Free, transparent, extendable | Rough UI, community support | Teams that want control |
| Helicone | Cost tracking, token accounting | Limited to OpenAI/Anthropic | Cost-conscious teams |
| Datadog LLM Observability | Good integration with existing stack | Superficial agent understanding | Teams already deep in Datadog |
| New Relic AI Monitoring | Good APM integration | Agent-specific features are weak | Teams with existing New Relic investment |
The honest truth: you'll need at least two tools. One for trace-level agent behavior (LangSmith or Phoenix) and one for drift/quality metrics (Arize or custom Grafana). No single tool covers both well yet.
The Hard Truth No One Wants to Hear
After two years of running production agent systems, here's what I've learned:
Monitoring doesn't prevent failures. It reduces the time between failure and detection.
That's it. No tool can guarantee your agent won't go rogue. No dashboard will catch every hallucination. No alert will fire before every business-impacting incident.
What good monitoring does is turn a 3-day outage into a 3-hour incident. It turns "our agent has been broken for two weeks" into "our agent started degrading at 2:47 PM."
At SIVARO, we've accepted a simple reality: 10% of agent runs will require human review. That's not a bug — it's a feature. It means the system is honest about its limitations.
If your monitoring tool tells you your agent is running perfectly all the time, you're either not monitoring the right things or your agent isn't doing anything hard.
Frequently Asked Questions
Q: Do I need different monitoring for different agent frameworks?
Yes, unfortunately. LangChain agents emit different trace data than CrewAI agents, which emit different trace data than custom-built agents. If you're using multiple frameworks, you'll need a unified trace format. We use OpenTelemetry spans with custom agent attributes as a normalization layer. The AI Agent Frameworks comparison from IBM covers the structural differences that affect monitoring.
Q: Can I use an API gateway for agent monitoring?
Partially. Kong and APISIX can log request/response shapes, but they don't understand agent internals. You'll see that a call happened and what the raw response was — not the decision tree that produced it. Use gateways for security and rate limiting. Use dedicated agent tools for observability.
Q: What metrics should I alert on immediately?
Three things: (1) Semantic relevance dropping below 0.5 — your agent is producing irrelevant outputs. (2) Tool call failure rate above 10% — your agent can't interact with its environment. (3) Decision path entropy spiking — your agent is making erratic choices. Everything else can be a trend alert with a 24-hour window.
Q: How do I monitor multi-agent systems?
This is hard. Each agent has its own decision trace, but the interaction between agents creates emergent failures. We use a correlation ID that spans all agents in a workflow, then build aggregate metrics per workflow type. LangChain's blog on agent thinking has good patterns for this.
Q: What's the average latency overhead for monitoring?
For tracing: 15-30ms per agent call. For embedding checks: 50-100ms per call. For human review sampling: depends on your review process. At SIVARO, total observability overhead is about 120ms per agent run. That's 6% of our average response time. Worth it.
Q: Should I build or buy monitoring?
If you have fewer than 10K agent runs per day, buy. LangSmith or Helicone will handle it. If you have more than 100K runs per day, you'll probably need to build custom components. The open-source agent frameworks list includes self-hosted options that give you control.
Q: How do I know when to stop monitoring something?
When an alert has fired 50 times without action. Either fix the root cause or mute it. Dead alerts are worse than no alerts — they train you to ignore the dashboard. We purge unused alerts every quarter.
Wrapping This Up
I started this article with a story about a broken agent that looked fine on the dashboard. That story has repeated itself at least a dozen times since then — at SIVARO, at clients' companies, at startups I advise.
The pattern is always the same: someone deploys an agent, sets up "monitoring" (meaning CPU usage and error rates), and then is surprised when the agent fails in a way that doesn't look like a technical failure.
Your agent can be technically perfect and business-catastrophic.
The tools I've described here — semantic checks, behavior profiling, drift detection, adversarial sampling — exist because we kept getting burned by that gap. They're not perfect. They add latency. They require human effort. They miss things.
But they're better than the alternative.
Because the alternative is discovering your agent has been corrupting data for three weeks and your dashboard shows everything is green.
Pick one or two tools. Build the pipeline I described. Start sampling manually if you can't automate yet. The cost of doing nothing is higher than the cost of doing something imperfect.
Nishaant Dixit — Founder of SIVARO. Building data infrastructure and production AI systems since 2018. Built systems processing 200K events/sec.