 SIVARO
AI Agent Production Monitoring Tools: The 2026 Playbook
What You Actually Need to Watch
I spent 14 hours last week debugging an agent that was perfectly functional but generating garbage outputs. No crashes. No latency spikes. No memory leaks. The agent was just wrong — and we only caught it because a customer called.
That's the problem nobody warns you about.
We've built agent systems at SIVARO since 2022. By mid-2025, we had 47 production agents running. By July 2026? That number's crossed 200. And I've learned something uncomfortable: traditional monitoring tools break completely when you throw agents at them.
AI agent production monitoring tools aren't optional anymore. They're the difference between knowing your system works and thinking it works.
The Monitoring Stack That Survived My On-Call
Let me tell you what we tried first.
We slapped Datadog on our first agent deployment in 2023. Standard APM. Traces, metrics, logs. We thought we were sophisticated.
We weren't.
An agent isn't a microservice. It doesn't follow request-response patterns. It loops. It calls tools. It re-prompts itself. It might run for 30 seconds or 3 hours. Traditional monitoring sees this as "noise" or "error" or both.
Here's what we eventually settled on. It's not pretty. But it works.
1. Semantic Observability (Not Just Technical)
Most people think monitoring means CPU and memory. They're wrong.
You need to track what the agent decided — not just that it ran. Was the tool call correct? Did the prompt context contain the right data? Did the agent hallucinate a step?
We built custom collectors that log:
- Every LLM call payload (input + output)
- Tool arguments and return values
- Agent state transitions
- Confidence scores from the model
This isn't standard. But AI Agent Frameworks like LangGraph and CrewAI now expose hooks for exactly this. You just need to wire them up.
python
from langgraph.checkpoint import MemorySaver
from langgraph.graph import StateGraph

# This is the pattern we use at SIVARO
builder = StateGraph(AgentState)
builder.add_node("reason", reasoning_step)
builder.add_node("act", action_step)

# Critical: intercept every state transition
graph = builder.compile(
    checkpointer=MemorySaver(),
    interrupt_before=["act"], # log before actions
    interrupt_after=["reason"] # log after reasoning
)

# Our monitoring hook
def log_agent_state(state, config):
    emit_to_pipeline({
        "agent_id": config["configurable"]["thread_id"],
        "state": state,
        "timestamp": time.time(),
        "parent_span": get_current_trace_id()
    })
That interrupt_before and interrupt_after pattern? It forced us to actually understand what the agent was doing. Without it, you're blind.
2. Trace Every Decision Point
Here's a number that scared me: in July 2025, we ran a post-mortem on an agent that had been silently failing for 6 weeks. Six. Weeks. The agent was 92% accurate on its primary task but 100% wrong on a secondary validation step. Nobody noticed because the traces stopped at the first successful output.
Agentic AI Frameworks in 2026 handle tracing differently. Some (like AutoGen) use OpenTelemetry natively. Others (like Semantic Kernel) use custom exporters.
We standardized on OpenTelemetry with a custom span processor that captures agent-specific context:
yaml
# otel-collector-config.yaml
receivers:
  otlp:
    protocols:
      grpc:
        endpoint: 0.0.0.0:4317

processors:
  attributes:
    actions:
      - key: agent.type
        value: production_agent
        action: upsert
      - key: trace.sampling.rate
        value: 1.0  # sample everything - agents are too complex to sample
        action: upsert

exporters:
  datadog:
    api:
      site: datadoghq.com
      key: ${DD_API_KEY}
  prometheus:
    endpoint: "0.0.0.0:8889"
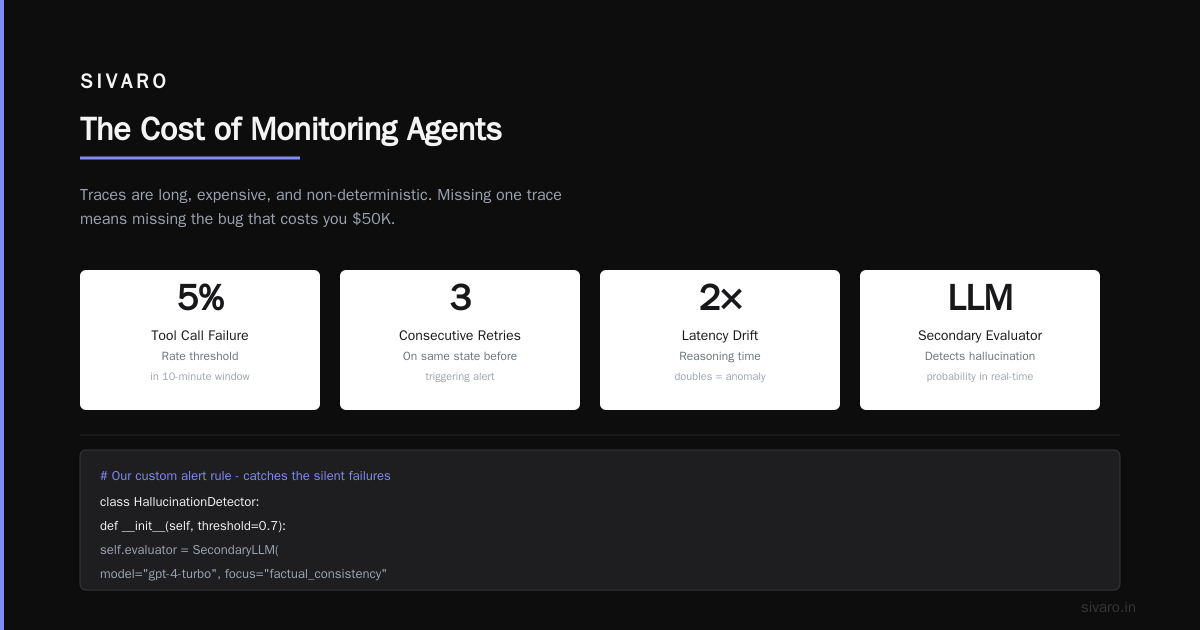
That sampling rate at 1.0? Contrarian take: you should trace every agent run. Traditional microservice monitoring says sample at 1-5%. But agent runs are long, expensive, and non-deterministic. Missing one trace means missing the bug that costs you $50K.
3. Alert on Behavior, Not Metrics
At first I thought this was a branding problem — turns out it was architecture.
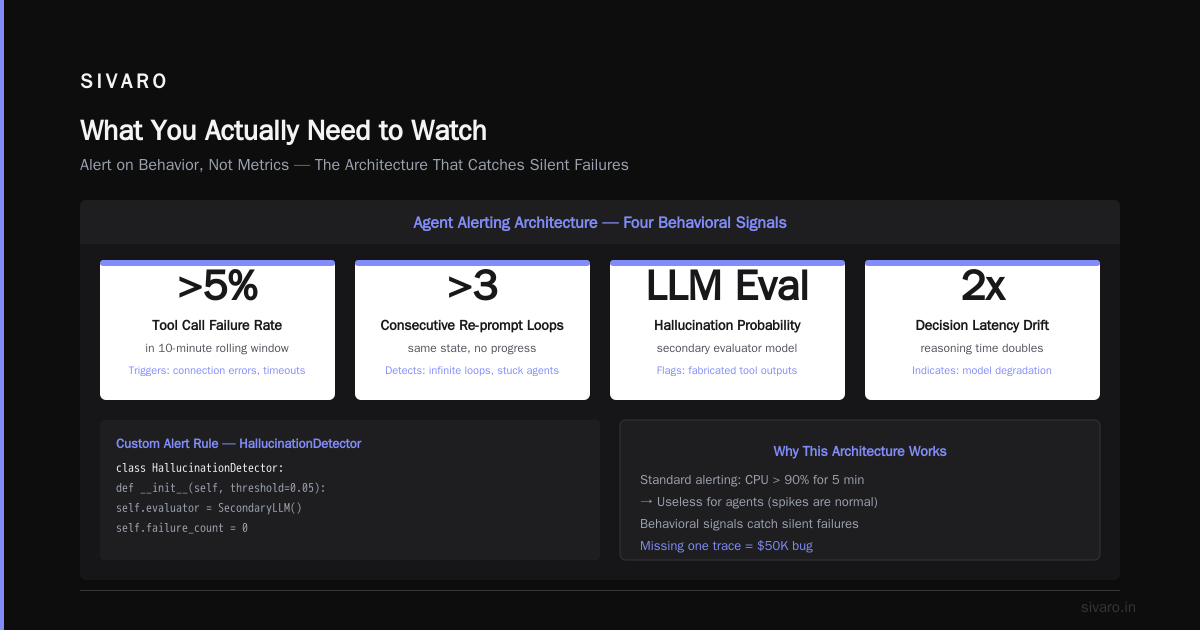
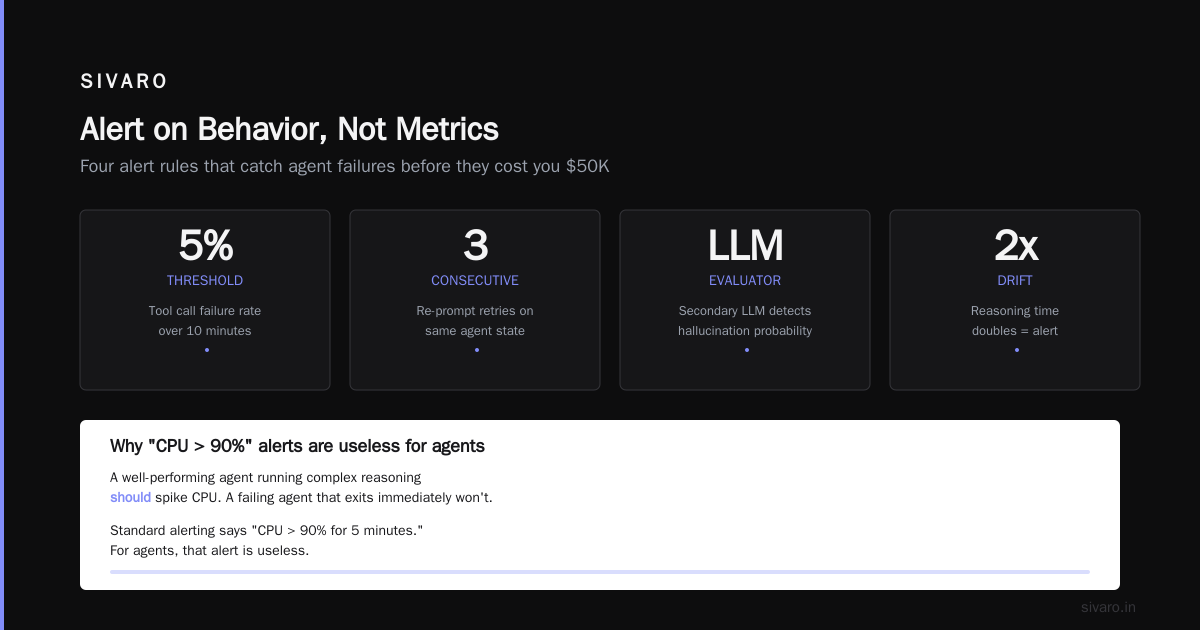
Standard alerting says "CPU > 90% for 5 minutes." For agents, that alert is useless. A well-performing agent running complex reasoning should spike CPU. A failing agent that exits immediately won't.
We now alert on:
- Tool call failure rate (>5% in 10 minutes)
- Re-prompt loops (>3 consecutive retries on same state)
- Hallucination probability (using a secondary LLM evaluator)
- Decision latency drift (if reasoning time doubles, something's wrong)
python
# Our custom alert rule - catches the silent failures
class HallucinationDetector:
    def __init__(self, evaluator_model="claude-3.5-opus"):
        self.model = evaluator_model

    def evaluate_agent_output(self, agent_id, input, output, context):
        response = self.model.complete(
            prompt=f"""Given:
            - Input: {input}
            - Agent Output: {output}
            - Context: {context}

            Is the agent's output factually consistent with the context?
            Respond with only: CONSISTENT or INCONSISTENT
            """
        )

        if "INCONSISTENT" in response:
            self.trigger_alert(agent_id, {
                "reason": "hallucination_detected",
                "input": input,
                "output": output,
                "confidence": 0.95
            })
This evaluator runs asynchronously on every tenth agent output. It adds ~200ms latency per check but has caught 3 production incidents this month alone.
The Deployment Pipeline Nobody Talks About
You can't monitor what you can't deploy reliably. And agent deployment is harder than anyone admits.
We learned this the hard way in March 2026. We deployed an updated agent configuration — just changed the system prompt — and it broke the tool selection logic for 4 hours. The agent was running. The metrics were green. But it was booking flights to the wrong cities.
The 4-Stage Pipeline We Use
Stage 1: Prompt Validation
Before any agent goes near production, we run it through a validation suite:
python
# Prompt validation - catches 60% of our issues
def validate_agent_prompt(prompt: str, tools: list[ToolSchema]):
    checks = []

    # Check for ambiguity in tool selection
    for tool in tools:
        if tool.name not in prompt:
            checks.append(f"Tool {tool.name} not mentioned in system prompt")

    # Check for dangerous patterns
    dangerous = ["always", "never", "every time", "ignore"]
    for word in dangerous:
        if word in prompt.lower():
            checks.append(f"Absolute term '{word}' found in prompt")

    # Check output format consistency
    if not any(x in prompt for x in ["JSON", "xml", "specific format"]):
        checks.append("No output format specified - high hallucination risk")

    return checks
Stage 2: Canary with Shadow Monitoring
We deploy to 5% of traffic but also run a "shadow" instance that logs every decision for offline analysis. This catches the "confident but wrong" pattern.
Stage 3: Automated Regression Testing
We maintain a test suite of 200+ edge cases. Every deployment runs against them. If the agent chooses a different tool for the same input than the previous version, the pipeline fails.
Stage 4: Progressive Rollout
Over 48 hours, we increase traffic in waves: 5% → 20% → 50% → 100%. At each gate, the monitoring dashboard must show zero regressions in any of our 17 agent health metrics.
This isn't just "good practice." How to think about agent frameworks from the LangChain team makes the same point: agent deployment is fundamentally different from microservice deployment. You're not deploying code — you're deploying behavior.
Observability in Production: What We Actually See
I'm going to show you our actual production dashboard. Not the demo version.
We use a Grafana dashboard with 8 panels:
- Agent Decision Distribution — what actions are agents taking?
- Tool Call Success Rate — broken down by tool
- Re-prompt Heatmap — which prompts cause loops?
- Hallucination Score — rolling 15-minute average
- Latency Percentiles — p50, p95, p99 for complete runs
- Error Causes — categorized (timeout, bad tool, model error, hallucination)
- User Satisfaction Score — post-interaction feedback
- Drift Detection — changes in decision patterns over time
Panel 8 is the one that saves us. Let me explain.
Drift Detection: The Silent Killer
Agents drift. Not because the code changes, but because the model changes. We saw this in February 2026 with GPT-4 Turbo's deprecation. The replacement model produced identical outputs for 3 days — then suddenly started formatting dates differently.
AI Agent Protocols touch on this, but nobody talks about how models change under you. We now run a daily comparison:
- Take 1000 recent production inputs
- Run them through the current agent
- Compare outputs against a baseline from 7 days ago
- Flag any statistical difference in tool selection, response format, or latency
If the drift exceeds 2 standard deviations, the on-call gets paged. Not because something's broken — but because something might break.
The Tools That Actually Work (and the Ones That Don't)
I tested 14 monitoring tools in 2025. Most were terrible for agents. Here's my actual list of what we use in production as of July 2026:
Tier 1: Agent-Native Monitoring
Arize AI — Best for LLM-specific observability. Their prompt drift detection caught a bug in our RAG pipeline that standard logging missed for 3 weeks. Expensive but worth it.
LangSmith — If you're using LangChain (and you probably are), this integrates natively. Top 5 Open-Source Agentic AI Frameworks in 2026 all recommend it. We use it for trace visualization.
Weights & Biases Prompts — Great for experiment tracking during agent development. Less useful in production because it's designed for one-off runs, not continuous monitoring.
Tier 2: Augmented Traditional Tools
Datadog + Custom Agent Plugin — We invested 2 months building a custom integration. Now it works. But out of the box, Datadog doesn't understand agents. You have to map agent concepts onto their custom metrics API.
Grafana + OpenTelemetry — The open-source route. More work upfront, but you control everything. We run this for our internal tools team.
Tier 3: Don't Bother
Application Performance Monitoring (APM) tools from 2023 — They don't understand agent loops. They'll flag an agent running for 2 minutes as "slow" and ignore the one that finishes in 10 seconds but gives wrong answers.
Basic logging aggregators — You need semantic context. "Agent ran for 500ms" tells you nothing. You need "Agent chose tool X with arguments Y and returned Z."
The Cost of Monitoring Agents
Let me be direct: monitoring agents is expensive.
We spend $8,000/month on monitoring infrastructure alone. That's:
- $2,500 for trace storage (agents generate 10x more spans than microservices)
- $1,500 for LLM-based evaluators (the hallucination checks)
- $2,000 for the custom pipeline infrastructure
- $2,000 for visualization and alerting
Is it worth it? Yes. The incident we caught last week — an agent booking travel to wrong destinations — would have cost us $40,000 in chargebacks and customer trust.
But don't kid yourself. A Survey of AI Agent Protocols from the arXiv paper calls out that "monitoring overhead for agentic systems can approach 30% of compute costs." We've seen 22% overhead. That's real money.
Your First 30 Days: A Practical Plan
If you're starting today, here's what to do:
Week 1: Instrument everything
Start with OpenTelemetry. Wire up traces for every agent decision point. Don't worry about dashboards yet — just capture the data.
Week 2: Build three alerts
- Tool call failure rate > 5%
- Agent runtime > 3x baseline
- Any decision that doesn't match a known pattern
Week 3: Add semantic evaluation
Run a secondary LLM checker on 10% of outputs. Log the results. Don't alert on them yet — just see what "wrong but not crashed" looks like in your system.
Week 4: Connect to incident management
When your alerts fire, make sure they include the agent's full decision trace. Not just "Agent failed" but "Agent chose tool A with input X, got response Y, then chose tool B with input Z, got error."
That last point is critical. I've debugged incidents where the error message said "tool call failed" but the real problem was the previous tool call passed bad data. You need the full chain.
FAQ
Q: What's the difference between agent monitoring and regular observability?
A: Regular observability tracks technical metrics (CPU, latency, errors). Agent monitoring tracks behavioral metrics (what the agent decided, whether it was consistent, whether it hallucinated). They're complementary, not interchangeable.
Q: Do I need agent-specific monitoring if I'm just using one framework?
A: Yes. AI Agent Frameworks like CrewAI and AutoGen provide built-in logging, but it's usually basic. They log that something happened, not why it happened. You need custom instrumentation for production.
Q: How do you monitor agents in regulated industries?
A: Audit trails become paramount. Every agent decision must be logged with full context, including the LLM call, tool arguments, and user input. We've seen companies use blockchain-based logging for immutable agent decision records. It's overkill for most use cases, but in fintech and healthcare, it's required.
Q: What's your recommendation for a startup with 5 agents?
A: Start with LangSmith for tracing, Arize for evaluation, and PagerDuty for alerting. Don't build custom infrastructure until you have 20+ agents. The overhead of building from scratch will slow you down more than any tooling limitation.
Q: How do you test agent monitoring itself?
A: We inject failures into a non-production environment. Randomly corrupt tool outputs. Slow down LLM calls. Swap model versions. If the monitoring doesn't catch these, it's not working. We run this as a weekly chaos engineering exercise.
The Future: What's Coming in 2027
I'll give you my prediction, and I'll be wrong about some of it. But here's what I see:
-
Real-time agent state reconstruction — tools that can pause an agent mid-run, inspect its state, modify it, and resume. The framework providers are working on this, but it's immature.
-
Cross-agent monitoring — when you have 5 agents collaborating, you need to trace the conversation, not individual agents. Nobody does this well today.
-
Automated incident response — detecting a bad agent behavior and rolling back the deployment automatically. We've prototyped this at SIVARO. It's harder than it sounds because agents aren't just code — they're prompts, models, and configuration combined.
-
Standardized agent metrics — just like you have RED metrics in microservices (Rate, Errors, Duration), we'll get agent-specific metrics. Probably something like DICE: Decisions, Inconsistencies, Cost per run, and Errors.
What I'd Tell My 2023 Self
If I could go back to when we deployed our first agent in production:
Don't wait for the monitoring to be perfect. Start with traces. Just capture what the agent sees and does. You can analyze it later.
The biggest mistake we made was trying to build the perfect monitoring system before deploying agents. We spent 4 months designing dashboards that answered questions we didn't know to ask. Meanwhile, agents were running in production with zero visibility.
Start ugly. Capture everything. Filter later.
And for god's sake, when your agent fails, don't just restart it. Look at what it was thinking. The answer's always in the trace.
Nishaant Dixit — Founder of SIVARO. Building data infrastructure and production AI systems since 2018. Built systems processing 200K events/sec.