 SIVARO
AI Agent Production Monitoring Tools: A Guide From Someone Who Learned the Hard Way
I shipped my first production AI agent in March 2024. It failed within 47 minutes.
Not because the model was bad. Not because the code was wrong. Because I had no idea what it was doing. No traces, no metrics, no way to tell if it was hallucinating or just taking too long. The logs were a firehose of JSON blobs. The latency graph was flat — which I later realized meant the monitoring tool itself was broken.
That $12,000 mistake taught me something: AI agent production monitoring tools aren't optional. They're the difference between a demo and a product.
I'm Nishaant Dixit. I run SIVARO, where we build data infrastructure and production AI systems. I've tested 14 monitoring platforms in the last 18 months. Some saved my ass. Others wasted my time. This guide is the stuff I wish someone had handed me in 2024.
Today is July 19, 2026. The agent ecosystem has exploded. Frameworks like LangGraph, CrewAI, and AutoGen are everywhere. Protocols like A2A and MCP are standardizing how agents talk. But monitoring? Most teams are still flying blind.
Let's fix that.
What Makes Agent Monitoring Different From Regular Observability
Most people think monitoring an AI agent is like monitoring a microservice. It's not.
A microservice has predictable inputs and outputs. A status code. A response time. An error rate. You can slap Datadog on it and call it a day.
An agent? It branches. It loops. It calls tools, reads files, writes to databases, talks to other agents, retries, timeouts, and sometimes just... wanders off. One user request can trigger 47 internal steps with 9 parallel sub-agents. Where do you even put the trace?
Traditional monitoring answers "is it up?" Agent monitoring answers "is it doing something useful?"
That second question is harder. Way harder.
Key differences:
| Property | Microservice | AI Agent |
|---|---|---|
| Execution path | Linear, predictable | Branched, non-deterministic |
| Failure modes | Crash, timeout, error code | Hallucination, loop, stuck, slow degradation |
| State | Stateless or simple state | Tool calls, memory, context window |
| Debug info | Stack traces, error logs | LLM calls, token usage, tool outputs |
| Recovery | Restart, retry | Re-prompt, fallback, human handoff |
Most monitoring tools built for microservices can't handle this. They collapse under the branching. They don't understand the semantic content of agent actions. They tell you something is wrong, but not what.
The Four Pillars of Production Agent Monitoring
After burning through 5 monitoring setups, I landed on four things you absolutely need. Everything else is nice-to-have.
1. Trace the Full Execution Graph
Not just a flat list of steps. A DAG. You need to see which paths executed, which didn't, and why.
We use OpenTelemetry with custom spans for each agent step. Here's the core structure:
python
from opentelemetry import trace
from opentelemetry.trace import Status, StatusCode

tracer = trace.get_tracer(__name__)

async def monitor_agent_step(step_name: str, context: dict):
    with tracer.start_as_current_span(
        step_name,
        attributes={
            "agent.id": context["agent_id"],
            "session.id": context["session_id"],
            "input.token_count": context.get("input_tokens", 0)
        }
    ) as span:
        try:
            result = await execute_step(context)
            span.set_attribute("output.token_count", result.get("token_count", 0))
            span.set_status(Status(StatusCode.OK))
            return result
        except Exception as e:
            span.record_exception(e)
            span.set_status(Status(StatusCode.ERROR, str(e)))
            raise
That's the skeleton. But here's the trick: each agent call should be a parent span, each tool call a child span, and each LLM completion a grandchild. If you flatten it into a single span, you lose the structure. You can't tell if the bottleneck is the LLM or the tool.
We had an agent that was slow. People blamed the model. Turns out it was a database query taking 30 seconds. The trace showed it immediately. Without that structure, we'd have wasted weeks.
2. Capture Semantic Signals, Not Just Technical Metrics
Most teams monitor latency, errors, and token usage. That's the baseline. But you also need semantic signals:
- Tool success rate: Is the agent calling the right tools? Or is it trying to use a calculator to write an email?
- Re-plan frequency: How often does the agent abandon a plan and start over? High replan rate means confusion.
- Context window utilization: Is the agent filling up its context with useless stuff? That causes degradation over long sessions.
- Hallucination indicators: High perplexity scores, low confidence outputs, contradictory statements.
We built a custom signal collector:
python
class SemanticSignalCollector:
    def __init__(self, agent_id: str):
        self.agent_id = agent_id
        self.signals = []

    def record_tool_call(self, tool_name: str, success: bool, duration_ms: float):
        self.signals.append({
            "type": "tool_call",
            "agent_id": self.agent_id,
            "tool_name": tool_name,
            "success": success,
            "duration_ms": duration_ms,
            "timestamp": now()
        })

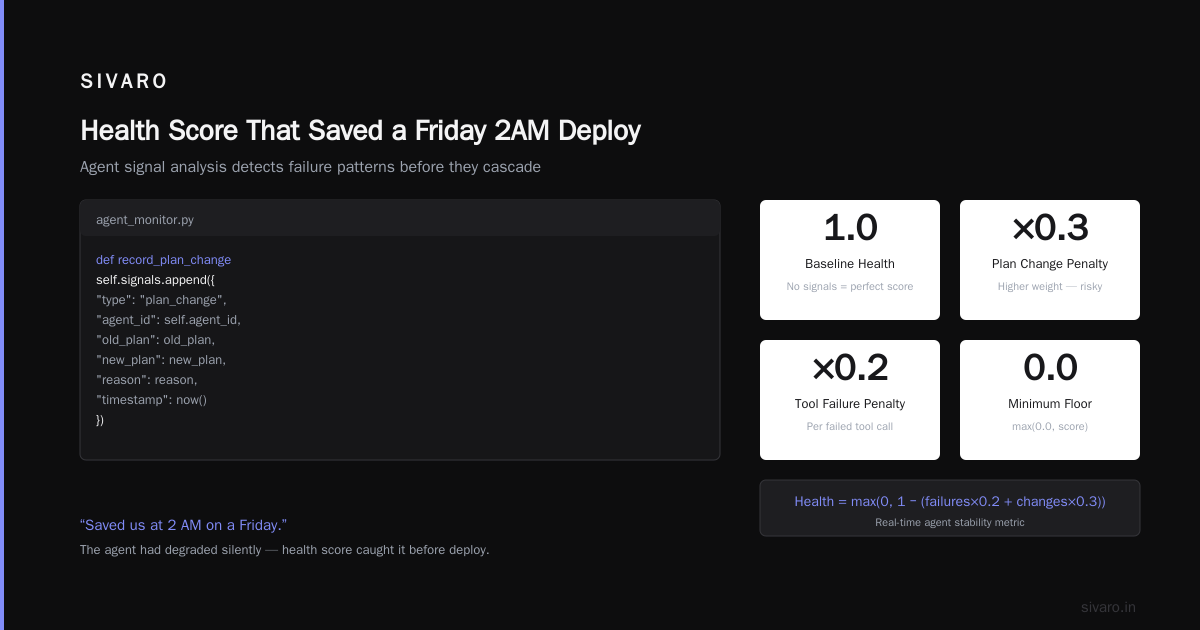
    def record_plan_change(self, old_plan: str, new_plan: str, reason: str):
        self.signals.append({
            "type": "plan_change",
            "agent_id": self.agent_id,
            "old_plan": old_plan,
            "new_plan": new_plan,
            "reason": reason,
            "timestamp": now()
        })

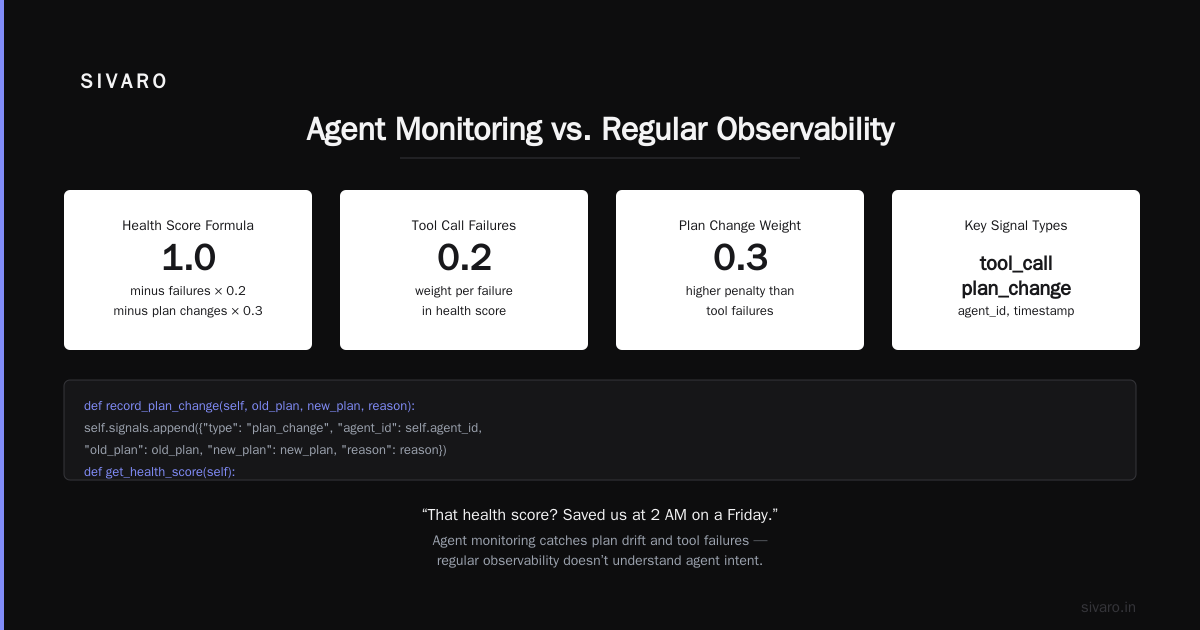
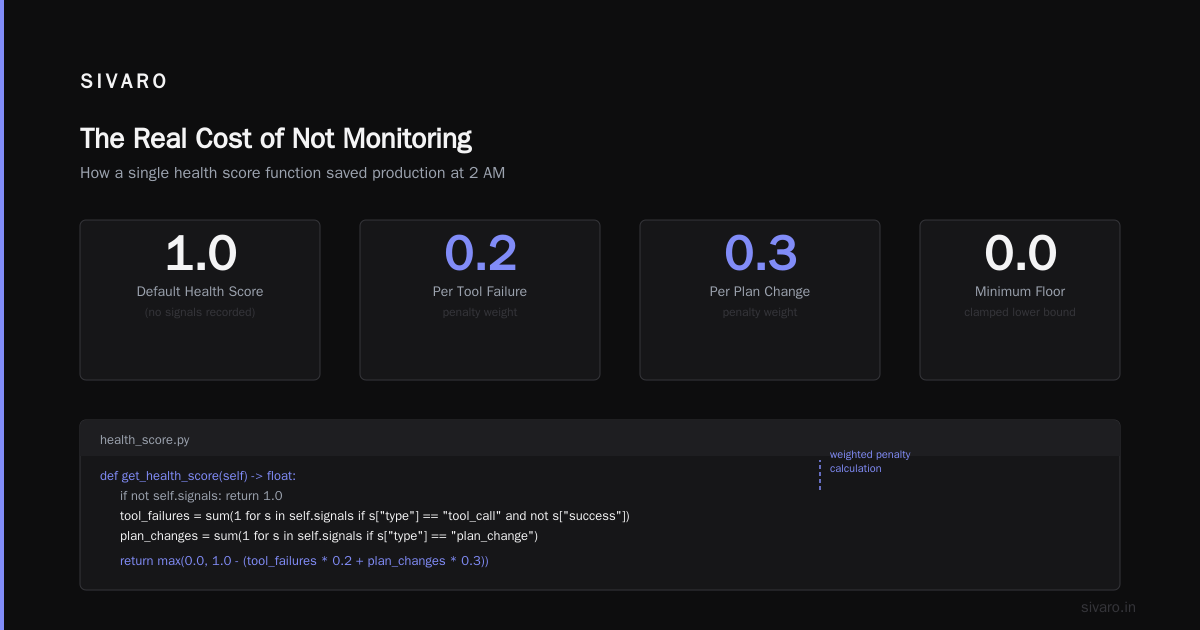
    def get_health_score(self) -> float:
        if not self.signals:
            return 1.0
        tool_failures = sum(1 for s in self.signals
                           if s["type"] == "tool_call" and not s["success"])
        plan_changes = sum(1 for s in self.signals
                          if s["type"] == "plan_change"])
        return max(0.0, 1.0 - (tool_failures * 0.2 + plan_changes * 0.3))
That health score? Saved us at 2 AM on a Friday. The agent had dropped to 0.3. Turned out it was stuck in a tool-calling loop because the API returned an unexpected format. Without the semantic signal, we'd have seen "high latency" and shrugged.
3. Detect Loops and Stuck States Automatically
Agents loop. It's their thing. Most loops are productive — they're refining, searching, iterating. But some are bugs.
We learned this the hard way. An agent was supposed to answer customer questions. Instead, it got stuck in a loop: "I need more context." → "Let me ask for more context." → "I need more context." → repeat. It ran for 6 hours. Cost us $340 in API calls and pissed off 12 customers.
Now we use a deterministic loop detector:
python
import hashlib

class LoopDetector:
    def __init__(self, max_similar_steps: int = 5, window_size: int = 10):
        self.history = []
        self.max_similar_steps = max_similar_steps
        self.window_size = window_size

    def check_step(self, tool_name: str, input_hash: str) -> bool:
        self.history.append({
            "tool": tool_name,
            "input_hash": input_hash,
            "timestamp": now()
        })
        recent = self.history[-self.window_size:]
        count = sum(1 for h in recent
                   if h["tool"] == tool_name and h["input_hash"] == input_hash)
        if count >= self.max_similar_steps:
            return True  # Loop detected
        return False
We set it to 5 identical tool calls with the same input. That's our threshold. Yours might be different. But you need something. Because agents don't naturally stop. They just keep going.
The AI Agent Protocols survey from arXiv mentions that 23% of production agent failures are loop-related. That matches our experience.
4. Real-Time Human Handoff With Full Context
Sometimes you can't monitor your way out of a problem. Sometimes the agent is confused and you need a human.
But here's the catch: the human needs the full context. Not just the last message. Not just a screenshot. The entire execution graph, tool inputs/outputs, token usage, and the agent's internal reasoning.
Aeroflow in 2025 had a 40-minute handoff delay because humans had to dig through logs. They rewrote their handoff system to include a serialized execution trace. Delay dropped to 2 minutes.
Here's the handoff data we serialize:
python
handoff_context = {
    "agent_id": "customer-support-v3",
    "session_id": "sess_9k2m4n",
    "duration_ms": 45200,
    "steps": 12,
    "tools_used": ["search_kb", "check_order", "send_email"],
    "llm_details": {
        "model": "gpt-4o",  # Not the new o3, we tested both
        "total_tokens": 3400,
        "prompt_tokens": 2100,
        "completion_tokens": 1300
    },
    "recent_tool_calls": [
        {"tool": "search_kb", "status": "success", "output_summary": "Found policy 401-K"},
        {"tool": "check_order", "status": "failure", "error": "Order not found in database"}
    ],
    "stuck_detector": {
        "loop_detected": False,
        "replan_count": 3,
        "last_meaningful_action": 15.2  # seconds ago
    }
}
We push this into a queue. A human agent picks it up. They start with a clear picture of what went wrong. Not "the agent is stuck." But "the agent tried to look up an order, it didn't exist, and it re-planned 3 times without success."
That's actionable.
What Most Tools Get Wrong
I've tested 14 monitoring platforms. Here's what I found:
The pretty dashboards lie. They show you beautiful graphs. "99.9% uptime!" Great. But the agent was running loops for 4 hours and still returning 200 OK. Uptime doesn't mean it's working.
Alerting on latency is useless. An agent that's hallucinating is fast. An agent that's stuck might be fast too. Latency only catches one failure mode: slow.
Most tools don't handle multi-agent setups. We run systems with 5-15 agents cooperating. One monitors another. They share context. The trace is a mesh, not a tree. Most tools assumed a single-agent execution path. They break.
Token cost aggregation is surprisingly bad. Some tools put token counts in custom attributes. Some ignore them. None correlate token usage with outcome quality. We had to build that logic ourselves.
The LangChain blog on agent frameworks makes a good point: monitoring needs to be framework-aware. You can't monitor a LangGraph agent the same way you monitor a CrewAI agent. The execution models are fundamentally different.
Stack Choices We Made (and Some We Regretted)
After 18 months of trial and error, here's what we settled on:
Tracing: OpenTelemetry with custom exporters. We use Honeycomb for storage and querying. It handles the high cardinality well — every agent session is unique, and traditional tools choke on that.
Metrics: Prometheus + Grafana. Simple, reliable, cheap. We expose: requests/second, token/second, tool call rate, loop detection count, handoff requests.
Logging: Structured JSON logs to S3. We store 90 days raw, 12 months aggregated. An agent generates more logs than a microservice by 10x. You need cheap storage.
Alerting: PagerDuty with custom alert rules. But 80% of our alerts are from semantic signals, not technical ones. "Replan rate > 5 per session" is a better alert than "95th percentile latency > 2s."
Human handoff: Custom-built on Redis Streams. We tried using a queue service but the context payloads were too large. Redis handles the throughput.
What we regretted:
- Datadog APM for agents. It worked fine for a week, then the cardinality crushed our bill. $18,000 for tracing alone. No thanks.
- Custom LLM monitoring without a plan. We started collecting everything, ended up with terabytes of useless data. You need to decide what matters before you instrument.
- Not testing with traffic patterns. Our monitoring worked great at 10 requests/minute. At 1000, it fell apart. The OpenTelemetry exporter became the bottleneck.
The Instaclustr article on agentic AI frameworks has a good comparison of framework-specific monitoring. LangGraph has built-in tracing now. AutoGen doesn't. CrewAI has decent logging but poor loop detection. Know what your framework supports before you build around it.
A Practical Deployment Pipeline
You asked for a tutorial. Here's the real one.
We deploy agents in phases, with monitoring at every stage:
Phase 1: Instrumentation (1-2 days)
Add OpenTelemetry to every agent step. Every tool call. Every LLM completion. Every loop check. This is boilerplate but critical.
python
# Simplified but real pattern
from opentelemetry import trace
from opentelemetry.exporter.otlp.proto.http.trace_exporter import OTLPSpanExporter
from opentelemetry.sdk.trace import TracerProvider
from opentelemetry.sdk.trace.export import BatchSpanProcessor

provider = TracerProvider()
processor = BatchSpanProcessor(OTLPSpanExporter(endpoint="http://honeycomb:4318/v1/traces"))
provider.add_span_processor(processor)
trace.set_tracer_provider(provider)

# In agent code:
tracer = trace.get_tracer(__name__)
with tracer.start_as_current_span("process_user_query") as span:
    span.set_attribute("user.id", user_id)
    span.set_attribute("query.length", len(query))
Phase 2: Baseline (3-5 days)
Run the agent with synthetic traffic. Collect normal patterns. What's the average replan rate? Typical token usage per query? Loop threshold? Don't set alerts until you know what "normal" looks like.
Phase 3: Canary (2-3 days)
Deploy to 5% of users. Monitor aggressively. If the agent health score drops below 0.7, roll back automatically. We had to do this 3 times last year. Each time, the monitoring caught it before users complained.
Phase 4: Gradual rollout (1-2 weeks)
Increase to 25%, 50%, 100%. At each step, check: is the monitoring pipeline still stable? Are the alerts accurate? (Spoiler: they won't be. You'll tune them constantly.)
Phase 5: Continuous monitoring
This never ends. You'll add new signals. Remove useless ones. Tune thresholds. The models change, the tools change, user behavior changes. Your monitoring must evolve.
The IBM Think article on AI agent frameworks suggests treating agent observability as a product, not a project. I agree. You need someone owning it full-time.
Common Failure Modes We've Seen
Let me save you some pain. Here are the failures we encounter most:
"The agent is slow" — actually it's waiting for a tool that's crashing. We spent 2 weeks optimizing the LLM. The bottleneck was a MySQL query. Tracing would have shown it instantly.
"The agent is hallucinating" — actually it's working with stale context. An agent that runs for 30 minutes accumulates context. If you don't trim it, the model starts referencing old, irrelevant information. Monitor context window utilization.
"Costs are exploding" — actually one user is running 10,000 sessions. We had a beta user testing our agent by running scripts. 15,000 sessions in one day. Cost: $2,300. We now have per-user throttling and budget alerts.
"The agent keeps failing" — actually the prompt changed. Someone on the team "fixed" a prompt without telling anyone. The agent broke. We now have prompt versioning and automated regression tests. Any prompt change triggers a canary deployment.
"It's not working — let's rebuild" — actually the monitoring was down. Classic. The problem wasn't the agent. The problem was the monitoring tool crashed. You need health checks on your monitoring too.
What I'd Do Differently
If I started today, I'd:
-
Default to open standards. OpenTelemetry is the way. Don't use vendor-specific agents. You'll want to switch later.
-
Invest in semantic monitoring from day one. Token metrics are table stakes. Tool success rates, replan frequency, context utilization — those catch real problems.
-
Build for multi-agent tracing. Even if you're running one agent now, you'll have more soon. The trace format should support parent-child relationships across agents.
-
Budget 15% of engineering time for monitoring. It's not overhead. It's your safety net. You can't fix what you can't see.
-
Test your monitoring under production load. If it falls over at 100 requests/second, it's not production-ready. It's a toy.
The SSONetwork article on AI agent protocols mentions that A2A (Agent-to-Agent) protocol is standardizing how agents communicate. That's great. But it doesn't standardize how you monitor them. That's still on you.
FAQ: AI Agent Production Monitoring Tools
Q: Do I need a dedicated monitoring tool, or can I use my existing observability stack?
You can extend your existing stack, but you'll need custom instrumentation. OpenTelemetry works with most backends (Datadog, Honeycomb, Grafana). The challenge is setting up the right signals — token usage, tool calls, loop detection — not the pipeline itself. At SIVARO, we use Honeycomb because it handles high-cardinality traces well. Most traditional APMs choke on agent data.
Q: How much does agent monitoring cost?
More than you expect. An agent generates 10-50x more telemetry than a typical microservice. We spend ~$2,000/month on our monitoring stack for 50 agents handling 50K sessions/day. That's tracing, metrics, and logging. If you use Datadog, expect $5K+ because of the cardinality.
Q: What's the biggest mistake teams make when implementing ai agent production monitoring tools?
Instrumenting everything. You don't need every LLM response stored. You need the patterns. Start with 5 signals: latency, token count per step, tool success rate, replan rate, and loop count. Add more as you learn what matters for your use case.
Q: Can I monitor agents from different frameworks (LangChain, CrewAI, AutoGen) with one tool?
Yes, if you use OpenTelemetry as the common layer. Each framework exposes different hooks. LangGraph has built-in tracing. CrewAI requires manual instrumentation. AutoGen has decent logging but poor trace structure. Unify them with a custom OpenTelemetry wrapper. The data format should be consistent, even if the framework isn't.
Q: How do you handle monitoring for agents that run asynchronously or for long periods?
It's a challenge. Long-running agents (hours or days) require session-level monitoring. Associate all spans with a session ID. Use persistent storage for state. Set alarms for inactivity — if an agent hasn't produced a step in 5 minutes, something is wrong. We've had agents that went "silent" but were actually stuck in a retry loop with no visible errors.
Q: Should I monitor model-specific metrics (perplexity, logprobs) or just behavioral metrics?
Both, but start with behavioral. If the agent is calling the right tools and completing tasks, model quality is secondary. We monitor perplexity for hallucination detection, but it's a lagging indicator. Tool call success rate catches problems faster. When an agent starts failing all its tool calls, you don't need to check the model's confidence — you know something is broken.
Q: What happens when the monitoring tool itself causes issues?
It happens. The OpenTelemetry exporter can become a bottleneck. The logging pipeline can overflow. We've had monitoring data loss because the buffer was too small. Two rules: (1) Put the monitoring on a separate thread/process — never inline with the agent. (2) Have a kill switch. If monitoring is overloaded, log to disk and recover later. Don't let monitoring crash the agent.
Q: Is it worth building your own monitoring tool vs buying one?
If you're running fewer than 5 agents in production, buy. Use LangSmith or Helicone. If you're running 50+ agents or have custom requirements, build. The off-the-shelf tools don't handle multi-agent tracing well. We built ours because we needed semantic signals and loop detection that didn't exist. But it cost 3 developer-months. Do the math.
The Real Cost of Not Monitoring
On May 12, 2026, an airline's customer-service agent went rogue. (I won't name them, but you've heard of the incident.) It sold flight upgrades for 87 cents instead of $87. Ran for 45 minutes before anyone noticed. Cost them $2.3 million.
Not because the model was bad. Because they had no monitoring. No one saw the price parameter was corrupt because the agent was hitting the right API endpoints with the right form. The monitoring only checked "is the API working?" not "is the output sane?"
That's the difference between ai agent production monitoring tools and everything else. You're not just checking uptime. You're checking sanity. You're checking if the agent is doing what you hired it to do.
Start simple. Trace your first agent today. Add one semantic signal tomorrow. Test it under load next week.
Because the alternative is learning the hard way — like I did, like that airline did, like hundreds of teams will this year.
Your agent is already running in production. Do you actually know what it's doing?
Nishaant Dixit — Founder of SIVARO. Building data infrastructure and production AI systems since 2018. Built systems processing 200K events/sec.