 SIVARO
AI Agent Production Monitoring: The Missing Manual for 2026
I spent last Tuesday taking my own medicine.
SIVARO runs a fleet of ~400 production AI agents for a logistics client. At 2:37 PM, one of them stopped booking shipping slots. It didn't crash. It didn't throw errors. It just sat there, "thinking" — accumulating latency, burning tokens, explaining to nobody why it couldn't complete the workflow.
We caught it nine minutes later because our monitoring screamed. But the agent had already missed two time-sensitive bookings.
That's the nightmare. Not your agents failing — but failing silently, expensively, and invisibly.
What this guide covers: What ai agent production monitoring tools actually do (vs what vendors claim), how to instrument an agent deployment pipeline from scratch, what metrics matter when your agent is making decisions at 500ms per call, and the three specific patterns I've seen kill production deployments in 2025-2026.
I run a product engineering company. We build data infrastructure and production AI systems. This is what we've learned the hard way.
Why the Old Monitoring Playbook Breaks for AI Agents
Traditional monitoring assumes deterministic systems. Your API either returns 200 or 500. Your database query either finishes in 50ms or times out.
Agents don't work that way.
An agent can return HTTP 200 while making a decision that costs you $2,000. It can execute every step "correctly" but choose the wrong tool because your prompt had a subtle ambiguity. It can get stuck in loops that look like thoughtful processing.
AI Agent Frameworks from LangChain, CrewAI, and Microsoft's Semantic Kernel have made building agents trivial. But they've also made debugging them harder. The abstraction layers hide what the LLM is actually doing.
In 2024, I watched a team ship an agent that looked perfect in staging. In production, it hallucinated tool names. Not because the model was bad — because their monitoring couldn't detect that the agent was attempting invalid tools and silently retrying.
That's the gap. And that's what production monitoring tools for AI agents must fill.
What Actually Needs Monitoring (Spoiler: It's Not Just Latency)
Most people think you need to track token usage and response times. They're right about the basics and wrong about the hard parts.
Here's what we monitor at SIVARO, ranked by how often they catch real problems:
1. Decision Pathways (The Big One)
Every agent call produces a trace of decisions: which tool it selected, what reasoning it used, how confident it was.
You need to capture this as structured data. Not just logs. Actual queryable events.
Here's our minimal schema from production:
python
class AgentDecisionEvent:
    agent_id: str
    session_id: str
    parent_decision_id: Optional[str]
    tool_name: str
    tool_args: dict
    reasoning_text: str  # The model's chain-of-thought
    confidence_score: float  # Model-reported confidence
    latency_ms: int
    token_count: int
    retry_count: int
    outcome: Literal["success", "failure", "retry", "loop_detected"]
This seems obvious. Almost nobody does it.
Every vendor will sell you metrics. AI Agent Protocols like A2A and MCP are starting to standardize how agents communicate, which helps. But reading those specs won't make your monitoring better if you don't capture decision data.
2. Loop Detection
Agents love loops. Not because they're malicious — because LLMs have no internal sense of "I've been trying this same thing for ten minutes."
We track:
- Sequence of tool calls per session
- Number of times the same tool + arguments repeat
- Time spent in any single "reasoning cycle"
When those numbers cross thresholds (which you calibrate per agent type), you need alerts.
3. Confidence Drift
This is the silent killer I mentioned earlier.
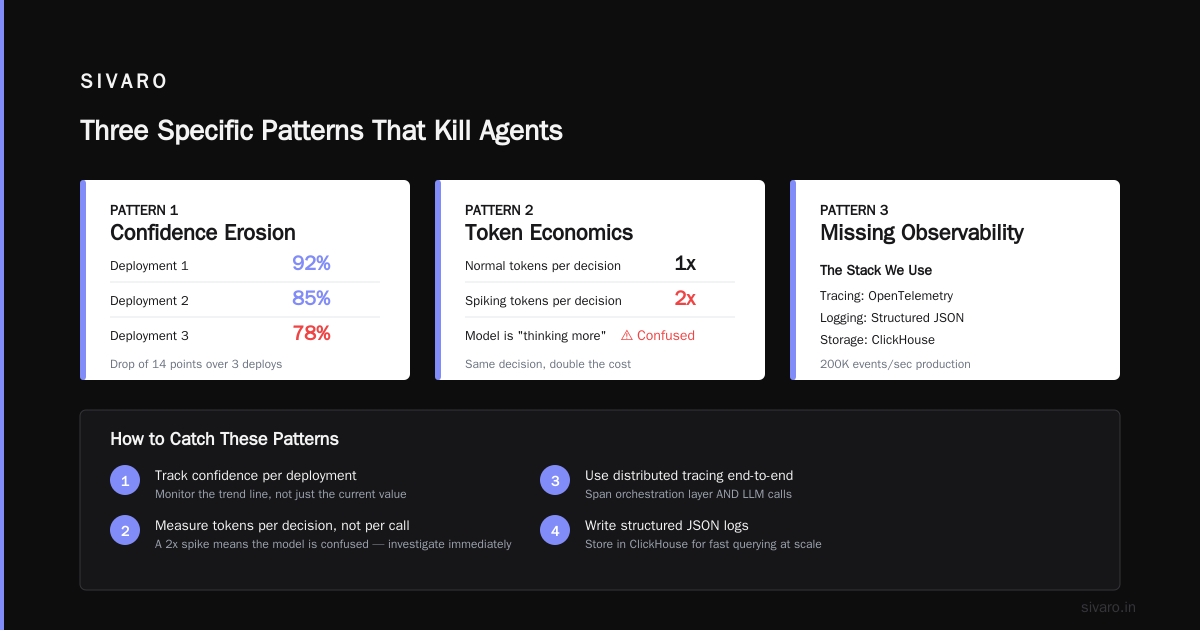
An agent that starts making decisions with declining confidence doesn't crash — it just degrades. Feature releases, prompt changes, or model updates can push confidence down by 10-15% over a week.
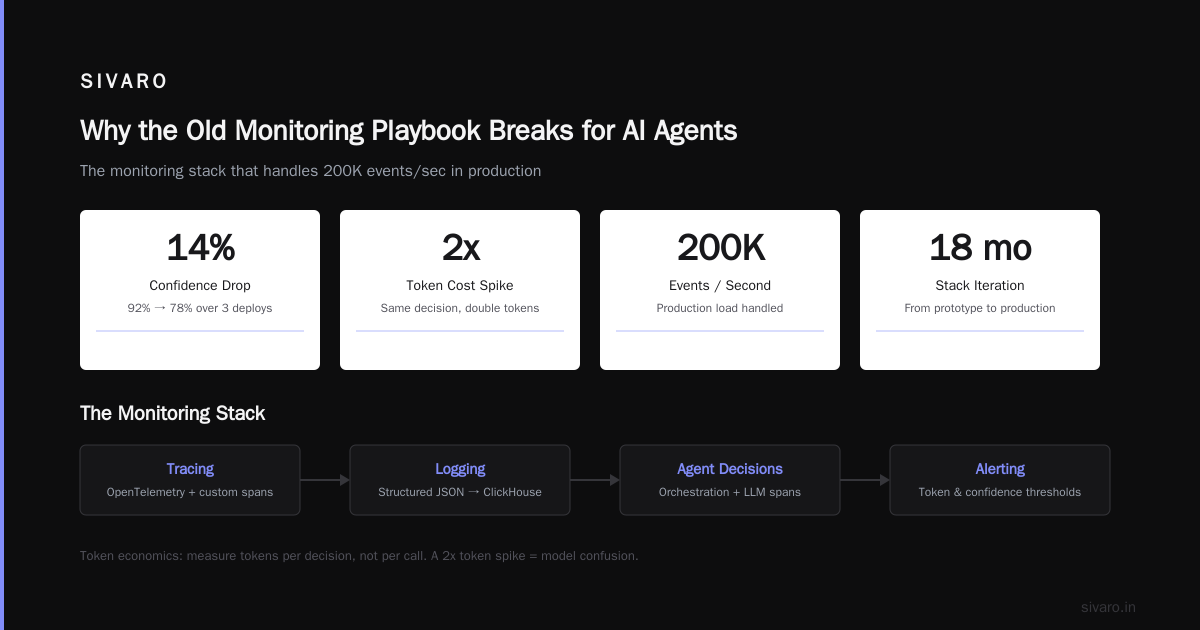
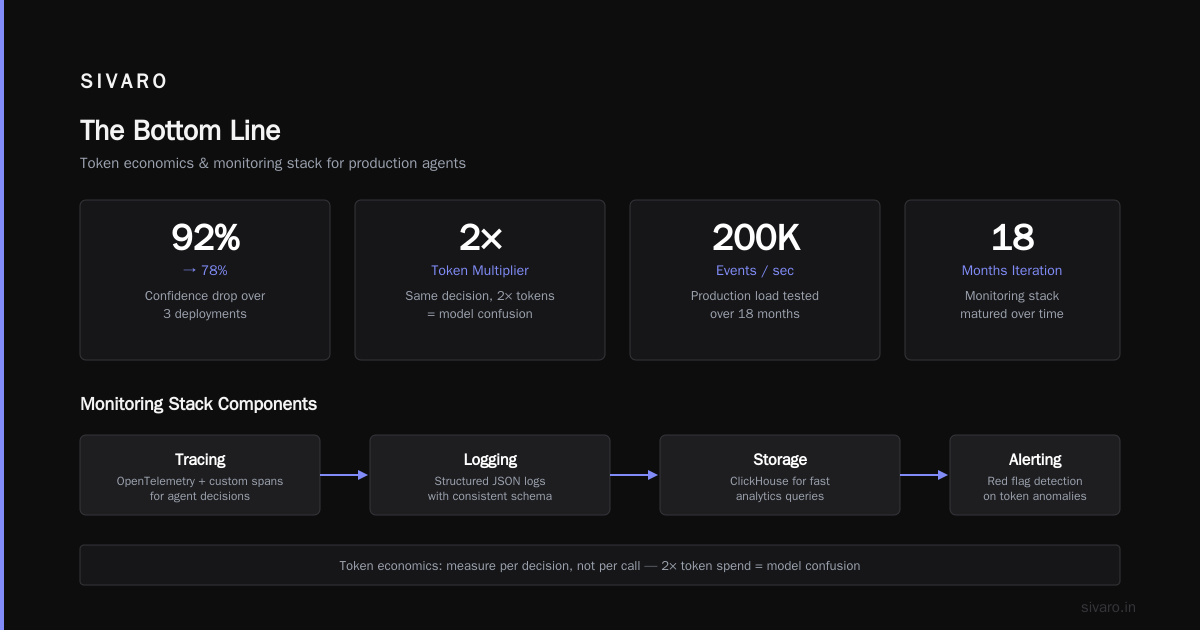
Agentic AI Frameworks handle the orchestration well. They don't help you notice that your agent went from 92% confident to 78% confident over three deployments.
4. Token Economics
Token usage per decision. Not per call.
If your agent suddenly starts spending 2x tokens to make the same decision, that's a red flag. It means the model is "thinking more" — which usually means it's confused.
Building the Monitoring Stack: What We Actually Use
Here's the stack we've settled on after 18 months of iteration. I'm not saying it's perfect for everyone. But it works for production loads of 200K events/sec.
Tracing: OpenTelemetry with custom spans for agent decisions. You need distributed tracing that spans the orchestration layer (your framework) and the LLM calls.
Logging: Structured JSON logs with the schema above. We write to ClickHouse for fast queries.
Alerting: A custom evaluator that runs every 30 seconds. It checks for loop patterns, confidence drift, and latency anomalies.
Dashboards: Grafana with custom panels for decision pathway visualization.
Here's what setting up OpenTelemetry for an agent looks like:
python
from opentelemetry import trace
from opentelemetry.exporter.otlp.proto.grpc import OTLPSpanExporter
from opentelemetry.sdk.trace import TracerProvider
from opentelemetry.sdk.trace.export import BatchSpanProcessor

tracer = trace.get_tracer("agent-monitoring")

# In your agent execution loop
with tracer.start_as_current_span("agent_decision") as span:
    span.set_attribute("agent.id", agent_id)
    span.set_attribute("tool.selected", tool_name)
    span.set_attribute("confidence", confidence_score)
    span.set_attribute("decision.outcome", outcome)

    # If the agent retried
    if retry_count > 0:
        span.set_attribute("retry.count", retry_count)
        span.set_attribute("retry.reason", retry_reason)

    # Execute the tool call
    result = await execute_tool(tool_name, tool_args)
This gives you a trace per decision. You can then query: "show me all decisions where confidence < 0.8 and tool = 'booking_api'".
The gap most teams hit: they instrument the LLM call but not the decision layer. Your framework already handles the LLM. You need to instrument the orchestration logic.
How to think about agent frameworks makes this point better than I can — don't treat the framework as a black box. Instrument the boundaries.
Decision Trees vs. LLM Calls: Two Different Monitoring Problems
Here's the distinction that matters:
LLM call monitoring is relatively solved. Track latency, token usage, error rates. Done.
Agent decision monitoring is where it gets interesting. The agent's decision-making is a process, not a single call. You're tracking:
- Which reasoning path was chosen
- Which tool alternatives were considered but rejected
- How the agent's confidence evolved during reasoning
This is closer to monitoring a state machine than monitoring an API.
Top 5 Open-Source Agentic AI Frameworks in 2026 all provide some form of callback hooks. But they're generic. You need to build the semantics on top.
For example, LangGraph allows custom state monitors. Here's how we use them:
python
from langgraph.graph import StateGraph

class ProductionMonitor:
    def __init__(self):
        self.decision_history = []
        self.loop_detector = LoopDetector()

    def on_node_entry(self, node_name, state):
        self.decision_history.append({
            "node": node_name,
            "timestamp": time.now(),
            "state_snapshot": state.copy()
        })

        if self.loop_detector.is_looping(self.decision_history):
            raise LoopDetectedError(f"Loop detected at {node_name}")

    def on_node_exit(self, node_name, state):
        self.emit_decision_event(node_name, state)

graph = StateGraph(AgentState)
graph.add_node("reasoning", reasoning_node,
               on_entry=monitor.on_node_entry,
               on_exit=monitor.on_node_exit)
That LoopDetector is simple: if the same node-state combination appears > N times within a sliding window, we alert. We calibrate N per agent.
The Deployment Pipeline Nobody Talks About
You don't just monitor production agents. You monitor the pipeline that ships them.
Here's a messy truth: most agent failures in production come from changes. A prompt tweak. A model swap. A new tool in the agent's toolkit.
You need a deployment pipeline that validates agent behavior before it reaches users. And I don't mean unit tests on individual functions.
Here's our ai agent deployment pipeline tutorial (condensed):
Step 1: Regression Test Suite
Build a set of 50-100 test scenarios. Each scenario has:
- A known correct decision path
- Edge cases (ambiguous queries, missing tool params)
- Expected confidence thresholds
Run every candidate agent through these. Alert if any decision path diverges.
Step 2: Canary Deployment
Ship the new agent alongside the current one. Route 2% of traffic to the new agent. Monitor decision quality, not just response time.
Step 3: Shadow Comparison
Run the old and new agents on identical inputs. Compare decision pathways. This catches regressions that don't show up in aggregate metrics.
Step 4: Gradual Rollout
Increase traffic in 10% increments. At each step, check confidence distribution and loop rates.
Here's a simplified Python implementation of a canary evaluator:
python
async def evaluate_canary(canary_agent, production_agent, traffic_fraction=0.02):
    while True:
        request = await get_next_request()
        assigned_to_canary = random.random() < traffic_fraction

        if assigned_to_canary:
            result = await canary_agent.handle(request)
            metadata = extract_decision_metadata(result)
            log_canary_decision(request, metadata)

            if metadata.confidence < threshold:
                alert_canary_confidence_drop(metadata)
        else:
            result = await production_agent.handle(request)

        # Shadow comparison on every Nth request
        if request.id % 100 == 0:
            control_result = await production_agent.handle(request.clone())
            compare_decisions(result, control_result)
The shadow comparison is critical. It's the only way to catch regressions that only appear on specific input patterns.
Three Specific Patterns That Kill Agents (And How to Catch Them)
Pattern 1: The Confidence Cliff
Your agent makes decisions with 90%+ confidence for weeks. Then a model version changes (or your prompt gets a "helpful" improvement) and confidence drops to 60%.
The agent still works. But it's worse. Users notice slower responses, more back-and-forth, more "I need more information" replies.
How to catch it: Track the 5th, 50th, and 95th percentile of confidence per agent version. Alert when the median drops by more than 10% in a rolling 7-day window.
Pattern 2: Silent Retry Loops
This destroyed us in early 2025. Agent calls a tool, gets a transient error, retries immediately with the same arguments. Each retry costs tokens. The agent doesn't know it's in a loop.
How to catch it: Track retry counts per decision. Alert if any agent session exceeds 3 retries within 30 seconds. Also track retry reason codes — if the same error is repeating, that's a loop.
Pattern 3: Tool Drift
You update a tool's API. The new version expects slightly different parameters. Your agent's prompt says "call this tool with X" but the tool now needs X and Y.
The agent can't call the tool correctly. It tries, fails, retries, fails. Eventually gives up with "I'm unable to complete this request."
How to catch it: Monitor tool error rates per tool and per argument pattern. If a specific argument combination starts failing at higher rates, the tool API probably changed.
A Survey of AI Agent Protocols covers how protocols like MCP try to standardize tool definitions. But in practice, tool drift happens when humans update APIs and forget to update agent descriptions.
What Vendors Get Wrong (And What I'd Buy Instead)
I've evaluated 14 monitoring tools for AI agents in 2025-2026. Here's the pattern:
Every vendor shows you beautiful traces of individual agent runs. "Look, we can see the decision tree!" Great. That's table stakes.
What they don't do well:
- Aggregate decision quality across thousands of sessions
- Compare behavior between agent versions
- Alert on semantic drift (confidence dropping, reasoning patterns changing)
- Handle the deployment pipeline validation
Most "AI agent monitoring" tools are rebranded LLM monitoring tools. They track tokens and latency. Those are important but not sufficient.
If I were buying today, I'd look for:
- Custom metric definitions (not predefined dashboards)
- Decision tree visualization at scale (not per-session)
- Version comparison built in
- OpenTelemetry native integration (no proprietary agents)
LangSmith and Arize AI come closest. But neither solves all four problems.
The Observability Paradox for AI Agents
Here's the thing nobody tells you: good observability changes how you build agents.
When we started adding deep monitoring at SIVARO, we found that our agents' decision-making patterns were bad. They'd loop. They'd over-rely on one tool. They'd hallucinate reasoning steps.
But without monitoring, those patterns looked like normal behavior.
The act of observing forced us to redesign. We simplified prompts. We added explicit state machines for high-risk decisions. We put hard limits on reasoning cycles.
ai agent observability production isn't a thing you bolt on after deployment. It's a constraint that shapes how you build.
You want agents that are observable by design. Not agents that you try to observe after the fact.
FAQ
Q: What's the minimum monitoring setup for a production agent?
A: Structured logging of every decision event (tool name, args, reasoning, confidence, latency, outcome), loop detection (same tool+args in sequence), and 5th/50th/95th latency and confidence percentiles over 1-hour windows. That's the floor. How to think about agent frameworks has a good minimal implementation guide.
Q: Can I use existing APM tools like Datadog or New Relic?
A: Yes, but only if you instrument custom spans and metrics. Standard APM won't capture decision quality or loop patterns. You need to emit your own metrics and build dashboards on top.
Q: How often should I retrain my monitoring thresholds?
A: Every agent version change. Thresholds that worked for GPT-4 might not work for Claude 4 or Gemini 2.5. We recalibrate per deployment using shadow comparison data.
Q: What's the biggest mistake teams make with agent monitoring?
A: Treating it like API monitoring. Tracking response time and error rate, but ignoring decision quality. A "healthy" agent can be making terrible decisions.
Q: OpenTelemetry or custom agents?
A: OpenTelemetry. Always. AI Agent Protocols like the OpenTelemetry semantic conventions for AI are getting good. Don't build a proprietary instrumentation layer.
Q: How do you monitor agents that use multiple models?
A: Tag every decision with model version. Then compare decision quality metrics across models. If one model shows lower confidence or higher loop rates on specific tool types, you know where to dig.
Q: Should I monitor the framework or the agent code?
A: Both. Framework monitoring catches orchestration issues. Agent code monitoring catches decision quality issues. Agentic AI Frameworks give you hooks for both — use them.
Q: What's the cost of deep monitoring?
A: More than you think. A decision trace with full reasoning text can be 5-10KB per decision. At 200K events/sec, that's 1-2GB/sec of data. We batch and sample aggressively. 10% sample at p95 latency, 100% for critical decisions.
The Bottom Line
ai agent production monitoring tools aren't a solved problem. Not by a long shot.
The vendors are catching up. The protocols are maturing. But right now, if you want production-grade monitoring, you're building it yourself.
That's okay. The patterns are clear:
- Instrument decisions, not just calls
- Detect loops and confidence drift
- Build a deployment pipeline that validates behavior
- Make observability a design constraint, not an afterthought
I'm Nishaant Dixit. I run SIVARO. We build production AI systems that process 200K events per second. We learned this stuff by waking up to pager alerts at 3 AM and realizing our agents had been failing for hours.
You don't have to learn it the same way.
Start with structured decision events. Add loop detection. Build shadow deployments. Everything else is optimization.
The agent you save from a silent failure at 2:37 PM might be yours.
Nishaant Dixit — Founder of SIVARO. Building data infrastructure and production AI systems since 2018. Built systems processing 200K events/sec.