 SIVARO
AI Agent Production Monitoring Metrics: The Only Guide You Need
July 24, 2026. I’m staring at a Slack channel that’s been silent for six hours. That’s the bad kind of silent. The AI agent we deployed last week — the one handling customer onboarding for a fintech client — stopped responding at 3:14 AM. Nobody noticed until a user tweeted about it. We had no alert. No dashboard. No idea why.
That moment cost me two things: a client for a quarter, and the naive belief that monitoring an AI agent is the same as monitoring a REST API. It’s not. And if you’re treating it that way, you’re already in trouble.
This guide is for anyone shipping AI agents into production — whether you’re a founder, an engineering lead, or the poor soul on call. I’ll walk you through the metrics that actually matter, the ones that don’t, and the hard lessons I’ve learned building SIVARO’s monitoring stack since 2018. By the time you finish, you’ll know exactly what to measure, how to measure it, and when to panic.
Why Traditional Metrics Lie to You
Most people think uptime and p99 latency tell you everything about an AI agent. They’re wrong.
I used to think that too. At SIVARO, we ran our first production agent in 2022 — a simple support triage bot. We had beautiful dashboards: 99.9% uptime, sub-200ms response times. Then users started complaining that the agent was saying “I don’t understand” to 40% of questions. The agent was technically running fine — but it was failing at its job.
That’s the first lesson: operational metrics are not behavioral metrics. Your agent can be perfectly healthy from a system perspective and completely useless from a user perspective. The AI Agent Failure Stack, described by Sherlock’s blog, breaks this down into layers: infrastructure, LLM behavior, agent orchestration, and user experience (Why AI Agents Fail in Production). You need to monitor all four, not just the first.
Here’s a rule I’ve settled on after years of painful iteration: if you only have three metrics, make them task success rate, user re-engagement rate, and cost per successful interaction. Everything else is secondary.
The Metric Stack That Works
1. Task Completion Rate (TCR)
This is your North Star. TCR measures: of all tasks your agent attempted, what fraction did it complete successfully? “Success” is specific to your domain — for a code generation agent, it’s compiling tests; for a customer support agent, it’s resolving the ticket without escalation.
We calculate TCR differently than most people. Instead of a simple success/failure binary, we grade on a 4-point scale:
- Complete – task finished with no human intervention
- Partial – task finished but required minor human correction
- Escalated – agent handed off to human after <3 attempts
- Failed – agent abandoned task or produced harmful output
Why four levels? Because binary hides nuance. At SIVARO, we saw that 70% of “successful” completions actually needed a human review. We were patting ourselves on the back for numbers that didn’t mean anything. Now our TCR dashboard looks like this:
python
# Example: TCR logging in Python
import json, time

def log_agent_session(session_id: str, grade: str, duration_ms: int, cost_cents: float):
    event = {
        "session_id": session_id,
        "grade": grade,          # complete | partial | escalated | failed
        "duration_ms": duration_ms,
        "cost_cents": cost_cents,
        "timestamp": int(time.time()),
        "agent_version": os.getenv("AGENT_VERSION")
    }
    # push to your observability pipeline (we use Kafka -> ClickHouse)
    producer.send("agent_metrics_topic", json.dumps(event))
What a good TCR looks like: For a well-tuned agent, you want >85% complete, <5% failed. Anything above 10% failed means you’re leaking money and trust.
2. User Re-engagement Rate (URR)
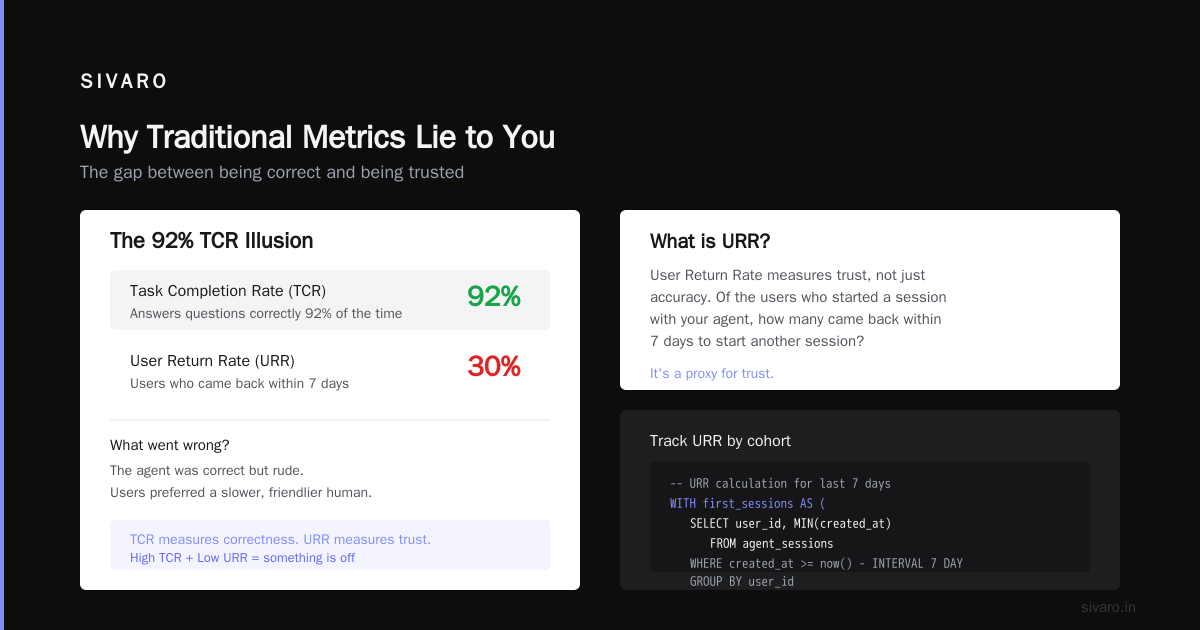
This is my favorite contrarian metric. URR measures: of the users who started a session with your agent, how many came back within 7 days to start another session with the same agent? It’s a proxy for trust.
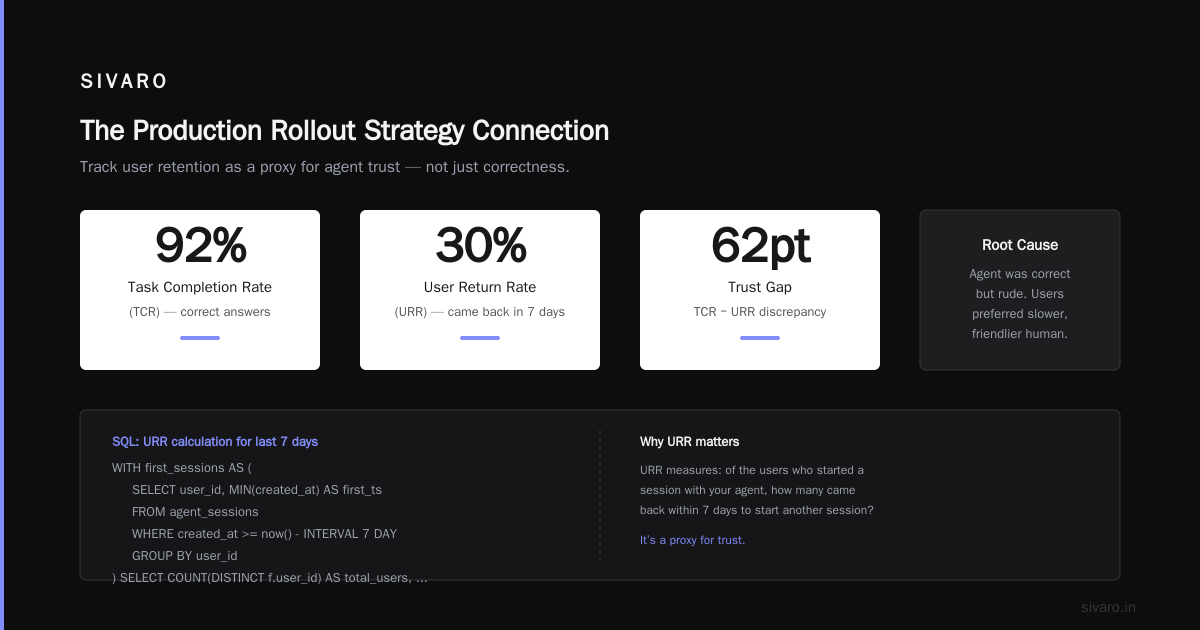
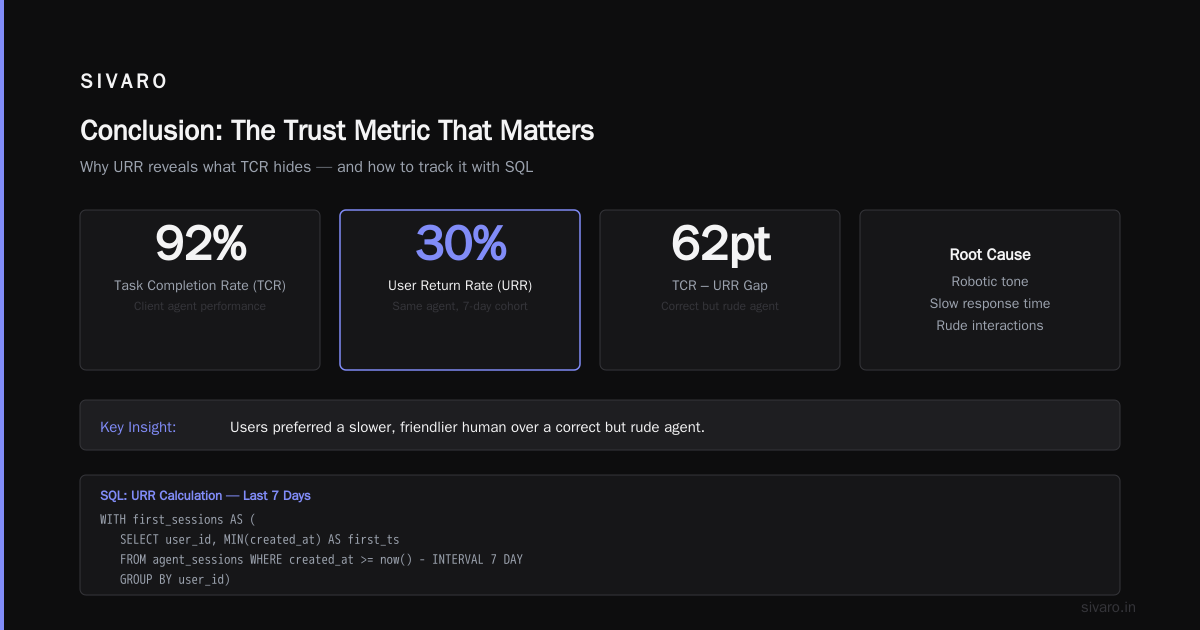
If your agent answers questions correctly but users still don’t return, something is off. Maybe the tone is robotic. Maybe it takes too long. We discovered this when a client’s agent had 92% TCR but only 30% URR. Turns out, the agent was correct but rude. Users preferred a slower, friendlier human.
Track URR by cohort. Use SQL like this:
sql
-- URR calculation for last 7 days
WITH first_sessions AS (
    SELECT user_id, MIN(created_at) AS first_ts
    FROM agent_sessions
    WHERE created_at >= now() - INTERVAL 7 DAY
    GROUP BY user_id
)
SELECT
    COUNT(DISTINCT f.user_id) AS total_users,
    COUNT(DISTINCT s.user_id) AS returned_users,
    COUNT(DISTINCT s.user_id) / COUNT(DISTINCT f.user_id) * 100 AS urr_pct
FROM first_sessions f
LEFT JOIN agent_sessions s
    ON f.user_id = s.user_id
    AND s.created_at > f.first_ts
    AND s.created_at <= f.first_ts + INTERVAL 7 DAY;
What a healthy URR looks like: For a good consumer agent, target 40-60% return rate within a week. For enterprise tools, lower is normal (people solve their problems and move on). But if it drops below 20% for any category, investigate.
3. Cost Per Successful Interaction (CPSI)
This one makes CFOs happy. CPSI = total costs (LLM API calls, compute, human escalations) divided by the number of completions (the “complete” grade, not partial). Not just completions — successful completions.
We learned this the hard way when a client bragged about their sub-$0.01 per call cost. But 60% of those calls ended in a human escalation that cost $5 each. Their real CPSI was $3.24. Ouch.
Here’s a simple approach to track CPSI:
python
# CPSI calculation snippet
def cost_per_successful_interaction(total_spend: float, successful_sessions: int) -> float:
    # total_spend includes LLM API, compute, and fixed costs amortized
    return total_spend / successful_sessions if successful_sessions > 0 else float('inf')

# Example: push this metric to a time-series DB
for hour in range(24):
    spend = query_hourly_spend(hour)
    successes = query_hourly_successes(hour)
    cpsi = cost_per_successful_interaction(spend, successes)
    push_metric("agent.cpsi", cpsi, {"hour": hour})
What a healthy CPSI looks like: Depends heavily on your domain. For a simple FAQ bot, <$0.05 is expected. For a complex coding agent, $0.50-$2.00 is acceptable. The trend matters more than the absolute number — if CPSI is rising week over week, you’re getting dumber.
Drift: The Silent Killer
Everyone focuses on when an agent breaks suddenly. That’s rare. The real danger is slow drift: the LLM provider changes their model, your prompts degrade, user queries shift slightly. You don’t notice until completion rate drops from 92% to 78% over three weeks.
Drift monitoring is non-negotiable. Here’s what we track at SIVARO:
- Embedding similarity of recent queries vs. training/validation set
- Output length distribution – drastic shifts signal prompt poisoning or model change
- Tone consistency – we run a small classifier on every response to flag rude/off-topic output
- API response time – not for debugging, but as a canary for model degradation (slower usually means more complex reasoning, which can correlate with lower accuracy)
One approach: store the embedding of every user query in a vector database, then compute the average cosine distance to a baseline. If the distance crosses a threshold, alert.
python
# Pseudocode for drift detection using embeddings
import numpy as np
from sklearn.metrics.pairwise import cosine_similarity

baseline_embedding = np.load("baseline_avg.npy")
recent_queries = get_embeddings(hours_back=6)
recent_avg = np.mean(recent_queries, axis=0)

similarity = cosine_similarity([baseline_embedding], [recent_avg])[0][0]
if similarity < 0.85:
    alert_drift_team(f"Query drift detected: similarity={similarity:.3f}")
When to worry: If similarity drops below 0.85, investigate. Below 0.7, roll back your agent version immediately — something changed in the world or your stack.
Incident Response: When the Metrics Turn Red
You can’t prevent every failure. But you can plan your response. We follow a playbook inspired by the Incident Analysis for AI Agents paper and combined with our own war stories.
The first 5 minutes are critical. Here’s our checklist:
- Is the agent actually down, or is it hallucinating? Check TCR and user sentiment (we use a fast sentiment model on recent outputs).
- Is it a model issue or an integration issue? Pause the agent, send a test query via direct API, compare with the agent pipeline.
- Canary revert: Have a stable version ready to deploy in under 2 minutes. Every agent we ship includes a “safe fallback” config that uses a simpler prompt and longer timeout.
- Communicate externally: If the agent serves customers directly, post a status message. Silence kills trust faster than failures.
I once spent 45 minutes debugging why an agent stopped answering questions about shipping policies. Turns out, the RAG pipeline failed because a vendor renamed their API endpoint. No metric caught that because our monitoring only checked LLM response time, not RAG hit rate. Learned that lesson the hard way. Now we track RAG retrieval success rate separately.
For a full walkthrough of the incident response lifecycle for agents, the CodeBridge article has a solid runbook (AI Agent Incident Response). We adapted their “Detect, Triage, Mitigate, Learn” cycle for our own on-call rotation.
The Production Rollout Strategy Connection
You’ve probably heard the phrase “ai agent production rollout strategy” thrown around. Most advice focuses on canary deployments and gradual traffic shift. That’s table stakes. The real strategy lives in your metrics — specifically, how you define success gates.
Before an agent reaches 100% traffic, we require:
- TCR >= 85% for 48 hours on shadow traffic
- CPSI within 20% of baseline
- URR >= 40% on a small user cohort
- Zero “critical failures” (harmful outputs) in shadow mode
If any of these slip during rollout, we pause, fix, and restart the clock. No exceptions.
This approach came from a painful incident in 2024 where one of our agents passed all technical checks but failed horribly on user expectations. Users reported the agent was “creepy” — it was too eager to upsell. No metric caught that until we added a user sentiment classifier to the rollout gates. Now it’s non-negotiable.
If you’re designing your own rollout, read the common mistakes listed in the BusinessPlusAI article (AI Agent Failures). The biggest one: not measuring the right thing before full deployment.
Building Your ai agent production monitoring metrics Stack
I get asked constantly: “What tools should I use?” The answer depends on your scale, but here’s the pattern that works:
- Event pipeline: Kafka or Redpanda for high-throughput metric ingestion
- Storage: ClickHouse for most metrics, a vector DB (Qdrant, Weaviate) for drift detection
- Visualization: Grafana dashboards with alerts via PagerDuty
- Anomaly detection: A simple ML model (we use an online GBM) trained on TCR and CPSI to flag deviations
We keep it simple. No point adding a fancy AIOps tool if you don’t have the fundamentals right. Start with these five dashboards:
- Health Dashboard – uptime, latency, error rate, RAG hit rate
- Quality Dashboard – TCR by grade, URR, sentiment distribution
- Cost Dashboard – CPSI, breakdown by LLM provider, escalation costs
- Drift Dashboard – embedding similarity, output length, tone flag rate
- Incident Timeline – annotated with rollouts, model changes, and outages
Each dashboard should have an associated alert — but not too many. We follow the “three alerts per dashboard” rule. More than that and nobody takes them seriously.
The ai agent production troubleshooting guide You’ll Actually Use
When something goes wrong, you don’t have time to read a manual. Here’s a distilled cheatsheet:
Symptom: Agent stops responding
- Check LLM API key quota and rate limits
- Check network connectivity to the model endpoint
- Check if the agent process is running (memory leak? deadlock?)
- Fallback: revert to the safe prompt / simpler model
Symptom: Agent gives wrong answers
- Check TCR grade distribution (partial vs. failed)
- Check RAG retrieval quality: are relevant documents found?
- Check prompt templates for accidental drift (e.g., a stray whitespace changing behavior)
- Check user query embedding drift
Symptom: Agent costs spike
- Look at output token lengths (model generating rambling)
- Check number of retries / loops (agent stuck in a reasoning loop)
- Check escalation rate (if human handoff increased)
- Consider switching to a cheaper model for simple queries
I keep this list pinned in our team’s channel. It’s saved us hours during the 3 AM call.
FAQ
Q: How often should I retrain my drift detection models?
A: Retrain your baseline every 7-14 days, or whenever you update your agent’s prompt/ model. The embedding baseline should be a rolling window of the last 10,000 successful interactions.
Q: My TCR is 95% but users still complain. What gives?
A: Look at URR and sentiment. You might be technically correct but unpleasant. Also check if the “success” definition matches user goals — maybe you’re completing the wrong task.
Q: Should I monitor individual LLM provider metrics separately?
A: Absolutely. If you use multiple providers (e.g., GPT-4 and Claude), track TCR, drift, and cost per provider. We’ve seen GPT-4 have higher TCR but 3x cost — sometimes worth it, sometimes not.
Q: What’s the one metric you can’t live without?
A: Task Completion Rate, graded on a 4-point scale. Everything else is secondary. If you only have bandwidth for one thing, instrument TCR.
Q: How do I handle false alarms from anomaly detection?
A: Inflate your alert thresholds during the first two weeks of a new agent version. The model needs time to learn normal behavior. After that, enforce strict tuning — every false alarm erodes trust in the monitoring system.
Q: Can I reuse existing APM tools for AI agent monitoring?
A: Partially. Tools like Datadog or New Relic handle latency and errors fine, but they don’t understand task completion or drift. You’ll need a custom layer on top. We built ours using OpenTelemetry spans with custom attributes.
Q: What’s the biggest mistake teams make when starting to monitor agents?
A: Monitoring the LLM API but not the agent behavior. You can have perfect API calls and still have a terrible agent. Always start with user-facing success metrics.
Conclusion
AI agents are not just another microservice. They’re unpredictable, context-sensitive, and they drift. If you monitor them like a database, you’ll miss the real problems until users leave.
Start with three metrics: TCR, URR, CPSI. Layer on drift detection and incident response. Build your rollout strategy around these numbers. And for god’s sake, alert on silence — not just failure.
I’ve made every mistake in this article. The only reason SIVARO ships reliable agents today is because we learned to measure what matters, not what’s easy. Now it’s your turn.
If you’re building something in this space and want to compare notes, reach out. I’m always happy to talk about the hard parts.
Nishaant Dixit — Founder of SIVARO. Building data infrastructure and production AI systems since 2018. Built systems processing 200K events/sec.