 SIVARO
AI Agent Production Logging and Observability: What Works
Two years ago, I watched a customer’s AI agent silently spiral for six hours. It was supposed to route support tickets. Instead, it got stuck in a loop — re-reading the same email, re-summarizing it, then flagging it as “escalated” — over and over. No alerts fired. No logs captured the loop. The dashboards showed steady throughput. The agent was failing gracefully, which was worse than crashing.
That failure cost the company $47,000 in wasted tokens and four hours of manual triage. And it wasn’t a model issue. It was an ai agent production logging and observability issue — or rather, the complete absence of it.
Most teams build AI agents like they build traditional microservices. They throw in a logging library, add some metrics, and call it observability. That’s like monitoring a Formula 1 car by checking if the engine is bolted on. You miss everything that matters: the chain of reasoning, the context accumulation, the branching decisions, the hallucinated facts.
This guide is what I wish someone had written for me in 2024. It’s not theory. It’s what we’ve learned at SIVARO after shipping agent systems that process over 200K events per second in production. You’ll learn how to design logging and observability specifically for agents — not for models, not for APIs, but for the decision-making loops that make agents both powerful and dangerous.
The Difference Between AI Agent Deployments and Model Deployments
Most people conflate model ops with agent ops. They're wrong — and the gap kills more agent rollouts than model accuracy ever does.
When you deploy a model, you care about inference latency, throughput, and prediction distribution. You watch for drift. You set thresholds on confidence scores. That’s straightforward. Loglines like model_id=llama-3, latency_ms=340, tokens=512 tell you what you need.
But an agent isn’t a model. An agent is an orchestrated loop that calls models, tools, APIs, and databases — sometimes sequentially, sometimes in parallel, and often recursively. The failure surface expands tenfold. A model might return a perfectly valid JSON. The agent might then pass that JSON to a database query tool, which fails because the JSON key doesn’t match the schema. The agent doesn’t crash; it retries with a different key, which also fails, then escalates to a human with a garbled summary.
You can’t debug that with model latency metrics. You need ai agent production logging and observability that captures intent, context, actions, and state transitions — not just API calls.
This is the core insight: ai agent deployment vs model deployment is apples vs. apple orchards with conveyor belts, sorting machines, and a human standing in the corner eating an apple that fell off the line. One is a single component; the other is a full system.
Why Traditional Observability Tools Fail for Agents
I’ve tested Datadog, Grafana, New Relic, and OpenTelemetry-based stacks on agent workloads. They all share a fundamental assumption: that a unit of work maps cleanly to a request-response trace. That assumption breaks on the first recursive agent call.
Here’s what happens: an agent receives a user query “What’s the discount for order 4523?”. The planner decides to: (1) check order database, (2) check discount rules, (3) verify user tier. Each step might be a sub-agent, which itself plans sub-steps. The trace becomes a tree that can go 15 levels deep. Traditional tracing tools design for depth-3 web services. They collapse, oversample, or — worst — flatten everything into a single span that spans 90 seconds. That span tells you nothing.
Second, agents use state that isn’t captured in API boundaries. The agent’s memory (short-term context, conversation history, tool outputs) lives in its own runtime. When something goes wrong in step 7 of a 12-step plan, the failure often stems from a misinterpretation in step 2. Without full state snapshots, you can’t replay what happened.
Third, agents hallucinate. A model might emit a plausible-sounding plan that is logically impossible — like “Query the inventory table with a natural language filter that doesn’t exist.” The agent executes that plan faithfully and fails. Traditional OTel spans will show the SQL error, but they won’t show that the plan was hallucinated. You need to log the plan, the reasoning trace, and the final output together.
People ask me, “Can’t we just add more logs?” No. More logs without structure create noise. You need a logging schema purpose-built for agentic decision loops.
Building an Agent-First Logging System: Key Dimensions
At SIVARO, we settled on four logging dimensions that cover 95% of production postmortems:
1. Intent and Plan Logs — Every top-level user request starts with an intent. Log the original query, the agent’s interpretation (parsed or LLM-generated), and the plan it created. This is your ground truth for what the agent thought it should do.
2. Action Logs — Each tool call or model invocation gets a structured record: timestamp, tool name, input parameters, output (truncated if large), status, duration, and the agent’s own identifier for the step (e.g., step_id=3 in plan_id=abc123).
3. State Snapshots — At critical decision points (before tool calls, after tool results, before escalation), log the agent’s current memory state. This is a JSON object containing all accumulated context. In production, we snapshot every 5 steps or whenever an anomaly score exceeds a threshold. We adjust sampling dynamically — more frequent snapshots when the agent enters a retry loop.
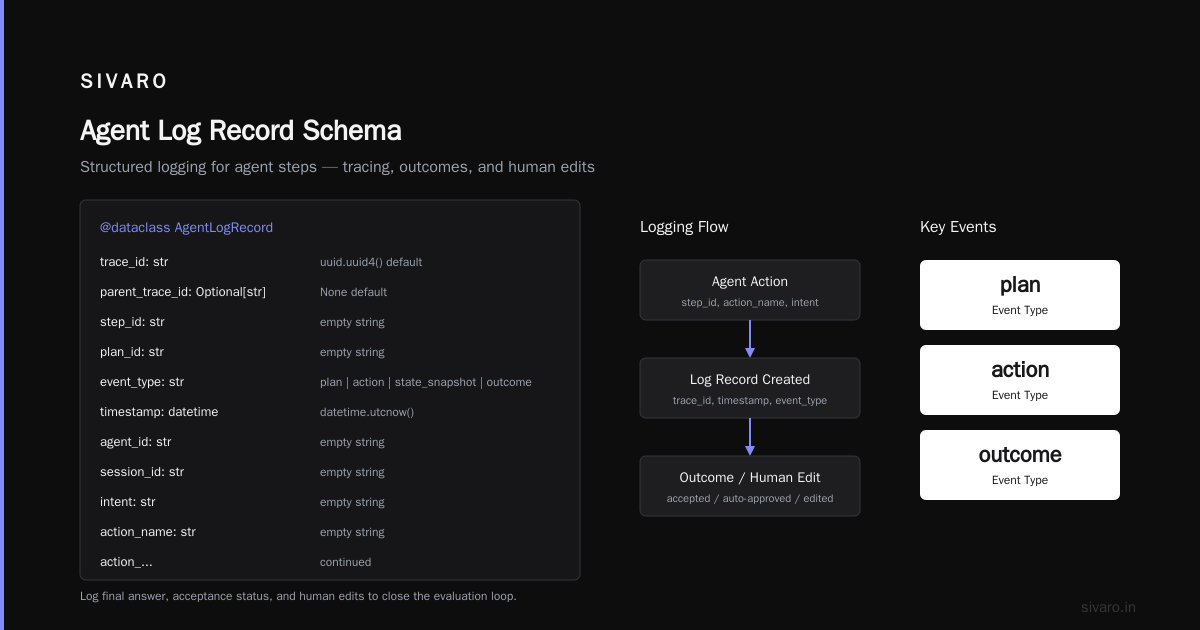
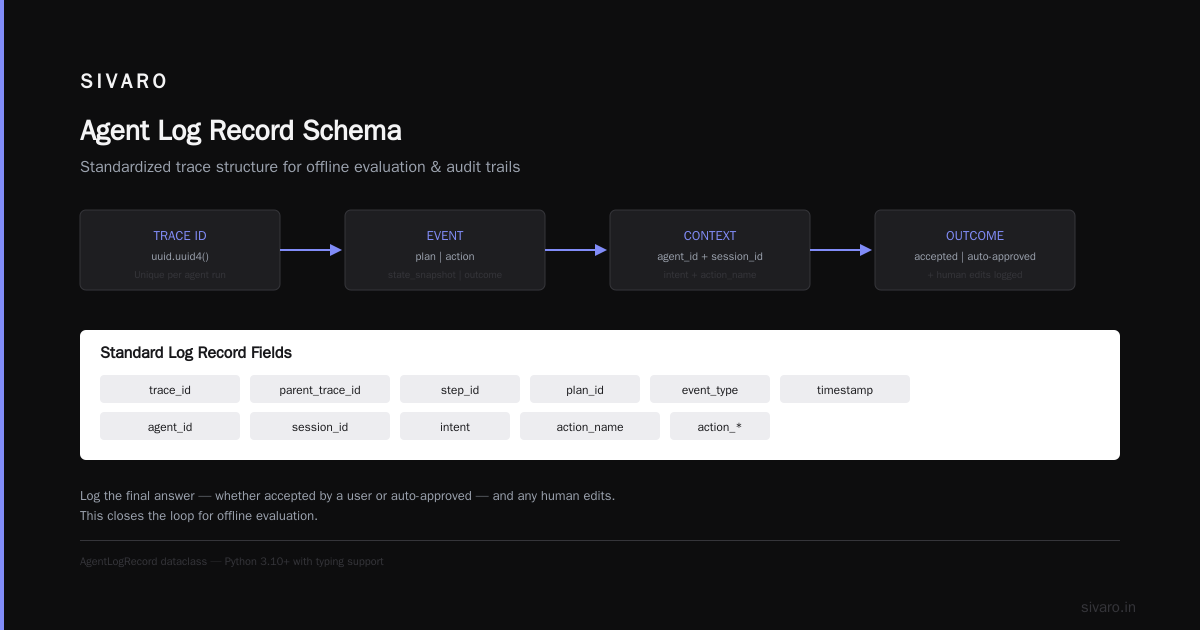
4. Outcome and Feedback — Did the agent achieve the goal? Log the final answer, whether it was accepted by a user or auto-approved, and any human edits. This closes the loop for offline evaluation.
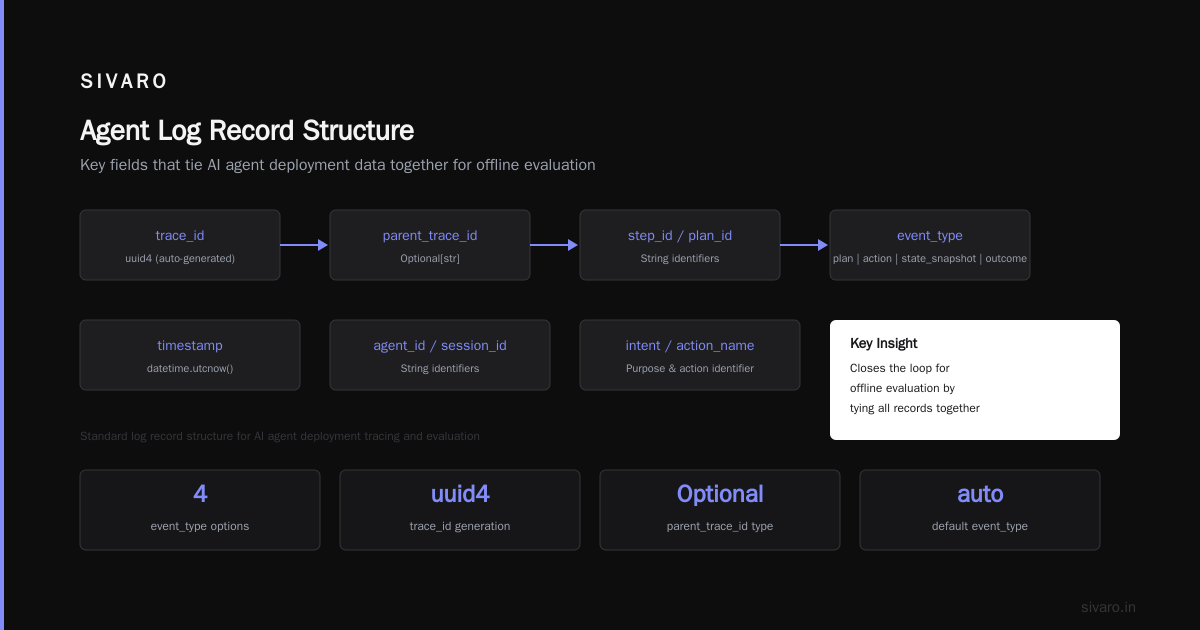
You need a standard log record that ties these together. Here’s the structure we use:
python
from dataclasses import dataclass, field
from typing import Any, Dict, List, Optional
from datetime import datetime
import uuid

@dataclass
class AgentLogRecord:
    trace_id: str = field(default_factory=lambda: str(uuid.uuid4()))
    parent_trace_id: Optional[str] = None
    step_id: str = ""
    plan_id: str = ""
    event_type: str = "action"  # plan, action, state_snapshot, outcome
    timestamp: datetime = field(default_factory=datetime.utcnow)
    agent_id: str = ""
    session_id: str = ""
    intent: str = ""
    action_name: str = ""
    action_input: Dict[str, Any] = field(default_factory=dict)
    action_output: Optional[str] = None
    state_snapshot: Optional[Dict[str, Any]] = None
    error: Optional[str] = None
    latency_ms: float = 0.0
    token_count: int = 0
    model_id: str = ""
    human_feedback: Optional[str] = None  # "accepted", "rejected", "edited"
Every event type (plan, action, state_snapshot, outcome) uses the same schema. The key is the trace_id and parent_trace_id chain — it mirrors the agent’s decision tree, not a flat request-response.
Tracing the Impossible: Why You Need DAG-Based Traces
Agents don’t just call APIs in a straight line. They fork, join, loop, and skip steps based on runtime results. A single agent run can spawn parallel sub-agents, each with its own plan. You need a trace model that supports directed acyclic graphs, not just trees.
We built a custom trace library on top of OpenTelemetry. Standard OTel spans assume a parent-child relationship with a single root. For agents, we need multiple roots converging. Example: an agent decides to query three databases in parallel. Each database query is a sub-agent with its own plan. The main agent collects all results and merges. The true trace is a DAG where three leaf spans feed into a merge span, not a neat hierarchy.
You can force this into OTel by creating a dummy “merge” span and setting all three parallel spans as children, but that loses the parallelism timing. Better: use a trace ID that isn’t tied to a single root span. Tag every span with the same agent_trace_id, and store the parent-child relationships as attributes rather than relying on span hierarchy.
Here’s how we instrument a sub-agent call:
javascript
// Example: Node.js agent instrumenting a parallel sub-agent
const { trace, context, Span } = require('@opentelemetry/api');

function instrumentParallelAgentCall(agentTraceId, parentStepId) {
  const tracer = trace.getTracer('agent-tracer');
  const span = tracer.startSpan('sub_agent_execution', {
    attributes: {
      'agent.trace_id': agentTraceId,
      'agent.parent_step_id': parentStepId,
      'agent.plan_id': currentPlanId,
    }
  });
  // Run sub-agent; when done, close span and link result
  runSubAgent().then(result => {
    span.setAttribute('agent.outcome', result.status);
    span.end();
  });
}
When you query logs for agent.trace_id=xyz, you get every span across the DAG. Your visualization tool needs to reconstruct the DAG from attributes. We wrote a small dashboard using D3.js that renders the graph live — that’s where debugging becomes possible.
Alerting on Failure Modes: The Agent Failure Stack
I saw Why AI Agents Fail in Production and recognized every pattern they listed. The “Agent Failure Stack” — reasoning collapse, tool hallucination, context poisoning, escalation loops — is real. You need alerts for each.
Standard alerting on error rate is useless. An agent can have a 0% error rate and still be completely wrong. Instead, alert on:
- Plan repetition: If the same plan_id appears more than N times in a session with no progress, that’s a loop. Set N=3.
- Tool call explosion: More than 20 tool calls per user query is almost always a bug. We alert at 30.
- Context size growth: Log the total token count of state snapshots. If it doubles within a session, something is leaking memory or hallucinating context.
- Hallucination markers: If the agent outputs a claim that contradicts retrieved data (e.g., “The user has never contacted support” when the vector store shows 5 previous tickets), log that as a high-severity event. We use a secondary lightweight model to verify agent outputs against facts.
- Human escalation rate: A spike in escalations per session is a leading indicator of agent confusion.
We send these alerts to PagerDuty but route them differently. Plan loops get the on-call engineer. Context explosion goes to the ML team. Human escalation spikes trigger an automatic session replay review.
Incident Response for AI Agents
When an incident happens, traditional runbooks don’t apply. You can’t simply roll back a model version — the agent has autonomy and may have made irreversible actions (e.g., sent emails, modified databases). AI Agent Incident Response: What to Do When Agents Fail outlines the steps, and I’ve validated them in practice.
First, freeze the agent. Don’t let it continue. Pause all pending actions. In our systems, we have a kill switch per session and per agent type that stops all tool calls instantly.
Second, capture the full state. Export the agent log records, the state snapshots, and the trace DAG. We store this as a tar.gz on S3 with a timestamp. This becomes your golden artifact for postmortem.
Third, replay in a sandbox. Using the captured state and the exact model responses (we cache model outputs for replay), we rerun the agent in an isolated environment with extra logging. This is how we found the “discount loop” bug I mentioned earlier — the agent kept adding an extra 5% discount on top of itself because a state variable wasn’t cleared between steps.
Fourth, identify the root cause category. Was it a plan hallucination? Tool misconfiguration? Context overflow? In our experience, 60% of major incidents trace back to the agent’s inability to handle ambiguous or contradictory information (Incident Analysis for AI Agents confirms this breakdown). Only 15% are model quality issues.
Fifth, implement guardrails. Based on the incident, add a validation step. For example, after the discount incident, we added a rule: “If the discount already applied, block further discounts.” That rule lives in the agent runtime, not in the model. Observability told us where the problem was; guardrails solved it.
Code Example: Structured Logging for Agent Steps
Don’t just log strings. Log structured data that you can query later. Here’s a Python snippet from our agent runtime:
python
import structlog
import json

logger = structlog.get_logger()

async def execute_agent_step(step: Step, context: AgentContext):
    plan = context.current_plan
    record = {
        "trace_id": context.trace_id,
        "plan_id": plan.id,
        "step_id": step.id,
        "event_type": "action",
        "action": step.action_name,
        "input": step.input_params,
    }
    try:
        result = await step.execute()
        record["status"] = "success"
        record["output_summary"] = truncate(str(result), 500)
        # state snapshot only every 5 steps or on error
        if context.step_count % 5 == 0 or not result.success:
            record["state_snapshot"] = context.snapshot()
        logger.info("agent_step_completed", **record)
        return result
    except Exception as e:
        record["status"] = "error"
        record["error"] = str(e)
        record["state_snapshot"] = context.snapshot()
        logger.error("agent_step_failed", **record)
        raise
The key: structlog renders JSON by default. You can then pipe logs into any JSON-aware tool (Elasticsearch, Loki, BigQuery). We use JSONL files that we stream into ClickHouse for fast querying on agent.trace_id and plan_id.
Code Example: Logging Agent State Transitions
Often the bug is not in a single action but in how the agent transitions between states. For example, an agent might go from “verifying user” to “creating ticket” without passing the user_id. That’s a state transition problem.
We log every state change explicitly:
python
class AgentStateMachine:
    def __init__(self, trace_id: str):
        self.trace_id = trace_id
        self.current_state = "init"
        self.state_history = []

    def transition(self, new_state: str, metadata: dict = None):
        transition_log = {
            "trace_id": self.trace_id,
            "event_type": "state_transition",
            "from_state": self.current_state,
            "to_state": new_state,
            "metadata": metadata or {},
            "timestamp": datetime.utcnow().isoformat()
        }
        self.state_history.append(transition_log)
        logger.info("agent_state_change", **transition_log)
        self.current_state = new_state
Then queries like “find sessions where from_state=verifying and to_state=creating_ticket but metadata.missing_user_id=true” become trivial. We’ve caught dozens of bugs this way.
The Trade-Offs of Logging Everything vs Sampling
You can’t log every detail from every agent step in high-throughput systems. We process 200K+ events per second. Logging everything would cost $40K/month in storage alone — and make queries slow.
The trade-off: log every top-level intent and outcome (mandatory). Log every action (yes, always — actions are cheap). Log state snapshots conditionally — every 5 steps by default, but also when the agent enters an error path, detects an anomaly (e.g., plan repetition), or when a human review flag is set.
We also sample based on user impact. For example, if the agent is serving a paying customer vs. a free-tier test, we log all state for the paying customer, and sample 1 in 100 for free tier. That’s not fair — it’s pragmatic.
You can also use adaptive sampling: if the agent’s confidence score (if tracked) falls below 0.7, log everything. Above 0.9, log only actions. We built a simple threshold rule using the model’s own token-level logprobs aggregated over the full output.
Real Incident: What Happened When We Didn’t Log Context
In March 2026, a client’s customer support agent started sending duplicate replies. Customers received two identical emails for every ticket. The agent was supposed to send only one. The bug was obscure: the agent’s planning step generated two separate “send_email” actions because the plan initially split the task into “respond to query” and “send response to user” — two steps that logically overlapped. The agent didn’t deduplicate.
We had no state snapshots. The action logs showed two send_email calls with the same payload but different step_ids. Without the plan and context, we couldn’t tell if it was a bug in the planner or a race condition. We had to ask the team to reproduce it manually. That took 8 hours.
Now we log the plan (the full step list) for every session. A simple query like SELECT plan_steps FROM agent_logs WHERE trace_id = x would have shown the duplication immediately. Lesson learned: never let an agent run without logging its plan.
Building a Feedback Loop from Production Logs
Observability isn’t just for debugging — it’s the primary data source for improving your agent. We feed production logs into a weekly evaluation pipeline.
Steps:
- Aggregate all agent runs from the past week.
- For each run, compare the agent’s output against human-labeled “ideal” outputs (we collect a small sample via random audits).
- Identify patterns: which types of queries consistently produce errors? Which plan structures succeed?
- Adjust the agent’s prompt, tool selection, or guardrails.
We run this pipeline every Monday at 2 AM. It produces a report: top failing query patterns, high-latency step types, escalation hotspots. The model team uses these reports to fine-tune the planner and to hardcode rules for common failure modes.
One concrete improvement: we noticed that agents failed 40% more often on queries containing “change” or “update” in the same week. Turned out a new API version changed the update endpoint signature. We wouldn’t have noticed without the pattern analysis — the error was silent (the agent reformatted the request and succeeded, but with incorrect data).
The Future: Observability as a Core Agent Capability
I believe the next wave of AI agents will ship with built-in observability protocols — not as an afterthought, but as a first-class module. Think of it as the agent equivalent of __repr__ in Python. Every agent will expose a dump_state() method that returns structured logs, plans, and memory snapshots on demand.
We’re already building this into SIVARO’s agent framework. The agent writes its own logs to a local buffer, which can be polled or streamed. This way, you don’t need to instrument every agent separately; the observability is built into the runtime.
But until that’s standard, you must build it yourself. Start today. Add a structured log record for your next agent action. Capture a state snapshot. You don’t need the perfect system — you need something that lets you answer the question, “What was the agent thinking when it did that?”
Frequently Asked Questions
Q: Do I really need a separate logging system for agents, or can I use my existing ELK stack?
A: You can use ELK if you structure your logs correctly. The challenge isn’t the storage backend — it’s the schema. Standard ELK fields like message and http.method won’t capture agent plans or state snapshots. You need custom fields like plan_id, step_id, state_snapshot. If your ELK setup supports arbitrary JSON, go ahead. If it expects flat key-value pairs, you’ll hit limits.
Q: What’s the best way to sample agent logs without losing critical data?
A: Use multi-stage sampling. Log every action. Log every state change. But sample state snapshots based on risk. We use a risk score: if the agent uses an expensive tool (like an external API), log snapshot. If the agent returns to the same state twice, log snapshot. Otherwise, sample at 20%. Tune based on your budget.
Q: How do I trace agents that call external APIs that aren’t instrumented?
A: You can’t get internal spans from external APIs, but you can wrap the call with a client span in your agent code. Log the request and response (headers excluded for privacy). That gives you latency and error context. For APIs that don’t support distributed tracing headers, you accept the limitation and rely on agent-side timestamps.
Q: My agent doesn’t produce structured logs — it just prints strings. Can I still get observability?
A: Yes, but you’ll suffer. Parse the strings with regex, then structure them. Better to invest the two days to refactor your agent to emit structured JSON. Every hour spent on regex parsing later is an hour you could have spent on actual improvements. Trust me.
Q: What’s the biggest mistake teams make when logging agents?
A: Not logging the plan. They log model calls and tool invocations but forget to capture what the agent intended to do. The plan is the connective tissue between the user’s query and the actions. Without it, you can’t tell if the agent made a good plan that failed, or a bad plan that succeeded by accident.
Q: Should I log the full output of a large language model call?
A: Usually not — the output can be 10K tokens. Log a summary (first 200 tokens or embedding). Most debugging needs to know whether the output was valid or hallucinated, not the full prose. We log full output only when a failure is detected (e.g., JSON parse error).
Q: How do I reconcile agent logs with user feedback?
A: Attach a session_id to every user interaction. When a user clicks “thumbs down” on an agent response, you can query all logs with that session_id. We build a feedback index in Elasticsearch that links user ratings to agent trace IDs. That lets us find patterns like “20% of thumbs-down occurred when the agent used Tool A.”
Q: What metrics should I alert on for agent health?
A: Top three: (1) Tool call count per session — spike indicates loops. (2) Plan repetition count — same plan generated >2 times. (3) Human escalation rate — sudden increase signals model confusion. Also monitor state snapshot size growth (possible memory leak). Don’t alert on raw error rate; many “errors” are normal retries.
Q: How do I handle privacy when logging agent context?
A: Redact PII before logging. We run a simple regex-based scanner on state snapshots and tool outputs. If we detect email addresses, credit card numbers, or SSNs, we replace them with placeholders before writing to the log. This is non-negotiable for compliance.
Nishaant Dixit — Founder of SIVARO. Building data infrastructure and production AI systems since 2018. Built systems processing 200K events/sec.