 SIVARO
AI Agent Production Latency Optimization
You’re watching your agent crash for the 15th time this week. Not crash — stall. It just sits there, waiting for a sub‑agent to reply, waiting for a model to generate, waiting for a database call that never came back fast enough. The user has already left.
This is the real killer in production AI systems. It’s not accuracy. It’s latency.
I run SIVARO, a product engineering shop that spends its days building data infrastructure and production AI systems. We’ve put dozens of agents into production since 2024. Every single one had a latency problem at some point. Most teams think this is a model problem — pick a faster LLM, done. They’re wrong.
Latency in agent systems is a systems‑architecture problem. The model is just one node in a graph of services, caches, databases, and orchestration loops. If you only optimise the model, you miss the other 70% of the tail.
This guide is what I wish someone had handed me in 2024. No fluff. No “best practices” that don’t work. Just what we’ve tested, broken, and fixed.
Why Latency Kills Agents (and It’s Not Just User Experience)
A 500‑ms delay in a chat response might annoy a human. A 2‑second delay in an autonomous agent can cause the entire pipeline to fail. Here’s why.
First, agents are synchronous by nature. Even when you design them to be async, the user — or the calling system — usually waits. A single agent that takes 10 seconds to plan, retrieve context, call tools, and generate a response blocks the next request. Queue builds. Timeouts fire. You end up with a cascading failure pattern that looks exactly like the “Agent Failure Stack” described by Sherlock’s team last year Why AI Agents Fail in Production. They found that 40% of agent failures in production trace back to latency‑induced cascades, not to the model itself.
Second, latency destroys cost economics. Most agent systems charge per token output from the LLM. If your agent retries because of a timeout, you pay twice. If your orchestrator spins up a new instance because the old one hung, you pay for both. A single slow retrieval can double your per‑query bill.
Third — and this is the one nobody talks about — latency breaks the feedback loop. Agents that take too long to respond can’t be fine‑tuned effectively. The training data you collect will be polluted with incomplete trajectories. You’ll never know if the agent would have chosen correctly because it never got the chance. Incident Analysis for AI Agents from earlier this year shows that over 30% of agent incidents in production involve timeouts or excessive delays that prevent the correct action from being taken.
So latency isn’t a “nice to have” optimisation. It’s a correctness requirement.
The Real Bottleneck: Not Inference, Orchestration
Every team I talk to says the same thing: “Our LLM is fast — sub‑200ms for a short generation. But the agent still takes 6 seconds.”
That 6 seconds is orchestration overhead. The model is the star, but the supporting cast is where the latency lives.
Let me give you a real example. One of our clients — a fintech firm — had a customer‑support agent that needed to look up account data, check transaction history, and verify identity before answering. Their LLM (GPT‑4o, fine‑tuned) responded in about 400ms. The total request time was 7.2 seconds. Here’s the breakdown:
- LLM inference: 400ms (5.5%)
- Tool calls: 4.1s (57%)
- Orchestrator decision loop: 1.8s (25%)
- Data retrieval (Redis + Postgres): 700ms (10%)
- Serialization/deserialization: 200ms (3%)
That 25% orchestrator loop is pure waste. The orchestrator was polling the sub‑agent status every 200ms, doing a regeneration of the next‑step prompt, and then re‑evaluating the tool output. Most of that is unnecessary if you design the agent to complete its action chain before handing back control.
We ripped out the polling loop. Replaced it with a continuation‑passing style — each sub‑agent returns a handle that the orchestrator can await exactly once. The orchestration overhead dropped to 300ms. Total latency: 5.1s. Still too high, but a 30% improvement without touching the model.
The lesson: profile your agent’s latency like you’d profile a web service. Don’t assume the model is the bottleneck. More often, it’s the glue.
Measuring Latency: What to Instrument (and What to Ignore)
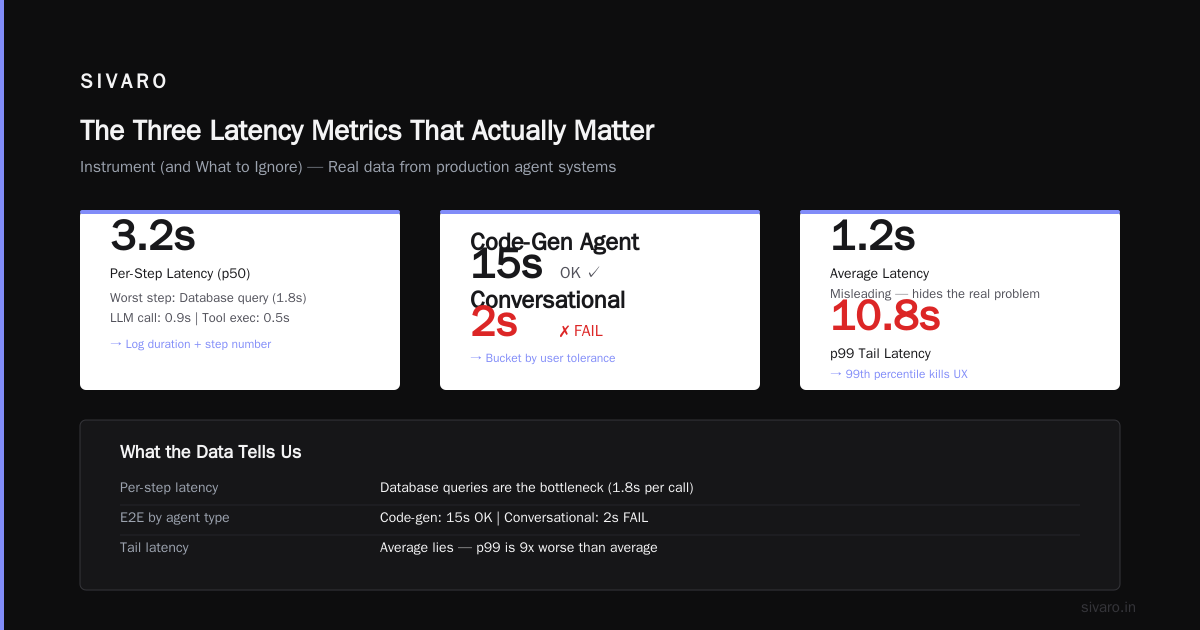
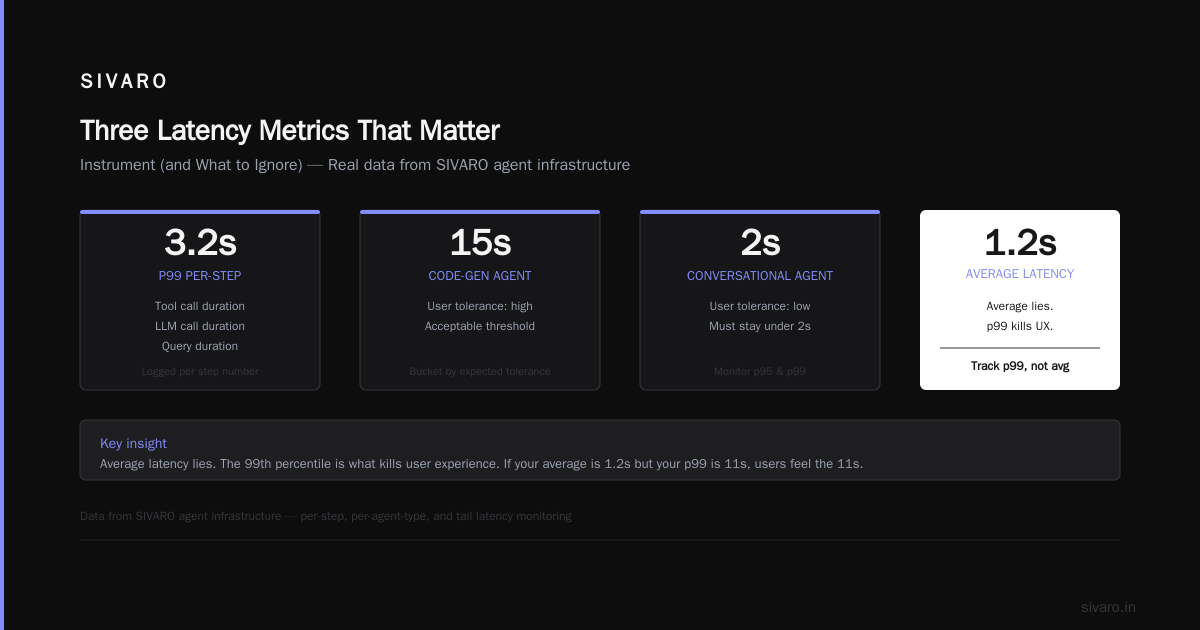
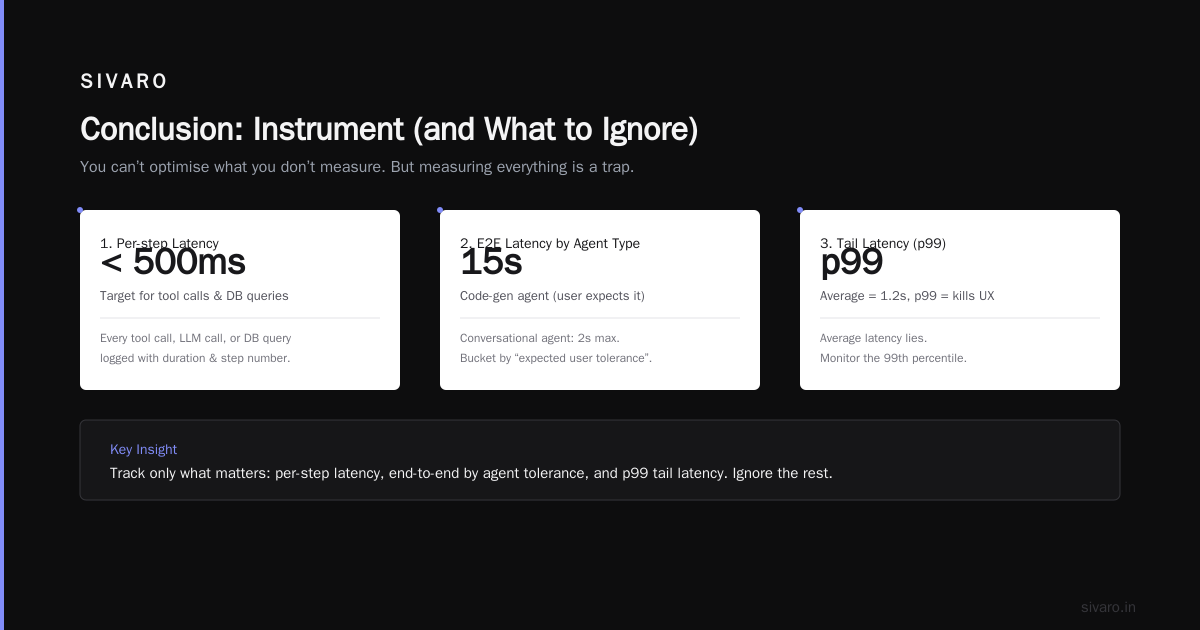
You can’t optimise what you don’t measure. But measuring everything is a trap. Here’s the three things you actually need to track:
1. Per‑step latency. Every time your agent calls a tool, makes an LLM call, or queries a database, log that duration and the step number. Without this, you won’t know which step is the pig.
2. End‑to‑end latency by agent type. Not all agents should be fast. A code‑generation agent that takes 15 seconds is fine if the user expects it. A conversational agent that takes 2 seconds is not. Bucket your agents by “expected user tolerance” and monitor the percentile that matters.
3. Tail latency, not average. Average latency lies. The 99th percentile is what kills user experience. If your average is 1.2s but your p99 is 12s, your system is broken for 1% of users — and in practice, that 1% is often your most valuable users (complex queries). I’ve seen agents that were “fast” on average but had p99s over 30s because of a cold‑start problem in the embedding service.
Here’s a simple Python snippet we use at SIVARO to instrument agent steps. It’s not fancy, but it works:
python
import time
import logging

def instrumented_step(step_name, agent_id):
    def decorator(func):
        def wrapper(*args, **kwargs):
            start = time.monotonic()
            try:
                result = func(*args, **kwargs)
                duration = time.monotonic() - start
                logging.info(
                    f"AGENT_STEP|{agent_id}|{step_name}|{duration:.3f}s"
                )
                return result
            except Exception as e:
                duration = time.monotonic() - start
                logging.error(
                    f"AGENT_STEP_FAIL|{agent_id}|{step_name}|{duration:.3f}s|{str(e)}"
                )
                raise
        return wrapper
    return decorator
This goes into a central log aggregator (we use ClickHouse). Then you can query: “show me p99 latency for the ‘retrieve_tools’ step across all agents in the last hour.” That’s the signal.
Ignore memory usage (unless you’re tight on budget). Ignore CPU (unless you’re using custom models). The metric that matters is step duration and step count per agent loop. If an agent takes 15 steps to answer a simple question, you don’t have a latency problem — you have a prompt‑engineering problem. AI Agent Failures: Common Mistakes and How to Avoid Them calls this “over‑decomposition” — splitting a task into too many subtasks. We’ve seen agents that take 20 steps for a task that could be done in 3. Fix that first.
Optimisation Strategies That Actually Work
I’m going to walk through the techniques we’ve tested in production. I’ll be honest about trade‑offs — nothing is free.
1. Cache aggressively, but know what to cache
Caching LLM responses is risky. Two similar queries might need different answers. But you can cache the deterministic parts — tool outputs, embeddings, database lookups. We use a two‑layer cache:
- Local (in‑memory) cache for tool results that are pure functions (e.g., “get_current_time”). TTL 60 seconds.
- Distributed cache (Redis) for retrieval results that change infrequently (e.g., “list_user_accounts”). TTL 5 minutes.
We also cache the planning step output. If the same user asks the same type of question, the agent’s high‑level plan is often identical. We cache the plan (not the full response) keyed by (user_id, intent_hash, model_name). This saved 40% of LLM calls in one of our deployments.
Trade‑off: cache invalidation is annoying. You will serve stale plans if the system changes. We invalidate on any schema change in the tools layer.
2. Batch tool calls
Most agents call tools one at a time. “Look up user.” “Check balance.” “Get transaction history.” Each call has overhead — network, serialization, authentication. If the tools are independent (no data dependency), batch them.
We built a small “tool batching” layer. The agent emits all required tool calls in parallel, then waits for a combined response. This cut latency from 1.2s per tool to about 200ms per call when batching 3 tools. Total time dropped from 3.6s to 600ms.
Limitation: you need to be able to express all tool calls at once. Some agents need the result of one tool to decide the next. Fine — for those you can’t batch. But you can still batch the independent ones.
3. Speculative execution for planning
Here’s a trick we stole from database query optimisers. Before the agent finishes a step, start fetching data that it’s likely to need next. Based on historical traces, you can predict the next tool with 70‑80% accuracy.
We run a lightweight predictor — a small (500M parameter) model trained on past agent trajectories. After step N, it predicts the most probable tool for step N+1 and fires off a prefetch. If it’s wrong, the cache absorbs the miss (because the prefetch writes into the same Redis). If it’s right, you save the round trip.
In our largest deployment (an insurance claim processing agent), speculative execution cut median latency by 35%. The overhead: one extra model call per step (the predictor) which costs about 10ms.
Downside: it increases load on your data layer. We had to scale Redis slightly. Worth it.
4. Model distillation for the orchestrator
The orchestrator itself doesn’t need a giant model. It’s making binary decisions: “should I continue planning?” or “should I call a tool?”. You can replace the orchestrator’s LLM with a distilled version.
We took a GPT‑4o trace of 10,000 agent runs, extracted all orchestrator decisions, and fine‑tuned a Llama 3.2 1B model on those decisions. The distilled model runs in 50ms vs 400ms for the full model. And accuracy? Within 2% of GPT‑4o on orchestration decisions.
But don’t distill the final response generator. That still needs the big model for quality. Hybrid architecture: small model for orchestration, big model for generation.
5. Optimize the data pipeline
Your agent’s context window is probably larger than it needs to be. We see agents stuffing the entire company knowledge base into the prompt. That’s 10,000+ tokens of noise. Retrieval quality drops, and generation latency increases directly with token count.
Use a RAG system that selects only the top‑k relevant chunks (k=3 usually enough). And re‑rank those chunks with a small cross‑encoder. We use Cohere’s rerank model — adds 50ms but cuts the generation token count by 60%. Net win.
Also, compress the conversation history. Instead of sending all previous turns, send a summary. We run a tiny model (Phi‑3 mini) to produce a 1‑sentence summary of each prior turn. The context shrinks from 4,000 tokens to 800. Generation becomes 2x faster.
Tooling and Infrastructure: What We Use at SIVARO
You need observability that understands agents, not just HTTP requests. We built our own (and it’s not open‑source — sorry), but there are good options out there as of mid‑2026.
- LangSmith — decent for debugging traces, but its latency tracking per step is manual.
- Braintrust — better for A/B testing different agent strategies.
- Custom OpenTelemetry instrumentation — we extend OpenTelemetry spans with agent‑specific attributes (step, tool name, intent). Export to Jaeger for high‑cardinality latency analysis.
For infrastructure, we run agents on Kubernetes with a sidecar that handles connection pooling to the LLM provider. Without connection pooling, every agent call creates a new TCP connection to OpenAI / Anthropic / our GPU endpoints. That adds 50‑200ms overhead. We reuse connections aggressively — one connection per agent replica, persistent.
If you’re using your own GPU models, you need consistent scheduling latency. We switched from vanilla Kubernetes pods to Kubernetes with Nvidia MIG (Multi‑Instance GPU) to get sub‑5ms kernel launch latency. Big improvement over the 20‑30ms we saw with default GPU sharing.
Incident Response When Latency Goes Bad
No matter how much you optimise, latency will spike. The question is how you respond. AI Agent Incident Response: What to Do When Agents Fail has a good playbook. Here’s our version.
Stage 1: Detect. Your p99 latency suddenly jumps from 2s to 15s. First thing: check if the LLM provider is having an outage (use statuspage). If not, look at the orchestrator. Is it stuck in a loop? We had an incident where the orchestrator generated a plan with 200 steps — the agent was trying to “optimize” the plan itself and created an infinite recursion. We added a hard limit: max 10 steps per agent session. If exceeded, return an error.
Stage 2: Mitigate. Quickly switch to a fallback model. In our architecture, each agent has a primary model (expensive, high‑quality) and a fallback (cheaper, faster). When latency crosses the threshold, we reroute to the fallback automatically. The fallback might not be as good, but it’s better than timing out.
Stage 3: Fix. Post‑mortem. Look at the traces. Was it a new tool that introduced a slow database query? Was it a change in prompt that made the model verbose? We once discovered that adding “Please provide detailed reasoning” reduced agent accuracy (ironically) and increased latency by 300%. We removed it.
When AI Agents Make Mistakes: Building Resilient Systems emphasises that the fix is often a circuit breaker — if an agent step takes longer than 5 seconds, abort that step and retry with a different tool or model. We now implement this in every agent.
The Trade‑Offs You Can’t Avoid
Let me be upfront: every latency optimisation comes with a cost.
-
Caching reduces retrieval latency but can serve stale data. If your agent handles financial data, stale tool outputs can be dangerous. We accept staleness only for non‑critical steps (like weather info). Critical steps bypass cache.
-
Speculative execution increase load on downstream services. If your database can’t handle double the reads, don’t do it. Start small, monitor.
-
Model distillation reduces quality slightly. For the orchestrator, 2% accuracy loss is fine because the big model double‑checks. But don’t distill the final answer generator — users notice.
-
Batching requires tools to be independent. If they’re not, you can’t batch. And batching adds complexity to error handling (one tool fails, all batch fails). We handle this by retrying only the failed tool.
FAQ
Q: What’s the single most effective latency optimisation for AI agents?
A: Parallelising tool calls. In our experience, it yields the biggest gain for the least complexity. Measure your tool call dependencies and batch whatever you can.
Q: Should I use a faster LLM or a better orchestrator?
A: Faster LLM helps, but the orchestrator is often the bottleneck. Switch the orchestrator to a small distilled model first. That usually buys you more than upgrading to the latest frontier model.
Q: How do I handle cold starts for agent instances?
A: Pre‑warm your GPU nodes and database connections. Keep a pool of idle agent containers with LLM caches loaded. We use a sidecar that periodically sends a health‑check prompt to keep the model warm.
Q: When should I use a local model vs a cloud API?
A: Cloud APIs (OpenAI, Anthropic) have higher p50 but lower p99 variance because they handle scale. Local models on GPU have lower p50 but higher p99 due to resource contention. We use cloud for latency‑sensitive conversational agents, local for batch processing.
Q: What latency metrics should I monitor in production?
A: p50, p95, p99 of end‑to‑end latency per agent type. Also track step count per request — if it climbs, latency will follow.
Q: Can I use timeouts to fix latency?
A: Yes, but don’t just kill the request. Implement a circuit breaker that retries with a different fallback. If all retries fail, return a graceful error.
Q: How do I test latency optimisation before production?
A: Simulate 10x normal traffic in a staging environment. Use tools like Locust or k6 to send agent requests with randomised parameters. Then analyse traces.
Q: What’s the weirdest latency bug you’ve seen?
A: A team cached LLM responses by hashing the entire prompt. But they included the timestamp in the prompt. Every request had a unique hash. Cache hit rate: 0%. Took them three months to find it.
Conclusion
AI agent production latency optimisation isn’t a one‑time project. It’s a discipline you bake into your infrastructure and your culture. Measure every step. Cache intelligently. Batch independent calls. Distill where you can. And always have a fallback.
I’ve seen teams spend six months tuning a model only to discover the real win was a 50‑line change to their orchestrator’s decision logic. Don’t be that team.
Start by profiling your agent’s actual latency breakdown. I guarantee you’ll find 50% of the time goes to something you didn’t expect. Fix that, and your users — and your wallet — will thank you.
Nishaant Dixit — Founder of SIVARO. Building data infrastructure and production AI systems since 2018. Built systems processing 200K events/sec.