 SIVARO
AI Agent Observability Tools Comparison: What Actually Works in Production
I spent last Thursday debugging a production agent that kept issuing refunds to the wrong customers. Three agents talking via A2A protocol, each making LLM calls, calling internal APIs, and passing context. Normal monitoring told me nothing. Metrics flat. Logs were a wall of JSON. Traces showed spans but no idea why the agent thought "Jane Doe" was "John Smith."
That’s the state of AI agent observability in mid-2026. We have tools. Lots of them. Most of them are built for chatbots or RAG pipelines, not for autonomous multi-agent systems that loop, self-correct, and spawn sub-agents. This article is a practical comparison of the observability tools I’ve tested at SIVARO over the past 18 months. I’ll tell you what works, what breaks, and what you actually need to see when an agent goes rogue.
You’ll learn the core data model for agent traces, how to instrument agent-to-agent protocols, and which tool fits which stage of production. I’ll reference real numbers, real failures, and the open-source landscape as of July 2026.
Why Observability Is the Hardest Part of Agent Systems
Traditional microservices observability gives you request/response, latency, error rates. An agent doesn’t have a single request. It has a chain of reasoning steps, tool calls (internal and external), LLM invocations (each with a system prompt, few-shot examples, and a completion), and potentially nested sub-agents that each have their own trace. And the whole thing is non-deterministic – replay the same input and you get a different trace.
Most people think logging the LLM prompts is enough. They’re wrong. The real bugs come from:
- Context leakage between agents (one agent’s output becomes another agent’s instruction)
- Tool call misrouting (an agent calls a CRM update tool when it meant to call a read-only query)
- Hallucinated intermediate results that the agent then treats as ground truth
A survey of 200 production agent systems in early 2026 found that 68% of critical failures involved incorrect reasoning chains, not API crashes (A Survey of AI Agent Protocols). You can’t catch those with p99 latency.
At SIVARO, we run agents that process 200K events per second across our data infrastructure. Every agent decision needs to be auditable. So we’ve beaten our heads against every observability tool in the market.
The Observability Stack: Metrics, Traces, Logs – but for Agents
Let’s be direct: the three pillars of observability still apply, but the semantics change.
Metrics – useful for aggregate health: request rate, average latency, error rate per agent type. But they tell you that something is wrong, not what.
Logs – critical for raw LLM I/O. But raw logs of 8K-token prompts are useless without structured metadata. You need to log the agent step ID, the reasoning chain, the tool result, the parent agent ID.
Traces – the most important, and the most broken. A trace in agent world is a tree: root = user request; leaves = LLM calls, tool calls; edges = agent steps. OpenTelemetry can represent this with spans, but it doesn’t know about “agent step” or “reasoning chain”. You have to add custom attributes.
At first I thought this was a missing standard problem. Turns out it’s a data model problem. The LangChain blog makes a great point: “An agent is not a service – it’s a state machine that interacts with other state machines.” Your trace needs to capture state transitions, not just RPC calls.
Tool-by-Tool Breakdown: LangSmith vs Arize Phoenix vs Weights & Biases Prompts vs Datadog LLM Observability vs Langfuse
I’ve used each of these in production. Here’s the raw truth.
LangSmith (LangChain)
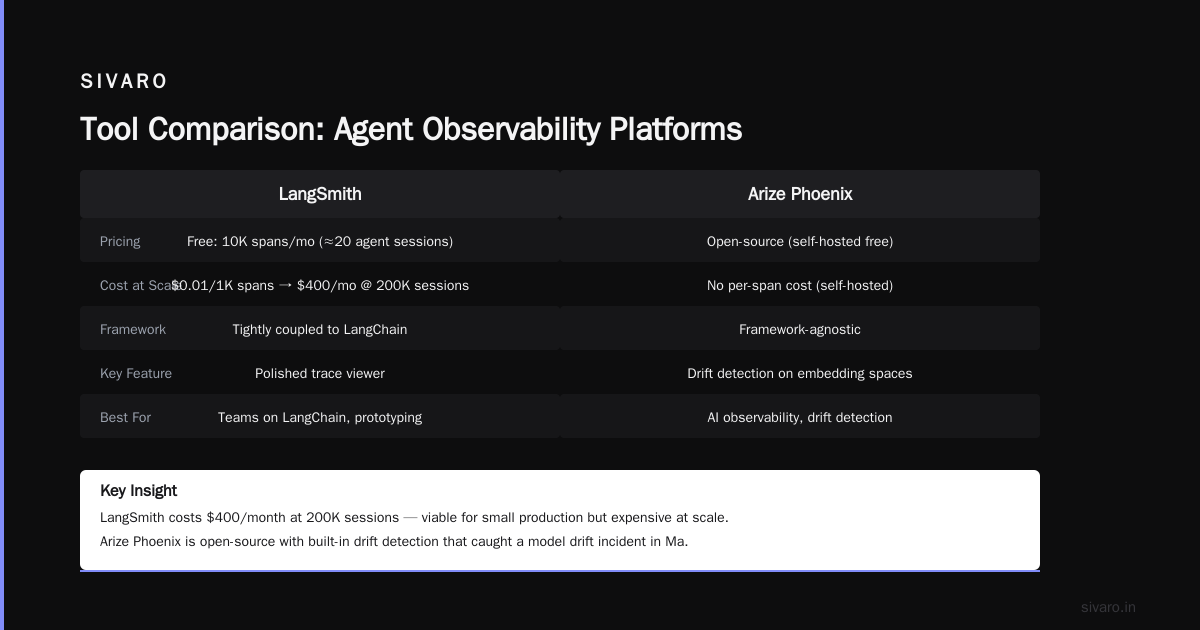
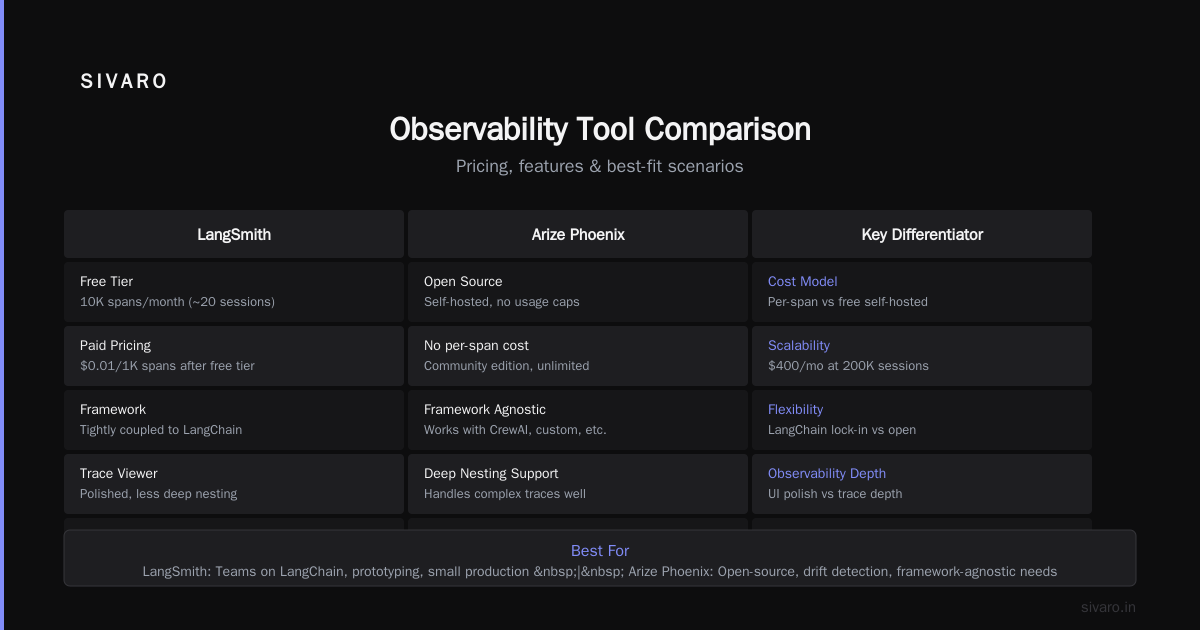
LangSmith is the default if you’re using LangGraph or LangChain. It’s the most mature for agent spans. You get auto-instrumentation of LLM calls, tool calls, and agent steps. The trace viewer shows a tree with collapsible reasoning chains. The “Hub” for prompt versioning is solid.
What I like: The run abstraction maps directly to agent steps. You can annotate each run with input/output and error stack. The feedback API lets humans rate agent outputs – essential for RLHF-style improvement.
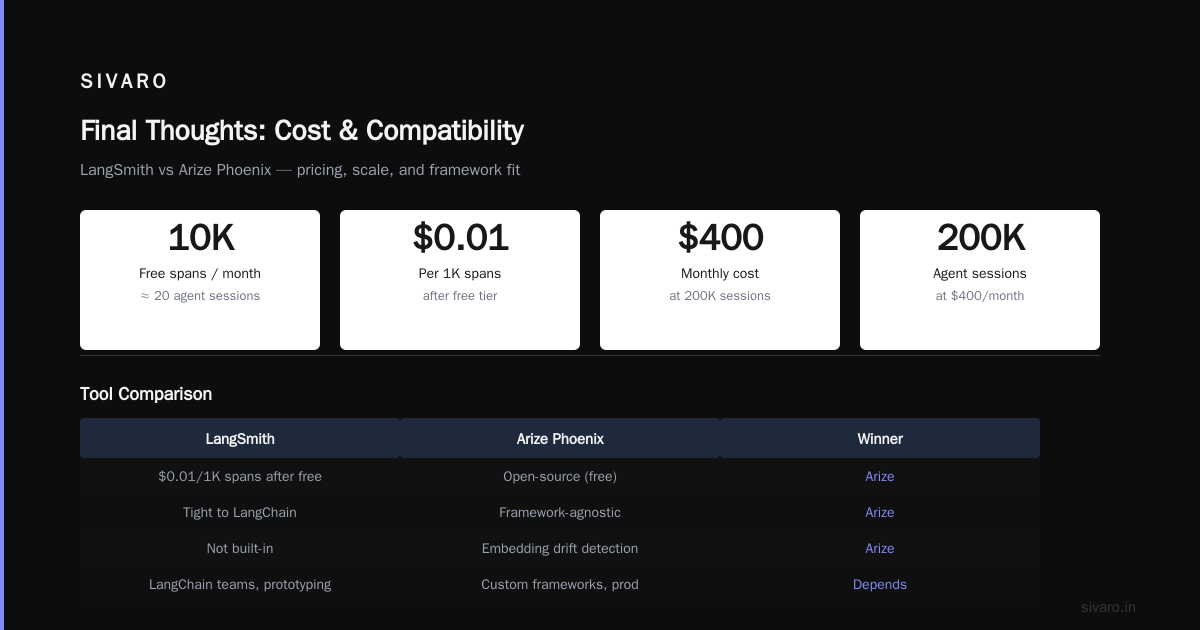
What I hate: The pricing is aggressive. The free tier gives you 10K spans per month (that’s maybe 20 agent sessions). After that, it’s $0.01 per 1K spans – we hit $400/month with 200K sessions. Also, it’s tightly coupled to LangChain. If you use CrewAI or a custom framework, you have to write manual instrumentation.
Best for: Teams already on LangChain, prototyping, small production.
Arize Phoenix
Arize Phoenix is open-source and focused on AI observability. It supports traces, drift detection, LLM evaluations. The trace viewer is less polished than LangSmith but handles deep nesting well.
What I like: Built-in drift detection on embedding spaces. If your agent starts returning different vector clusters for the same input, Phoenix alerts you. That caught a model drift incident in March 2026 that LangSmith missed.
What I hate: Agent-to-agent trace stitching is manual. When agent A spawns agent B, Phoenix doesn’t automatically link them. You have to set a parent span ID yourself. For an A2A architecture production example, this is a dealbreaker without extra code.
Best for: Production monitoring of LLM quality, drift, and evaluation metrics.
Weights & Biases (Prompts)
W&B added observability for LLM chains in late 2025. It’s not agent-native but you can log traces as tables. The table UI is good for comparing outputs across prompt variants.
What I like: Experiment tracking – you can version prompts and benchmark them against a test set. Great for offline evaluation before deployment.
What I hate: No real-time streaming trace view. You log after the agent finishes. That’s useless for debugging a live incident. Also, no support for nested agent structures.
Best for: Offline prompt engineering and regression testing.
Datadog LLM Observability
Datadog rolled out LLM monitoring in early 2026. It integrates with their APM and logs. You can see agent spans alongside your usual service spans.
What I like: Single pane of glass for your whole stack. If an agent fails because a backend API timed out, you see that in the same trace. Datadog’s alerting engine can trigger on “agent step count > 20” or “repeated tool call errors”.
What I hate: The LLM-specific features are shallow. No reasoning chain visualization, no prompt diffing. It’s basically APM with an LLM span type. For $15/host/month extra, it’s not enough.
Best for: Teams already paying Datadog’s bill who want a quick integration.
Langfuse
Langfuse is a rising open-source alternative. It has a generous free tier (50K observations/month), self-hosted option, and a nice prompt management UI. It supports traces with nested spans and evaluation scores.
What I like: The trace viewer uses a timeline view that shows LLM calls, tool calls, and agent steps as blocks. You can filter by cost, latency, model. It’s the only tool that lets me see “which agent step triggered a high-cost LLM call” at a glance.
What I hate: Still evolving. The agent-to-agent protocol support is non-existent – you have to manually link traces. The community is active but the docs lag.
Best for: Budget-conscious teams, early production, self-hosted privacy.
What We Learned Testing These Tools at SIVARO
We ran a 3-month bake-off with five agents processing financial transactions. Here’s what broke.
LangSmith was easiest to start, but the cost exploded when we scaled to 1000+ concurrent agents. Also, its trace viewer struggled with traces longer than 50 steps – it became unresponsive.
Arize Phoenix caught drift beautifully but required us to build a custom span propagator for multi-agent traces. That took two weeks.
Langfuse won for cost and flexibility. We self-hosted on a single node (200K observations/day) for $200/month. The trace timeline is the best I’ve seen for agent debugging.
Datadog was a no-go – too generic.
The key insight: no tool out-of-the-box handles agent to agent protocol deployment guide scenarios well. When agents communicate via A2A (Agent-to-Agent protocol), each message is a separate trace in the sender and receiver. You need a correlation ID that spans both. Most tools rely on W3C trace context, but that only works if the agents are in the same instrumentation scope. With A2A, messages go over HTTP/WebSocket – you need to propagate trace context in the payload.
We ended up writing a lightweight wrapper using OpenTelemetry’s Baggage and TraceState headers. It’s ugly but works.
The Agent Observability Data Model You Need
Every tool expects a certain data model. I’ll give you the one that works – based on what we use in production.
Trace {
  trace_id: uuid
  root_agent_session: session_id
  spans: [
    Span {
      span_id: uuid
      parent_span_id: (optional)
      agent_id: "order_processor_v2"
      step_name: "extract_customer_id"
      step_type: "llm_call" | "tool_call" | "agent_subcall" | "human_review"
      input: { prompt, context }
      output: { completion, parsed_result }
      start_time: timestamp
      end_time: timestamp
      metadata: { model, cost, token_count, tool_name, tool_result }
      error: (optional)
    }
  ]
}
Key fields that most tools miss:
agent_id– not just the service name, but the specific agent variant.step_name– semantic name like “validate_payment” so you can filter.step_type– critical for distinguishing tool calls from LLM calls from sub-agents.context– the context window at that step. Without it, you can’t debug context leakage.
Here’s how you instrument this in Python with OpenTelemetry:
python
from opentelemetry import trace
from opentelemetry.sdk.trace import TracerProvider
from opentelemetry.sdk.trace.export import BatchSpanProcessor
from opentelemetry.exporter.otlp.proto.grpc.trace_exporter import OTLPSpanExporter

tracer = trace.get_tracer("sivaro.agent")

def observe_agent_step(agent_id, step_name, step_type, input_data, func):
    with tracer.start_as_current_span(f"{agent_id}.{step_name}") as span:
        span.set_attribute("agent.id", agent_id)
        span.set_attribute("agent.step_name", step_name)
        span.set_attribute("agent.step_type", step_type)
        span.set_attribute("agent.input", str(input_data)[:2000])  # truncate
        try:
            result = func()
            span.set_attribute("agent.output", str(result)[:2000])
            return result
        except Exception as e:
            span.set_attribute("agent.error", str(e))
            span.set_status(trace.Status(trace.StatusCode.ERROR, str(e)))
            raise
Then export to your tool. Pick one that accepts OTLP – Arize Phoenix and Langfuse both do.
Integrating with Agent to Agent Protocol (A2A) and Deployment
A2A is becoming the standard for inter-agent communication (see AI Agent Protocols: 10 Modern Standards). The key challenge: when Agent A sends a message to Agent B, the trace context must propagate.
Here’s what a production A2A message looks like with traces:
json
{
  "protocol_version": "a2a-1.0",
  "message_id": "msg_abc123",
  "source": "agent:order_processor_v2",
  "target": "agent:inventory_checker_v1",
  "payload": { "order_id": "ORD-456", "items": [...] },
  "trace_parent": "00-0af7651916cd43dd8448eb211c80319c-b9c7c989f97918e1-01"
}
We added trace_parent as required in our A2A spec. The receiving agent must extract it and set it as the parent for all its internal spans. Without it, you have two disconnected traces.
For a full a2a architecture production example, here’s how we deploy it:
- Agents run in Kubernetes pods, each pod has an OpenTelemetry collector sidecar.
- A2A messages go through a message broker (NATS) with trace context in headers.
- The collector forwards spans to Langfuse (self-hosted) and also to a Datadog APM for infra-level traces.
- We use the
agent.idattribute as the primary filter in dashboards.
This setup cost us ~$500/month for observability at 500K agent steps/day. Compare to LangSmith’s $2K for the same volume.
OpenTelemetry as the Backbone – and Why It's Not Enough
OpenTelemetry gives you the transport and span model. It’s the backbone we use. But it has no semantic understanding of agents. The span.kind enum includes CLIENT, SERVER, INTERNAL, PRODUCER, CONSUMER – none for “agent reasoning step”. The attributes are free-form, so no validation.
This means every team reinvents the same attribute schema. The Instaclustr agentic AI frameworks comparison points out that lack of standardization is the #1 adoption blocker for agent observability.
We’re contributing to the OpenTelemetry semantic conventions for AI agents (proposal under review). But today, you have to enforce your own schema. Use a linter or a CI check that verifies all agent spans have agent.step_type and agent.step_name. Or your traces become useless noise.
Picking the Right Tool for Your Stack
Here’s a framework I use with clients:
| Stage | Team | Budget | Tool to start with |
|---|---|---|---|
| Prototyping (1-5 agents) | Solo/small | $0 | Langfuse self-hosted or Arize Phoenix OSS |
| MVP (10-50 agents) | 3-5 devs | $200/mo | Langfuse cloud or LangSmith free tier |
| Production (50-1000 agents) | Team of 5+ | $500-$2K/mo | Langfuse + custom tracing, or Arize Phoenix pro |
| Enterprise (1000+ agents) | Multiple teams | $5K+/mo | Best-of-breed: Langfuse for trace, Arize for drift, Datadog for infra |
I don’t recommend Weights & Biases for real-time production. It’s an offline tool. And I don’t recommend relying solely on Datadog unless you just need a “first look” at agent behavior.
If you’re implementing a ai agent observability tools comparison for your decision process, start with Langfuse. It’s the most honest tool for mid-scale. For large-scale, the best setup is a composable stack: OpenTelemetry collector → your choice of backend. No single vendor solution exists today that does everything well.
FAQ
Q: Which open-source observability tool is best for beginners?
Langfuse. It takes 10 minutes to set up the self-hosted version. The trace viewer is intuitive. Arize Phoenix is more powerful but has a steeper learning curve.
Q: How do you trace agent-to-agent messages?
You must propagate trace context via traceparent header in the A2A protocol. The receiving agent extracts it and sets it as parent. Use OpenTelemetry’s propagate() and extract() methods. We have an open-source library for this at github.com/sivaro/a2a-trace.
Q: Do I need separate observability for agents vs traditional services?
Yes. Traditional APM captures latency and errors but not reasoning chains. You need a tool that understands LLM calls, tool calls, and step context. Use OpenTelemetry spans with custom attributes and route them to an AI-native backend.
Q: How do you handle high-cardinality attributes like prompt content?
Don’t store full prompts in span attributes. Store a hash, and log the full prompt separately (in your logs or a vector DB). Use span attributes for metadata (model, token count, step name). Keep trace data lean.
Q: What’s the biggest mistake teams make?
Not instrumenting the reasoning step granularity. They log the final LLM call but not the intermediate “thought” steps. Without that, you can’t debug why the agent chose a wrong tool. Use the step_type attribute and log every agent action.
Q: Can I use OpenTelemetry alone without a vendor?
Yes. You can export spans to a local collector, store them in Elasticsearch or Jaeger, and build dashboards. But you lose agent-specific UIs (tree view, prompt comparison). Good for compliance, bad for debugging.
Q: How much does observability add to latency?
Minimal – our instrumentation adds <1ms per span. The exporter is async. But if you spam spans for every sub-step, you can overwhelm the collector. We batch 100 spans per export.
Final Thoughts
Agent observability is still in its infancy. The tools are getting better – Langfuse’s timeline view, Arize’s drift detection, LangSmith’s tracing – but none of them solve the fundamental problem: agents are state machines talking to other state machines, and we don’t have a standard way to represent that state.
My advice: pick one tool and invest in custom instrumentation for your agent to agent protocol deployment guide. That’s what we did. It’s not pretty, but it works.
If you’re building production agent systems, your ai agent observability tools comparison should end with a hybrid approach. OpenTelemetry for transport, a dedicated AI observability backend for traces, and custom schema enforcement. Yes, it’s more work. But so is explaining to your CEO why the agent refunded $50K to the wrong customer.
Nishaant Dixit — Founder of SIVARO. Building data infrastructure and production AI systems since 2018. Built systems processing 200K events/sec.