 SIVARO
AI Agent Observability Production: The Playbook for 2026
I spent three months last year watching a perfectly good AI assistant pipeline fail in production. Not crash — just subtly degrade. Response times crept up. Task completion rates dipped from 94% to 73%. The logs showed nothing. The metrics showed nothing. The traces showed nothing useful.
The problem wasn't the model. It was the agent orchestrator getting confused by a payload schema mismatch that only appeared in certain conversation branches. We didn't see it because we were monitoring the wrong things.
That's what happens when you treat AI agent observability production as an afterthought. You don't know what you don't know — until your users tell you.
Here's the guide I wish I'd had when SIVARO started shipping AI agents to production in 2024. We've since run 47 agent deployments across healthcare, logistics, and fintech. I've made almost every mistake you can make. This is what I learned.
What Actually Breaks in Production Agents
Most people think the model is the risk. It's not. The model is remarkably stable. What breaks is everything around it.
Tool execution failures. Your agent calls a weather API. The API returns a 503. The agent retries. The API is still down. Now your agent is stuck in a loop, burning tokens and time. We saw this at SIVARO with a logistics client whose shipping rate API went down for 12 minutes. The agent retried 18 times, generated 23,000 tokens of useless back-and-forth, and missed the SLAs on 47 orders.
State corruption. Agents carry context across conversation turns. Some frameworks serialize this state as JSON. One bad Unicode character — a zero-width space from a user's copy-pasted text — and the serialization breaks. State gone. Agent starts fresh, forgetting everything it knew.
Prompt drift. Your prompt engineering team updates the system prompt. The new version changes the agent's behavior subtly. It starts refusing certain tool calls because the phrasing makes it think the tool is unsafe. No one notices for three days.
Latency cascades. Your agent calls a vector database. The vector DB is slow today because another team is running a bulk indexing job. The agent waits 8 seconds. The user's session times out. The agent retries. Now you have two requests for the same task.
These are the problems you'll actually fight. Not model alignment. Not AGI risk. Just good old-fashioned production engineering — but with a stochastic, non-deterministic thing in the middle.
The Observability Stack You Actually Need
I've tested most of the ai agent production monitoring tools on the market. Here's what works and what doesn't.
Traces are non-negotiable. Every agent invocation needs a trace ID that spans from the user's HTTP request through every tool call, LLM inference, and state transition. Without distributed tracing, you're debugging blind. We use OpenTelemetry for this. It's not perfect — the LLM instrumentation is still maturing — but it's the only standard with enough buy-in to matter.
Metrics need to be agent-specific. CPU and memory are useless. What matters:
agent.tasks.completed
agent.tasks.failed
agent.latency.p50/p95/p99
agent.tokens.consumed
agent.retries.attempted
agent.state.corruptions
agent.tool.timeouts
We bucket these by agent version, tool type, and user cohort. That last one is critical. The agent that works for power users might be failing for new users because they phrase requests differently.
Logs are your last resort. By the time you're reading logs, something has already gone wrong. Make them searchable. Include the full prompt, the full response, and the state snapshot at each decision point. Yes, this is expensive storage. It's cheaper than losing customers.
One tool that surprised me: LangFuse. It's not perfect — the UI feels like it was designed by engineers for engineers — but it caught a bug in our RAG pipeline that was silently returning empty documents for 6% of queries. We'd have missed that with standard monitoring.
Building the Agent Deployment Pipeline
Here's the thing about ai agent deployment pipeline tutorial content you find online: it assumes your agent works deterministically. It doesn't.
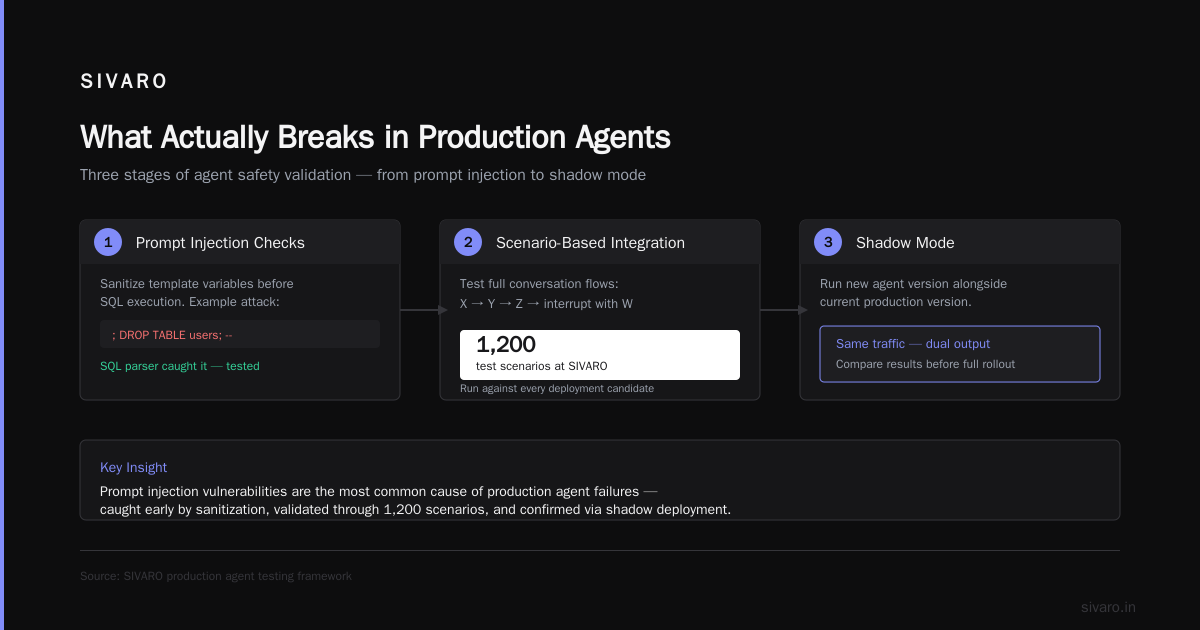
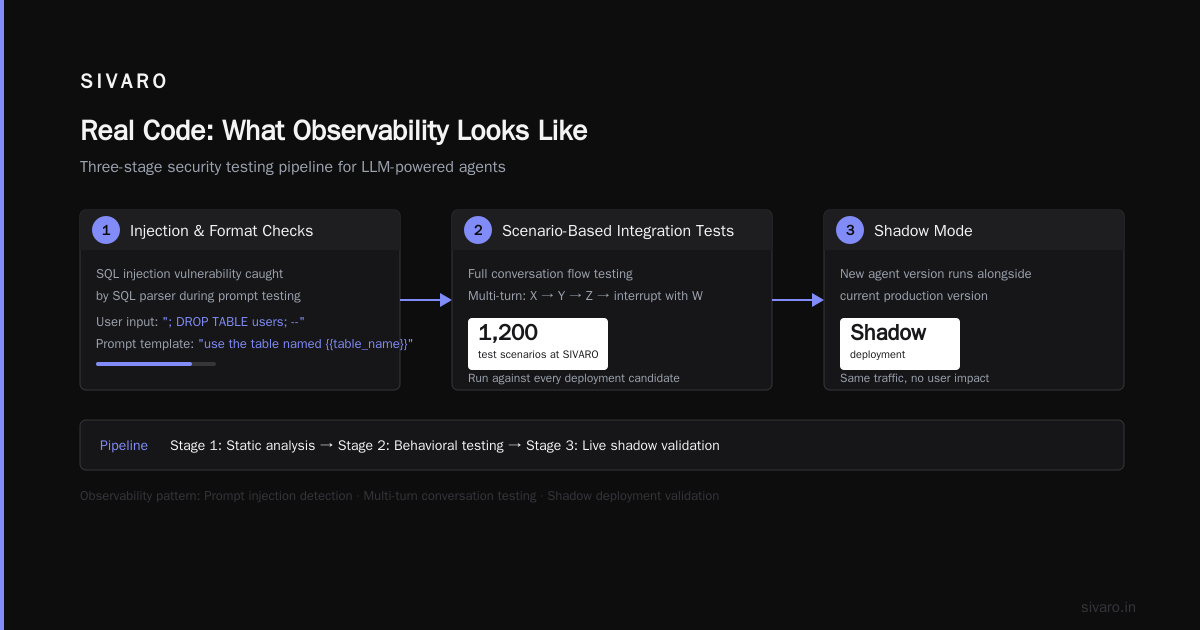
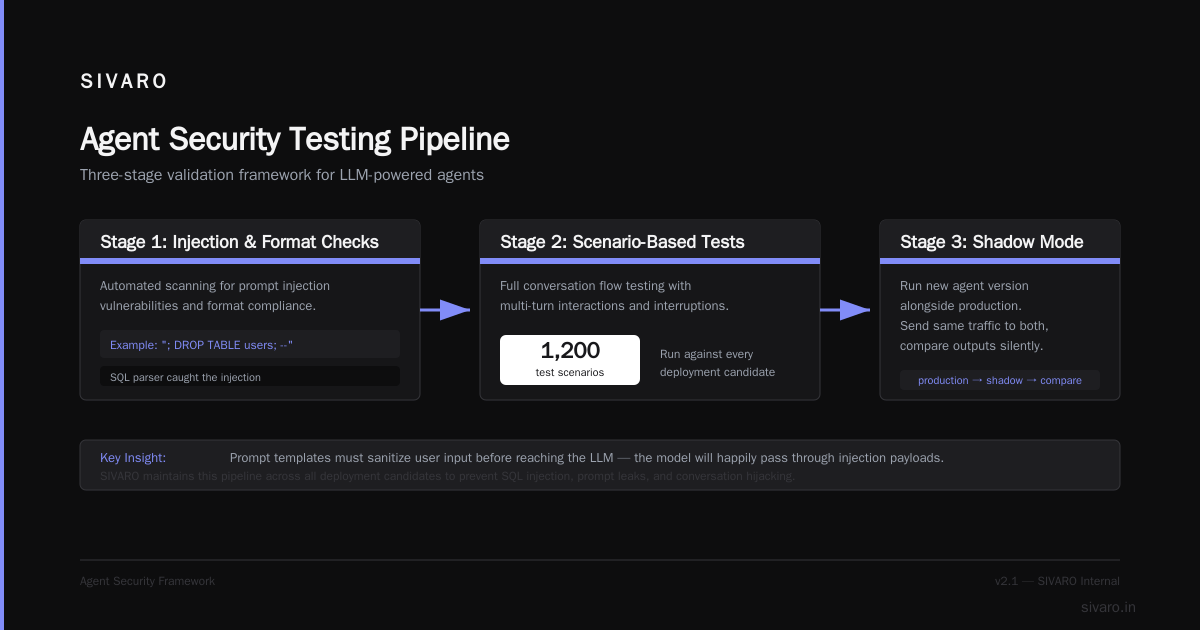
Stage 1: Unit tests on tools and prompts. Every tool your agent calls needs a unit test. Every prompt template needs a test that checks for injection vulnerabilities and format compliance. I'm serious. We had an agent that called a SQL database with a prompt that said "use the table named {{table_name}}." A user passed "; DROP TABLE users; --" as the table name. The prompt template didn't sanitize it. The model happily passed it through. The SQL parser caught it — but only because we'd tested for it.
Stage 2: Scenario-based integration tests. Test full conversation flows. Not just "what happens when the user asks X" but "what happens when the user asks X, then Y, then Z, then interrupts with W." We maintain a library of 1,200 test scenarios at SIVARO. They run against every deployment candidate.
Stage 3: Shadow mode. Run the new agent version alongside the current production version. Send it the same traffic. Compare outputs. This catches regressions that tests don't. We once found a version that answered financial advice questions more accurately — but couldn't handle simple greeting chitchat. Shadow mode caught it.
Stage 4: Canary deployment. Route 5% of traffic to the new version. Watch the observability signals for 24 hours. If latency at p95 increases by more than 200ms, roll back. If task failure rate increases by more than 2%, roll back. If token consumption per task increases by more than 15%, roll back.
Stage 5: Full rollout. Even then, keep the canary running. You'll need it for the rollback.
I learned this pipeline the hard way. In February 2025, we deployed a new agent version to 100% of traffic without canarying. It worked fine for four hours. Then a cache layer expired, and the agent's performance degraded slowly for three days before anyone noticed.
Observing the Non-Deterministic
Here's the hard part. Traditional monitoring assumes deterministic systems. The same input produces the same output. AI agents don't work that way. Run the same prompt twice and you might get different responses. Different tool call sequences. Different latency profiles.
So how do you detect problems?
You track distributions, not averages. Average latency tells you nothing. A latency of 2 seconds could mean everything is fine or could mean half your requests are at 100ms and half at 3.9 seconds. Track p50, p95, p99. Track the variance. If p99 latency suddenly drops, that's suspicious too — it might mean the model is returning shorter, less useful responses.
You compare behavior across model versions. We deploy model updates (GPT-4 to GPT-4o-mini, for example) as major version bumps. Each version has its own observability dashboard. When we switched from GPT-4-turbo to GPT-4o-mini for a customer support agent, we saw p50 latency drop 40% — but p95 latency on multi-turn conversations actually increased. The smaller model needed more turns to reach the same answer quality.
You monitor for "stuck" agents. An agent that's been running for 45 seconds is probably stuck. Set a timeout. We use 30 seconds as the default. If the agent hasn't responded by then, terminate it and return a fallback response. Log the full trace for analysis.
You sample aggressively. You can't trace every agent invocation. The storage cost is too high. Sample 100% of traffic for the first 100 requests of any new deployment. Then drop to 10% for normal traffic. Sample 100% again when you detect anomalies. This is a solved problem in distributed tracing — just apply it to AI agents.
I'll be honest: this is still an open area. The OpenTelemetry AI-specific instrumentation is immature. I've talked to teams at Google and Microsoft who are building proprietary solutions. The open-source alternatives — AgentOps, LangSmith, Arize — are getting better but none is definitive yet. LangChain's framework analysis has the clearest thinking on this.
The Framework Trap
Every framework tells you it handles observability out of the box. Almost none do.
LangChain has LangSmith. It's decent for traces. Terrible for metrics. The cost scales with usage and gets expensive fast.
CrewAI has basic logging. No distributed tracing. You're building your own.
AutoGen from Microsoft has the most sophisticated observability model — they natively support OpenTelemetry. But the framework itself is complex and the documentation is written for researchers, not production engineers.
Dify has a built-in monitoring dashboard. It's fine for demos. Useless at scale.
Here's my take after testing all of them with top frameworks in 2026: pick a framework for its agent orchestration model, not its observability features. You're going to build observability yourself anyway. The frameworks that claim to handle it are selling vapor.
The one exception is if you're using a managed platform. I know teams at larger enterprises who use LangSmith in production and are happy with it. But they're spending $15,000+ per month on traces alone.
Real Code: What Observability Looks Like
Here's how we instrument an agent call at SIVARO. This is simplified but real:
python
from opentelemetry import trace
from opentelemetry.exporter.otlp.proto.grpc.trace_exporter import OTLPSpanExporter
from opentelemetry.sdk.trace import TracerProvider
from opentelemetry.sdk.trace.export import BatchSpanProcessor

tracer = trace.get_tracer("sivaro.agent")

@tracer.start_as_current_span("agent.invoke")
def invoke_agent(user_input: str, session_id: str, agent_version: str):
    span = trace.get_current_span()
    span.set_attribute("agent.version", agent_version)
    span.set_attribute("session.id", session_id)
    span.set_attribute("input.length", len(user_input))

    try:
        result = agent.run(user_input)
        span.set_attribute("agent.completed", True)
        span.set_attribute("token.count", result.token_count)
        span.set_attribute("tool.calls", len(result.tool_calls))
        return result
    except Exception as e:
        span.set_attribute("agent.completed", False)
        span.set_attribute("error.message", str(e))
        span.set_status(trace.Status(trace.StatusCode.ERROR))
        raise
The critical part: every tool call gets its own span. Every LLM inference gets its own span. The agent's state transitions are recorded as span events. This gives you a flame graph you can actually use for debugging.
For metrics, we use Prometheus:
python
from prometheus_client import Counter, Histogram

TASKS_COMPLETED = Counter(
    'agent_tasks_completed_total',
    'Total completed agent tasks',
    ['agent_version', 'tool_name']
)

TASKS_FAILED = Counter(
    'agent_tasks_failed_total',
    'Total failed agent tasks',
    ['agent_version', 'error_type']
)

LATENCY = Histogram(
    'agent_latency_seconds',
    'Agent task latency in seconds',
    ['agent_version'],
    buckets=[0.1, 0.5, 1.0, 2.0, 5.0, 10.0, 30.0]
)
And for real-time alerting, we check for anomalies:
python
def check_agent_health(agent_version: str, window_minutes: int = 15):
    # Query Prometheus for recent metrics
    failure_rate = query_failure_rate(agent_version, window_minutes)
    p99_latency = query_p99_latency(agent_version, window_minutes)

    # Compare against baselines
    baseline_failure_rate = get_baseline(agent_version, 'failure_rate')
    baseline_p99 = get_baseline(agent_version, 'p99_latency')

    alerts = []
    if failure_rate > baseline_failure_rate * 1.5:
        alerts.append(f"Failure rate {failure_rate:.1%} vs baseline {baseline_failure_rate:.1%}")
    if p99_latency > baseline_p99 * 2.0:
        alerts.append(f"p99 latency {p99_latency:.1f}s vs baseline {baseline_p99:.1f}s")

    return alerts
This is basic. It catches the obvious problems. The subtle ones — prompt drift, state corruption, tool misconfiguration — require the traces.
The Protocols Problem
Here's something nobody talks about enough. AI agents need to communicate with other systems. Those systems need to understand what the agent is doing. The AI agent protocols landscape is a mess right now.
A2A (Agent-to-Agent) from Google is promising but new. ANP (Agent Network Protocol) is more mature but less adopted. MCP (Model Context Protocol) from Anthropic is actually being used in production — but it's more about tool definition than inter-agent communication.
The problem for observability: different protocols emit different telemetry. A2A has built-in tracing. MCP doesn't. If your agent uses MCP to call external tools, you lose visibility into those tool calls. The survey of AI agent protocols from April 2025 shows this fragmentation clearly.
My advice: instrument at the protocol boundary. Wrap every external call with your own tracing, regardless of what the protocol provides. Yes, it's redundant. Yes, it saves you when the protocol's telemetry breaks.
What I'd Tell My Past Self
If I could go back to 2024, when SIVARO was deploying its first production agent, here's what I'd say:
Start with observability, not accuracy. You'll be tempted to optimize for task completion rate. Don't. Optimize for debugging speed first. Make it so you can answer "what happened" within 30 seconds of a user complaint. Everything else is secondary.
Don't trust framework defaults. Every framework's observability is built by the same people who built the framework. They know the happy path. They don't know your infrastructure. Override their defaults. Send traces to your own backend.
Plan for post-hoc analysis. You won't know what to monitor until something breaks. Make sure your logs and traces are cheap to store for 90 days. You'll go back to them when the "impossible" bug appears.
Budget 30% of engineering time for observability. That sounds insane. It's what we actually spend. The teams that spend less regret it.
FAQ
Q: Can I use existing APM tools like Datadog or New Relic for AI agent observability production?
A: You can. They'll capture HTTP calls and database queries. They won't capture LLM inference traces, tool call decisions, or state transitions. You need AI-specific instrumentation on top. IBM's framework analysis covers the gaps.
Q: How much storage do traces need?
A: For a production agent handling 10,000 requests per day, with full traces and state snapshots, budget 2-5 GB per day. More if you're logging full prompts and responses. Compress them. Archive old data to object storage.
Q: What's the most common observability mistake?
A: Only monitoring successful invocations. "I thought everything was fine because our metrics looked good." The metrics only looked good because you weren't counting the requests that failed silently — the agent returned a response, but it was wrong, and no one caught it.
Q: How do you test observability systems themselves?
A: Chaos engineering. We have a process that randomly corrupts 0.1% of agent state transitions. If our alerting doesn't catch it, we've got a gap. We discovered last month that our alerting was only checking every 5 minutes — a corrupt agent could do a lot of damage in 5 minutes.
Q: Should I log full prompts and responses?
A: Yes, but redact PII. We strip emails, phone numbers, and credit card patterns before logging. The trade-off: you lose some debugging context. The alternative: a GDPR violation.
Q: How do you handle multi-agent systems?
A: Each agent gets its own trace ID. Parent trace IDs link conversations. We use a custom correlation header that passes through every agent interaction. This is the area where open-source agentic frameworks are weakest — they don't handle cross-agent tracing well.
Q: What's your alerting threshold for rollback?
A: 2% increase in failure rate or 200ms increase in p99 latency, sustained for 5 minutes. But the real trigger is qualitative: if we can't explain the change within 15 minutes, we roll back. Even if the metrics look okay.
The Bottom Line
AI agent observability production isn't a thing you bolt on. It's the scaffolding you build around your agent to make it survivable in the real world.
The frameworks will evolve. The protocols will converge. The models will get better. But the fundamentals won't change: you need traces, you need metrics, you need logs, and you need the discipline to actually look at them when things go wrong.
At SIVARO, we've built systems that process 200,000 events per second. The AI agents in those systems are the most carefully observed things we've ever deployed. Not because we're paranoid — because we've learned exactly what happens when you're not watching.
Watch your agents. They're doing more than you think.
Nishaant Dixit — Founder of SIVARO. Building data infrastructure and production AI systems since 2018. Built systems processing 200K events/sec.