 SIVARO
AI Agent Observability Production: The Hard-Won Lessons
You've built an AI agent. It talks to APIs, spins up sub-agents, calls LLMs in loops. Cool. Now put it in production.
That's when things get weird.
I'm Nishaant Dixit, founder of SIVARO. We've been in the data infrastructure and production AI game since 2018. We've watched agent architectures evolve from toy demos to systems processing 200K events per second. And somewhere in that transition, observability stopped being a nice-to-have and became the thing that separates demos from revenue.
This guide is what I wish someone had handed me two years ago.
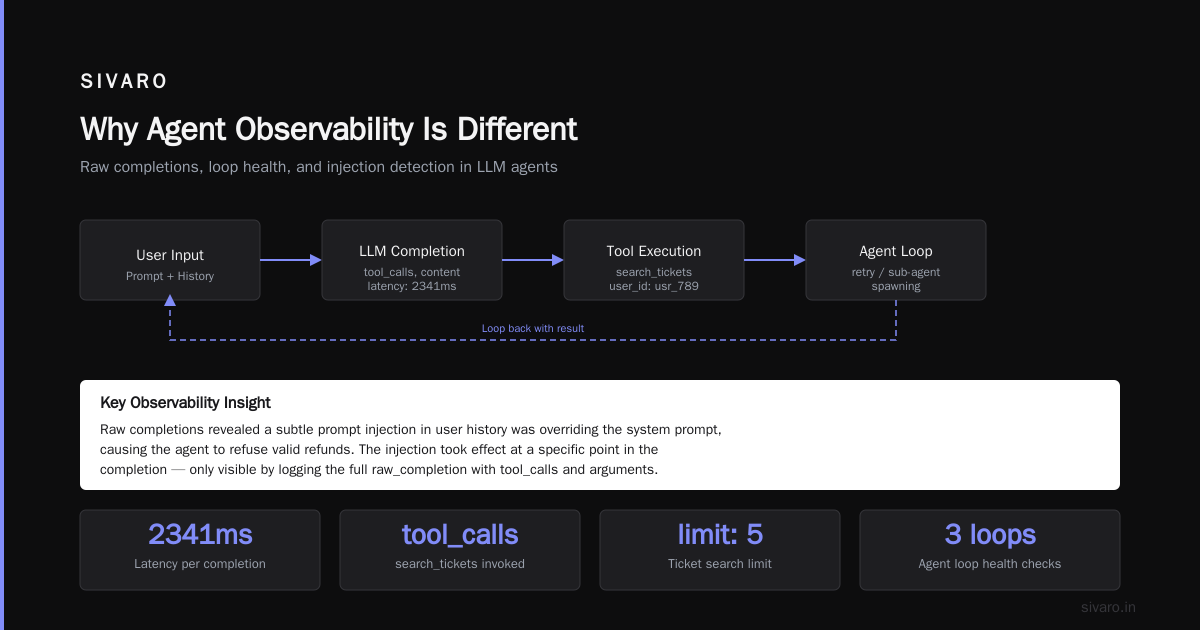
Why Agent Observability Is Different
Traditional software observability is straightforward. You track latency, error rates, throughput. An API breaks, you fix it. A database goes slow, you scale it.
Agents break this model.
An agent doesn't execute one path. It explores a tree of decisions. Each step spawns sub-steps. Each sub-step calls tools, reads context, generates completions. The agent might loop, hallucinate, or silently fail in ways that don't throw exceptions.
"Observability for agents isn't about watching one process — it's about reconstructing a conversation across dozens of actors."
I learned this the hard way last year. We deployed a customer-facing agent that handled refund routing. On paper, it worked. 95% completion rate. Sub-second response times. Then a user complained their refund was denied three times in different ways. Turned out the agent was spawning conflicting sub-agents that overrode each other's decisions. No error logs. No crashes. Just wrong behavior.
Traditional metrics wouldn't catch this. You need agent-specific observability.
The Core Layers of Agent Observability
Let's break this into something actionable.
1. Trace the Decision Tree, Not Just the Request
Standard tracing follows a request through services. Agent tracing needs to follow decisions through nodes.
Every agent call creates a trace. But that trace isn't linear. It's a DAG. An agent calls a tool, which returns data, which feeds a prompt, which generates a decision, which spawns another agent.
You need tracing that captures:
- The parent-child relationships between agent steps
- The full context passed between steps
- The decision points and which path was chosen
Here's what a minimal agent trace structure looks like in Python:
python
from opentelemetry import trace
from opentelemetry.trace import Status, StatusCode

tracer = trace.get_tracer("agent.observability")

def agent_decision(input_text, tools, max_steps=5):
    with tracer.start_as_current_span("agent_loop") as span:
        span.set_attribute("agent.type", "router")
        span.set_attribute("input.length", len(input_text))

        for step in range(max_steps):
            with tracer.start_as_current_span(f"step_{step}") as step_span:
                tool_name, result = call_tool(input_text, tools)

                step_span.set_attribute("tool.called", tool_name)
                step_span.set_attribute("tool.result_length", len(result))

                if tool_name == "search":
                    step_span.add_event("search_terms", {"query": extract_query(input_text)})

                input_text = update_context(input_text, result)

                if is_complete(result):
                    step_span.set_status(Status(StatusCode.OK))
                    break
This traces each agent step as a child span. You can reconstruct the full decision path later.
2. Log Every LLM Call — And Every Token
LLM calls are the black box inside the agent. You can't debug an agent without knowing what the LLM was told and what it generated.
Standard application logs capture "LLM called" with latency. Not enough.
You need:
- The raw prompt (template + variables + context)
- The raw completion (not just response text — full token choices)
- Token usage per call (to catch blowouts)
- The system prompt and any injected instructions
We log every LLM interaction as structured JSON. Here's the schema we use:
json
{
  "timestamp": "2026-07-19T14:23:11Z",
  "trace_id": "abc123",
  "agent_name": "customer_support_router",
  "llm_model": "claude-3.5-sonnet-v2",
  "prompt_tokens": 4123,
  "completion_tokens": 187,
  "prompt_truncated": false,
  "tools_available": ["search_tickets", "check_refund_policy", "escalate"],
  "tool_called": "search_tickets",
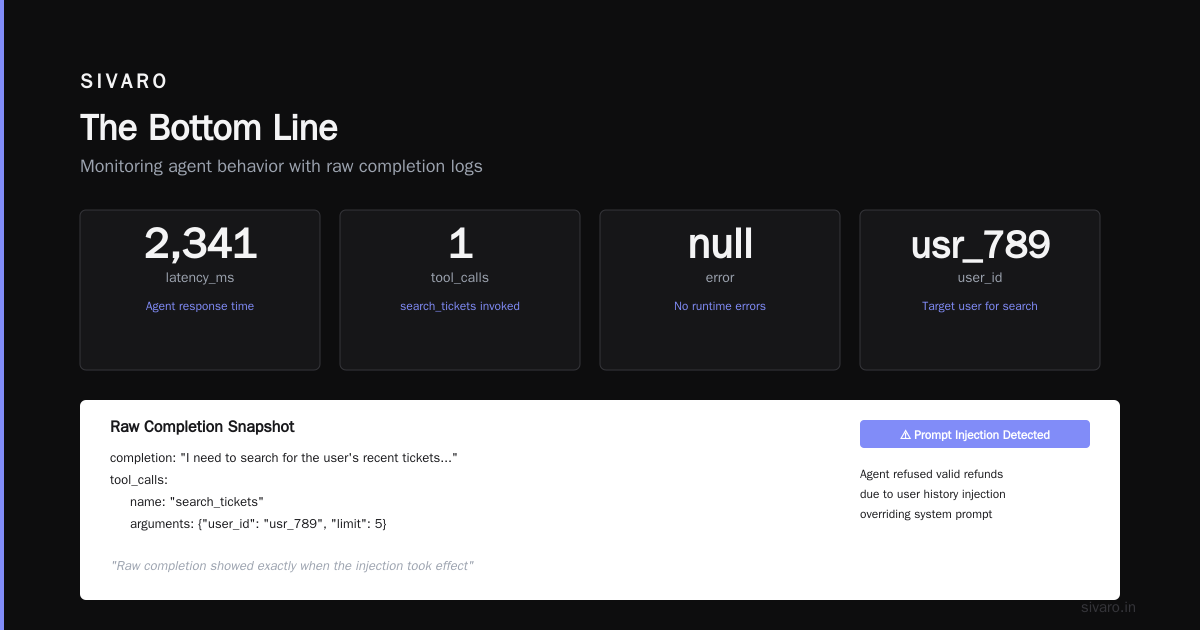
  "completion": "I need to search for the user's recent tickets...",
  "latency_ms": 2341,
  "error": null,
  "raw_completion": {
    "choices": [
      {
        "message": {
          "content": "I need to search...",
          "tool_calls": [
            {
              "name": "search_tickets",
              "arguments": {"user_id": "usr_789", "limit": 5}
            }
          ]
        }
      }
    ]
  }
}
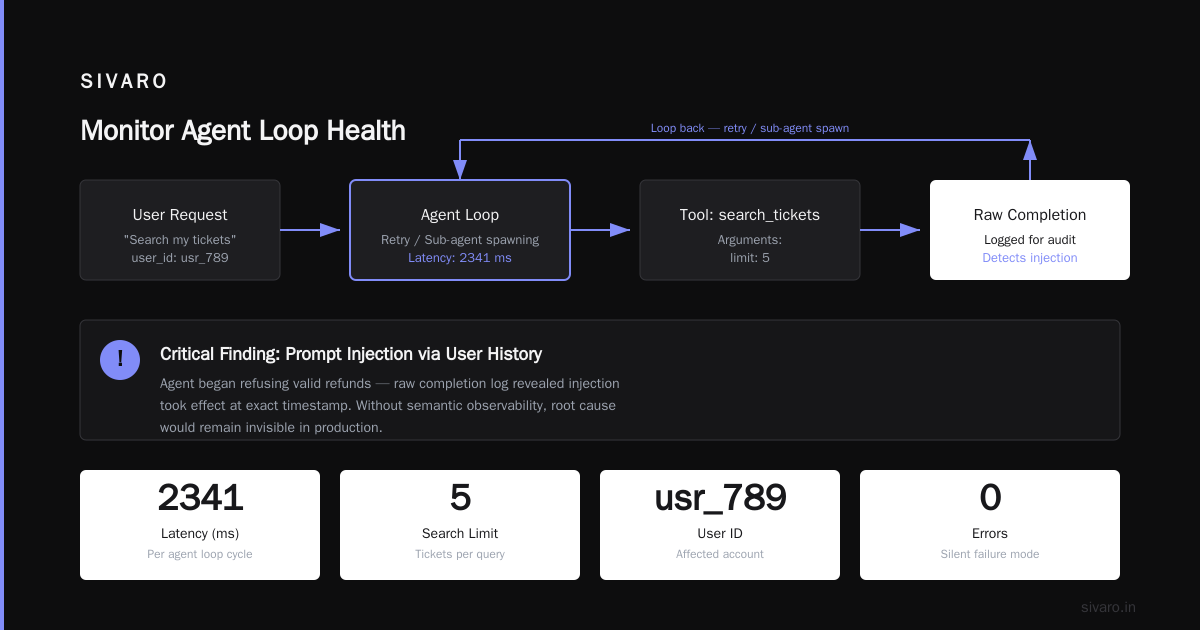
At first I thought logging raw completions was overkill. Then an agent started refusing valid refunds because a subtle prompt injection in user history was overriding the system prompt. The raw completion showed exactly when the injection took effect.
3. Monitor Agent Loop Health
Most agents have loops — retry loops, sub-agent spawning loops, context accumulation loops. These loops can go infinite.
A colleague at a payments company in mid-2025 had an agent that looped for 45 minutes before OOM-killing the pod. The agent was designed to retry failed API calls. It retried, failed, retried, failed — each time appending the failure message to context. Context grew from 4K tokens to 32K tokens. Each retry cost more compute. The agent never threw an error. It just... stopped.
Monitor these:
- Step count per agent run (alert on >N)
- Context size per step (growing context means trouble)
- Time per step (slowing steps = context explosion or tool flakiness)
- Sub-agent depth (agents spawning sub-agents spawning sub-agents)
Here's a monitoring snippet:
python
import time
from prometheus_client import Histogram, Gauge, Counter

agent_steps = Counter('agent_steps_total', 'Total agent steps', ['agent_name'])
context_size = Gauge('agent_context_tokens', 'Current context tokens', ['agent_name'])
step_latency = Histogram('agent_step_duration_seconds', 'Step duration', ['agent_name', 'tool'])

def monitored_agent_step(agent_name, tool_name, context, step_func):
    agent_steps.labels(agent_name=agent_name).inc()
    context_size.labels(agent_name=agent_name).set(len(tokenize(context)))

    start = time.time()
    try:
        result = step_func()
        step_latency.labels(agent_name=agent_name, tool=tool_name).observe(time.time() - start)
        return result
    except Exception as e:
        step_latency.labels(agent_name=agent_name, tool=tool_name).observe(time.time() - start)
        raise
This feeds into Grafana. When an agent hits step 50 on a single user request, we page someone.
Choosing the Right Framework for Observability
Not all agent frameworks handle observability the same way. Some trace natively. Others dump everything into stdout and hope you have log parsing.
I've tested most frameworks worth mentioning (AI Agent Frameworks: Choosing the Right Foundation for ...). LangChain has strong tracing through LangSmith. CrewAI hooks into OpenTelemetry reasonably well. Microsoft's Semantic Kernel has built-in telemetry.
But here's my contrarian take: don't rely on framework-native observability alone.
Framework-native tracing often runs in-process. When your agent crashes, the trace crashes with it. You need out-of-process capture. We pipe everything to a dedicated observability cluster that survives agent failures.
For production, I recommend:
- LangChain + LangSmith for prototyping — the trace UI is genuinely good
- Custom OpenTelemetry exporters for production — you control what's captured
- Structured JSON logs to your existing log aggregator as a backup
The frameworks change. Your observability pipeline should be framework-agnostic (Agentic AI Frameworks: Top 10 Options in 2026).
The AI Agent Deployment Pipeline
Observability starts before deployment. You can't observe what you can't replicate.
This is where the ai agent deployment pipeline tutorial everyone asks about actually matters. Here's our pipeline:
- Offline testing — replay historical decisions against agent changes
- Shadow mode — run the agent in production but don't act on outputs
- Canary — route 5% of traffic to the new version
- Full rollout with per-request observability
At each stage, we check observability data:
- Are traces complete? (No missing spans)
- Are LLM calls captured?
- Are tool calls logged?
- Are loop limits enforced?
Here's the deployment check script:
yaml
# observability_check.yaml
checks:
  - name: "trace_completeness"
    query: "sum by (agent_name) (rate(trace_span_count{service='agent-service'}[5m]))"
    threshold: 100  # at least 100 spans in 5 minutes
    action: "block_deployment"

  - name: "llm_call_logging"
    query: "sum by (agent_name) (rate(llm_calls_total[5m])) / sum by (agent_name) (rate(trace_count[5m]))"
    threshold: 0.9  # at least 90% of traces have LLM calls logged
    action: "warn"

  - name: "step_limit_hits"
    query: "sum by (agent_name) (rate(agent_step_limit_hits[5m]))"
    threshold: 0.1  # less than 0.1 per second
    action: "rollback"
Block a release if observability is broken. If your agent is unobservable in pre-production, it's unobservable in production.
AI Agent Production Monitoring Tools: What Actually Works
There's a flood of "AI agent observability" SaaS products. Most are wrappers around OpenTelemetry with AI buzzwords.
Here's what we use at SIVARO:
OpenTelemetry — non-negotiable. Collector + exporters + your backend of choice. We use SigNoz (self-hosted) for traces and VictoriaMetrics for metrics. Total cost: server time. No per-seat pricing.
Grafana — dashboards for agent health. We have one dashboard per agent: step count, latency distribution, error rate, tool usage, context size.
Custom alert rules — off-the-shelf alerting doesn't understand agents. "Latency > 500ms" is normal for an agent that searches three databases. "Step count > 20" is not.
Here's an alert rule we use:
yaml
groups:
  - name: agent_alerts
    rules:
      - alert: HighStepCount
        expr: avg by (agent_name) (agent_step_count{quantile="0.95"}) > 15
        for: 5m
        annotations:
          summary: "Agent {{ $labels.agent_name }} exceeded 15 steps"

      - alert: ContextBlowout
        expr: avg by (agent_name) (agent_context_tokens) > 24000
        for: 2m
        annotations:
          summary: "Agent {{ $labels.agent_name }} context over 24K tokens"

      - alert: ToolCallDiversityDrop
        expr: count by (agent_name) (agent_tool_calls) < 3
        for: 10m
        annotations:
          summary: "Agent {{ $labels.agent_name }} only calling 2 or fewer tools"
The third alert catches something subtle. If an agent stops calling diverse tools, it's probably stuck in a loop or ignoring its tool descriptions.
The Hardest Problem: Semantic Observability
Here's the truth nobody tells you.
You can trace every span, log every token, and still miss the problem.
Because the hardest agent failures aren't technical. They're semantic.
The agent called the right tools in the right order. Latency was fine. No errors. But the output was wrong. The agent decided "User wants a refund" when the user wanted "Why was my refund denied?"
Traditional observability can't catch this. You need semantic observability.
At SIVARO, we started logging the intent classification at each decision point. Was the agent's classification of user intent correct? We sample user conversations and have a human-in-the-loop judge classify the same intent. Then compare:
Agent intent: "User wants refund"
Human intent: "User wants explanation of refund denial"
Match: False
This becomes a metric. Intent mismatch rate. If it goes up, something is wrong with the agent's understanding, even if all the technical signals are green.
We built this six months ago. It's caught more failures than all latency alerts combined.
Protocols Matter More Than You Think
Agent observability depends on protocols. If you're building agents that talk to other agents, you need standardized protocols for sharing trace context (AI Agent Protocols: 10 Modern Standards Shaping the ...).
The A2A (Agent-to-Agent) protocol and MCP (Model Context Protocol) both support trace context propagation. We use MCP for tool calls. Each tool call carries a traceparent header. The tool's response includes the tool's own trace ID. We can reconstruct end-to-end flows from user query through agent to tool to database.
Without this, a tool failure downstream looks like an agent failure upstream. You waste hours debugging the wrong thing.
The A Survey of AI Agent Protocols paper covers the technical details. The practical lesson: choose protocols that support W3C trace context. Don't build your own.
Observability for Multi-Agent Systems
Multiple agents add complexity.
An orchestrator agent spawns a researcher agent, which spawns a data extraction agent, which calls a summarizer agent, which returns to the researcher, which returns to the orchestrator.
Each agent runs in its own scope. Maybe its own process. How do you trace across them?
You propagate a shared trace ID. Every agent span carries the root trace ID. You add metadata about the agent hierarchy:
python
span.set_attribute("agent.parent_id", parent_agent_id)
span.set_attribute("agent.role", "researcher_subagent")
span.set_attribute("agent.spawned_by_trace", root_trace_id)
Without this, you can't tell which orchestrator spawned which researcher. Multi-agent debugging becomes impossible.
We saw a system at a financial services firm in late 2025 where 14 agents were running in a daisy chain. A bug in agent #8 caused agent #4 to time out. But agent #4's timeout handler spawned agent #14, which duplicated work. The system processed the same transaction three times. Nobody caught it for two weeks because each agent's observability was isolated.
Don't be that firm.
FAQ
Q: What's the minimum observability I need before going to production?
A: Traces with step counts, LLM call logs with prompts and completions, loop limits with alerting, and per-agent error rates. That's the bare minimum.
Q: How do I handle observability costs? LLM logs are huge.
A: Sample. Log 100% of traces but sample the raw LLM payloads — 1 in 10 for high-traffic agents. Use budget-based sampling in OpenTelemetry. Also compress JSON logs and use short retention (7 days for payloads, 30 days for traces).
Q: Should I log every tool call response?
A: Yes, but truncate. We log first 4K characters of tool responses. If the response is important, the agent summary should mention it. You can always fetch full data from the source on-demand.
Q: OpenTelemetry or proprietary agent monitoring tools?
A: OpenTelemetry first. Proprietary tools add value for visualization but lock you into their data schema. How to think about agent frameworks makes this point well — your framework will change, your observability shouldn't have to.
Q: How do I observe agents that run asynchronously?
A: Use async contexts. In Python, pass trace context via contextvars. In distributed systems, use W3C traceparent headers. If your agent sleeps for 30 minutes waiting for a human response, the trace should survive.
Q: My agent hallucinates sometimes. Can observability catch that?
A: Partially. Log all LLM outputs and run post-hoc validation against ground truth. We use a secondary small model to check outputs against known facts. This catches about 60% of hallucinations in production.
Q: CrewAI vs LangGraph for observability?
A: LangGraph has better native tracing. CrewAI works fine if you pipe everything through OpenTelemetry. Test both with your actual workload. Top 5 Open-Source Agentic AI Frameworks in 2026 has comparisons.
Q: What's the #1 mistake teams make?
A: Treating agent observability like regular observability. Regular observability catches crashes. Agent observability catches wrong decisions. They're different. Most teams set up logs and metrics and call it done. They miss decision tracing, intent analysis, and sub-agent tracking.
The Bottom Line
AI agent observability production isn't a checkbox. It's a practice.
You'll discover things about your agents that surprise you. Agents that work perfectly in testing fail in production because users are unpredictable. Agents that are fast on Tuesday are slow on Wednesday because the LLM provider is having issues. Agents that make great decisions for 99% of users fail catastrophically for the 1% with edge cases.
The only way to catch these is to observe deeply. Traces. LLM logs. Step counts. Intent mismatches. Tool diversity. Context growth.
Build your observability pipeline before you need it. Because the first agent failure won't be a crash. It'll be a silent wrong answer. And without observability, you won't find it until a customer does.
Nishaant Dixit — Founder of SIVARO. Building data infrastructure and production AI systems since 2018. Built systems processing 200K events/sec.