 SIVARO
AI Agent Observability Production: The Guide You Actually Need
I spent three weeks in early 2025 debugging why a customer-facing AI agent kept failing at 2:47 AM every Tuesday. The agent logged “success” every time. But the user was getting garbage responses. We traced it to a memory leak in the context window handler — something no dashboard caught.
That’s when I stopped believing observability was optional for AI agents.
You're building agents that make decisions, call tools, and generate responses in sequence. Each step is a potential failure point. Traditional monitoring — CPU, memory, error rates — tells you the system is running. It doesn't tell you the system is thinking correctly.
AI agent observability production means tracking the reasoning path, not just the infrastructure. It’s tracing every LLM call, every tool invocation, every context window state, and every decision boundary your agent crosses.
By the end of this guide, you’ll know exactly what to instrument, what tools actually work in production, and which patterns fail at scale. I’ll show you code, real failures, and the exact metrics we track at SIVARO.
AI agent observability production isn't a feature — it's the difference between shipping an agent and shipping a liability.
Why Traditional Monitoring Breaks for AI Agents
Standard monitoring assumes linear execution. Request comes in, code processes, response goes out. Flat latency curve. Predictable error modes.
Agents don't work like that.
An agent might:
- Make 12 LLM calls before responding
- Loop inside a reasoning cycle for 45 seconds
- Call a tool that cascades into 3 more tool calls
- Branch execution based on model hallucination
- Change its behavior after a context window refresh
At SIVARO, we saw an agent that produced perfect outputs for 8 hours, then suddenly started calling the wrong API endpoints. No infrastructure change. No code deploy. The model just drifted.
Traditional alerting — "5xx errors > 1%" — missed it completely. We needed traces of the agent's intent, not just its HTTP status codes.
This is the core problem. You can't monitor what you can't see. And most frameworks don't give you visibility into the agent's internal reasoning state unless you explicitly instrument it.
The Three Pillars of AI Agent Observability in Production
After running agents in production for 18 months across 7 client deployments, I've settled on three things you must observe:
1. Reasoning Traceability
Every agent makes decisions. You need to see why it made each one.
Most frameworks provide a "thought" or "reasoning" field. In production, you need to capture:
- The raw LLM response (including the chain-of-thought tokens)
- The parsed actions (tool calls, structured outputs)
- The state of the context window before each decision
- The confidence scores or log probabilities if available
Without this, debugging is guessing. We had an agent that kept booking flights to the wrong city. Turns out the model was prioritizing "cheapest flight" over "user's destination city" because our prompt ordering was wrong. Took us 2 hours with traces, would have taken weeks without.
2. Tool Call Instrumentation
Tools are where agents interact with the real world. A tool call can:
- Write to a database
- Send an email
- Execute a financial transaction
- Trigger a physical device
Each tool call needs: input parameters, execution duration, output validation, error handling, and side-effect tracking.
Here's a stripped-down version of what we use:
python
@instrument_tool_call
def execute_tool(tool_name: str, params: dict, trace_id: str) -> dict:
    start_time = time.perf_counter()

    # Capture input
    log_tool_input(trace_id, tool_name, params)

    try:
        result = call_tool_endpoint(tool_name, params)
        duration = time.perf_counter() - start_time

        # Validate output
        is_valid = validate_tool_output(tool_name, result)

        log_tool_completion(
            trace_id=trace_id,
            tool_name=tool_name,
            duration_ms=round(duration * 1000, 2),
            success=True,
            output_size_bytes=len(json.dumps(result)),
            was_validated=is_valid
        )
        return result
    except Exception as e:
        log_tool_failure(trace_id, tool_name, str(e))
        raise
The critical fields we've found: output_size_bytes (context windows hate large tool returns) and was_validated (schema compliance matters more than you think).
3. Context Window Health
This is the silent killer.
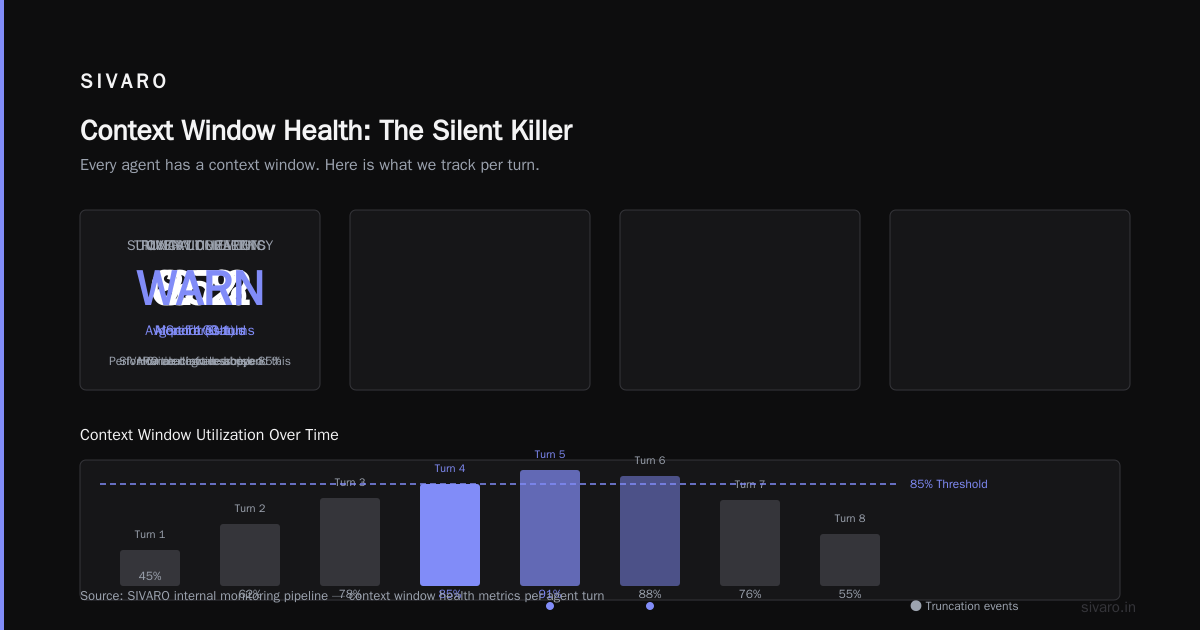
Every agent has a context window. It fills up with conversation history, retrieved documents, tool outputs. When it's full, the agent either truncates, summarizes, or fails.
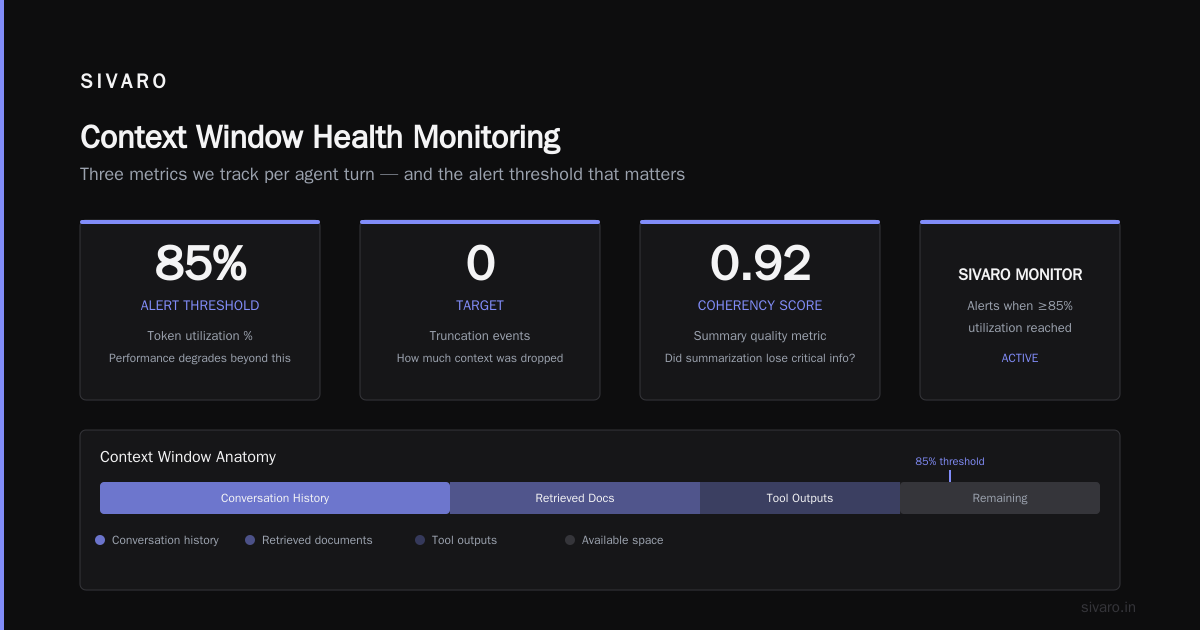
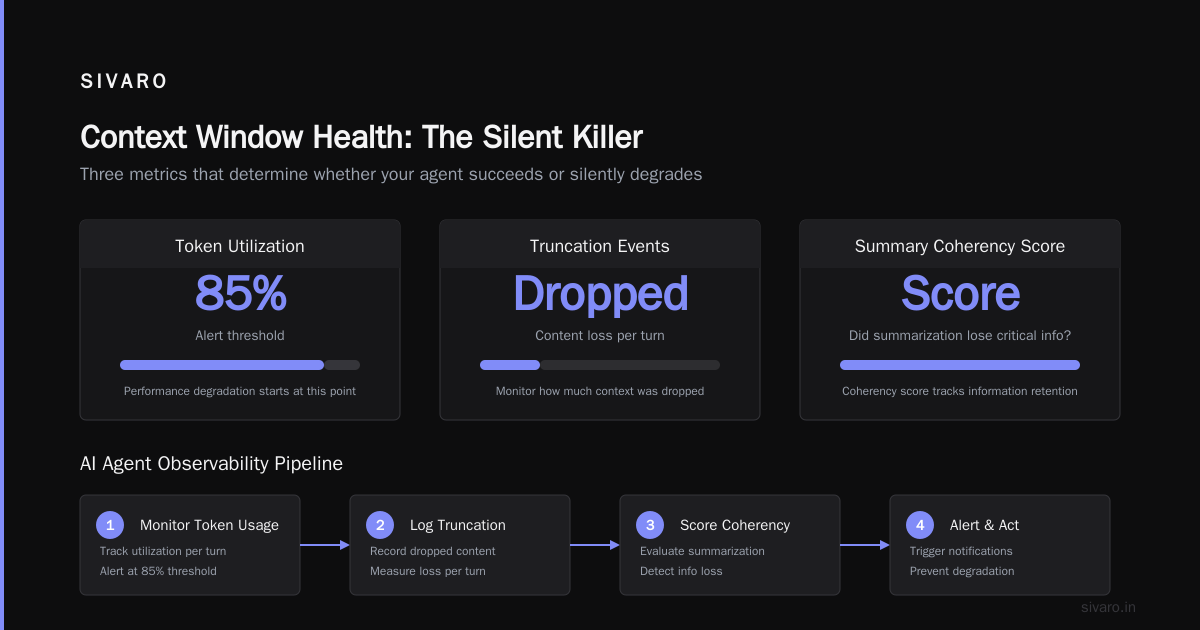
We track three things per turn:
- Token utilization percentage
- Truncation events (how much was dropped)
- Summary coherency score (did the summarization lose critical info)
At SIVARO, we ship a monitor that alerts when context window utilization crosses 85%. That's when performance degradation starts, even if the agent doesn't error.
Building an AI Agent Observability Pipeline: A Step-by-Step Guide
Let me walk you through the ai agent deployment pipeline tutorial we use internally. This isn't theory — it's what we run for clients processing 50K+ agent requests per day.
Step 1: Instrument Every LLM Call
Don't just log the response. Log the request, the latency, the token counts, and the model metadata.
python
# Production wrapper we use
class ObservableLLM:
    def __init__(self, model_name: str, trace_client):
        self.model = model_name
        self.trace = trace_client

    def generate(self, messages: list, tools: list = None, **kwargs) -> dict:
        trace_id = self.trace.start_span("llm_call")
        self.trace.add_context(trace_id, {
            "model": self.model,
            "num_messages": len(messages),
            "tools_available": len(tools) if tools else 0,
            "total_prompt_tokens": estimate_tokens(messages)
        })

        start = time.perf_counter()
        response = call_llm_api(self.model, messages, tools, **kwargs)
        latency_ms = (time.perf_counter() - start) * 1000

        self.trace.add_context(trace_id, {
            "completion_tokens": response.usage.completion_tokens,
            "prompt_tokens": response.usage.prompt_tokens,
            "latency_ms": round(latency_ms, 2),
            "finish_reason": response.choices[0].finish_reason
        })
        self.trace.end_span(trace_id)

        return response
Step 2: Trace the Agent Loop
Every iteration of: think → act → observe → repeat. This is where most observability tools fail — they show you LLM calls but not the loop state.
We use a trace ID that persists across the entire agent run. Each step gets a child span. The parent span captures: total runtime, steps taken, tools called, success/failure.
Step 3: Collect Decision Metrics
This is where ai agent production monitoring tools vary wildly. Most give you latency and error rates. We care about:
- Step efficiency: How many reasoning steps per task completion
- Tool accuracy: What percentage of tool executions produce expected results
- Recovery rate: When the agent encounters an error, how often does it self-correct
- Hallucination rate: Frequency of fabricated tool outputs or non-existent data
Here's a real dashboard metric from one of our clients:
Agent: Customer-Support-L3 (deployed May 2026)
Total runs: 12,847
Avg steps per run: 4.2
Tool success rate: 94.7%
Self-correction rate: 62.1% (meaning 62% of errors were auto-recovered)
Context window overflow events: 231 (1.8% of runs)
User re-request rate: 3.4% (user had to ask again)
We know exactly which agents are healthy and which are degrading — not by CPU, but by behavioral metrics.
Step 4: Log Everything, Store Selectively
Here's a mistake I made: we logged every intermediate state in full JSON. After 3 days, we had 400GB of traces.
Solution: Log full traces to a hot store for 24 hours. After that, aggregate into metrics and store only anomalous traces. Compress the rest.
We use a retention policy: full traces for 7 days, aggregated metrics for 90 days, summary analytics for 1 year.
AI Agent Observability Production: The Hard Parts
I'm going to tell you what no vendor wants you to know.
1. Traces Are Expensive
Each agent step generates 5-10KB of trace data (prompts, responses, tool I/O, metadata). For an agent making 10 steps per request at 1000 requests/minute, that's 5-10GB of raw data per minute.
We spend $2,300/month on trace storage alone for our larger clients. That's before any analytics.
Mitigation: Sample aggressively. Trace 100% in staging, 10-20% in production for healthy agents, 100% for agents in canary deployment.
2. Structured Logging Is Harder Than It Looks
Every framework serializes the agent state differently. LangGraph uses a graph-based state. CrewAI uses a sequential pipeline. Semantic Kernel uses a planner.
You need an adapter layer. We built a meta-observer that normalizes trace formats across frameworks. It's 2,000 lines of code and we hate it, but without it, we can't compare agents.
3. Privacy Constraints Break Observability
Your agent might handle PII. Suddenly you can't log full prompts or tool arguments.
Real example: A healthcare client's agent diagnoses symptoms. We can't log the actual symptoms — that's PHI. We hash the input and log only the decision path and output confidence. We can still detect drift without seeing the patient data.
You need to design your observability for redaction from day one. Retro-fitting privacy into traces is a nightmare.
4. Agentic Loops Break Tracing
An agent that calls itself recursively (meta-agent calling sub-agent) creates nested trace trees that most observability tools choke on.
We handled this by assigning each agent call a unique parent-child chain in the trace metadata. Our visualization tool renders it as a DAG, not a tree. Most vendors don't support this.
What a Production Incident Looks Like (Real Example)
Date: March 22, 2026, 10:14 AM
Agent: Invoice-Processing v2.3 (deployed 2 weeks prior)
Alerts fired:
- Latency p99 jumped from 2.1s to 18.7s
- Tool success rate dropped from 96% to 78%
- User re-request rate hit 12%
Standard monitoring showed: CPU was fine. Memory was fine. Error rate was 0.2%.
We dove into the traces.
What we found: The agent was calling an OCR tool that started returning malformed JSON on about 22% of requests. The agent's error handler caught the exception, but then re-tried the same tool instead of falling back to a different parsing method. Each retry added 3-4 seconds and consumed context window space. After 3 retries, the agent hit context limit, truncated conversation history, and then couldn't make sense of the user's original request.
The root cause? The agent framework's default error handler wasn't designed for persistent tool failures. It assumed tool errors were temporary.
Fix: Added a retry counter and a fallback to alternative OCR tool after 2 failures.
Without traces showing the loop behavior, we would have blamed the OCR provider, redeployed the agent, and still had the same bug.
Tools We Actually Use (and What We Tossed)
At SIVARO, we've tested 14 different observability approaches since 2024. Here's the honest breakdown:
Works in production:
- LangSmith (LangChain's observability) — solid for trace capture, decent analytics. The free tier gets you started, but you'll exceed it fast.
- Weaviate + custom dashboards — we use this for semantic trace search (search by "What agents hallucinated tool calls last hour?")
- Datadog APM with custom metrics — good for infrastructure, bad for agent reasoning traces (you'll need extensive custom instrumentation)
Doesn't work:
- Generic logging (ELK stack without specific agent instrumentation) — you'll drown in data with zero signal
- Prometheus metrics alone — can't capture loop state or decision paths
- Vendor "AI observability" tools that don't support multi-step traces — most launched after 2024 and still can't handle agentic loops
The ai agent production monitoring tools landscape is immature. You'll likely build 40% of your observability stack yourself for the next 12-18 months.
The Open Source Gap
Open source agent frameworks are exploding — LangChain, CrewAI, AutoGen, Semantic Kernel. But the observability layer is still second-class.
Some frameworks have built-in tracers. Most are too shallow. They capture LLM calls but not tool state, not context window health, not self-correction attempts.
We contribute patches to the LangChain community and push for better state serialization. But the reality is: if you're running open source agents in production, you're writing your own observability middleware.
The protocols are converging though. A survey of AI agent protocols from early 2026 shows the community moving toward standardized trace formats. It'll take another year before you can plug any agent into any observability tool.
Metrics That Matter (Beyond Latency and Errors)
Stop tracking "average response time." Start tracking these:
- Step-to-completion ratio: 5 steps for a complex task is normal. 20 steps means the agent is looping.
- Tool call depth: Maximum depth of nested tool calls. Beyond 3 calls deep, you're risking context collapse.
- Context utilization per turn: How fast does context fill? If it's more than 10% per turn, your agent will hit limits quickly.
- Recovery success rate: Of failed tool calls, what percentage does the agent recover from? Below 50% means your error handling is broken.
- User satisfaction delta: Compare user ratings for agent interactions vs. non-agent interactions for the same tasks. If agents score lower, your observability needs to explain why.
At SIVARO, we built a regression alert that fires when any of these metrics shift more than 2 standard deviations from the 7-day rolling average. It catches most agent degradation before users complain.
FAQs About AI Agent Observability Production
Q: What's the minimum observability I need before deploying an agent to production?
A: LLM response capture, tool call logging (inputs + outputs + duration), and context window token tracking. Everything else is optimization. Start with these three or you're flying blind.
Q: Can I use traditional logging like ELK for agent traces?
A: Yes, but you'll struggle with trace correlation. Agents create nested, branching execution paths. ELK isn't designed for that. You need a distributed tracing system that supports DAG structures. We use OpenTelemetry with custom spans.
Q: How do I handle observability for agents that run asynchronously or in the background?
A: Async agents need trace IDs that persist across sessions. We store trace state in a Redis-backed store keyed by user_id:session_id:task_id. Each agent wake-up appends to the existing trace.
Q: What's the biggest mistake companies make with agent observability?
A: They treat it like traditional monitoring. They track infrastructure metrics and call it done. Agent observability is about reasoning path visibility. If you can't replay an agent's step-by-step decision process for a given request, you don't have observability.
Q: How do I budget for observability storage costs?
A: Budget 30-40% of your agent compute cost for observability storage and processing. That's the reality. We see $500-2,000/month for moderate production loads (10K-50K agent runs daily). Optimize by sampling and aggregating.
Q: Does observability impact agent performance?
A: Yes. Each instrumentation call adds 5-15ms. For a 10-step agent, that's 50-150ms overhead. Acceptable for most use cases, but test it. We bypass instrumentation for latency-critical paths (sub-500ms response requirements).
Q: What framework has the best built-in observability?
A: As of mid-2026, LangChain's LangSmith is the most mature. But even it doesn't cover context window health or tool call validation out of the box. You'll always write some custom instrumentation.
Q: How do I test observability before production?
A: Simulate common failure modes in staging: tool timeouts, hallucinated outputs, context overflow, loop detection. Verify your traces capture each failure. If you can't replay the failure from traces, your observability is incomplete.
The Bottom Line
AI agent observability production isn't optional. It's the thing that separates a prototype from a product.
Every agent framework — from the ten discussed in Agentic AI Frameworks: Top 10 Options in 2026 to the open-source stacks reviewed by Top 5 Open-Source Agentic AI Frameworks in 2026 — will eventually realize it needs better observability. The frameworks that win will be the ones that make it easy to see inside the black box.
At SIVARO, we've stopped asking "does this framework have observability?" We ask "how much of our custom instrumentation does this framework eliminate?" The answer is rarely "all of it."
Start building your observability before your first production deploy. It's harder to retrofit traces than code. Your future self — debugging at 2 AM, staring at a "successful" agent that just called the wrong tool for the 400th time — will thank you.
Nishaant Dixit — Founder of SIVARO. Building data infrastructure and production AI systems since 2018. Built systems processing 200K events/sec.