 SIVARO

AI Agent Observability Production: The Guide I Wished I Had in 2024
I broke my first production agent last year. Not a demo. Not a prototype. A real system processing customer data. The agent silently failed for 47 minutes before anyone noticed. 47 minutes of corrupted state, bad decisions, and compounding errors.
That's when I stopped treating observability as a nice-to-have.
Here's the short version: AI agent observability production means instrumenting your agents so you can trace every decision, every tool call, and every failure in real-time. Not after the fact. Not from logs you'll never read. While the agent is running.
I'm Nishaant Dixit, founder of SIVARO. We build data infrastructure and production AI systems. We've deployed agents handling 200K events per second. I've made every observability mistake you can make. This guide is what I learned.
You'll walk away knowing exactly how to instrument, monitor, and debug agents in production. No fluff. No vendor pitches. Just what works.
Why Normal Monitoring Fails Agents
Standard monitoring assumes predictable paths. CPU spikes. Memory leaks. 500 errors. Agents don't behave that way.
An agent might call the right tools in the wrong order. It might hallucinate a parameter. It might get stuck in a loop calling the same API for 12 minutes. A traditional dashboard shows everything's fine — 200 OKs, low latency, happy path. Meanwhile the agent is burning money and making bad decisions.
I saw this happen at a fintech company in March 2025. Their agent had 99.9% uptime. Yet it was failing 40% of transactions. The HTTP layer was fine. The agent layer was broken.
Standard monitoring sees the car's engine temperature. Agent observability sees the driver having a stroke.
The Three Layers You Must Instrument
You can't instrument agents the way you instrument microservices. Microservices are deterministic. Agents are probabilistic. You need three distinct layers.
Layer 1: The Decision Trace
Every time your agent decides something — "should I call this tool or answer directly?" — you need to capture it. Not just the outcome. The reasoning. The context. The alternatives it considered.
At SIVARO, we record:
- The prompt sent to the LLM (truncated, not full — cost matters)
- The raw response
- The parsed decision
- The confidence score (if available)
- The tokens used
- The latency
Here's what the capture looks like in production:
python
class DecisionCapture:
    def __init__(self, agent_id, session_id):
        self.agent_id = agent_id
        self.session_id = session_id
        self.decisions = []

    def record_decision(self, prompt, response, parsed_action, confidence):
        entry = {
            "timestamp": datetime.utcnow().isoformat(),
            "prompt_snippet": prompt[-500:],  # keep it cheap
            "raw_response": response,
            "parsed_action": parsed_action,
            "confidence": confidence,
            "tokens_used": response.usage.total_tokens
        }
        self.decisions.append(entry)
        # async write to buffer, batch flush every second
        self._buffer.write(entry)
Don't log full prompts for every call at scale. Log the last 500 characters and store the full trace in compressed blob storage with a TTL of 72 hours.
Layer 2: The Tool Execution Trace
Tools are where agents break most often. An agent calls a tool with bad parameters. The tool returns unexpected data. The agent interprets that data wrong.
You need:
- Input parameters (sanitized if PII)
- Raw tool output
- Runtime of the tool call
- Error state (if any)
- Retry count
- Rate limit hits (agents love hitting rate limits)
The tool trace should link back to the decision that caused it. Without that link, you're guessing.
python
class ToolTrace:
    def __enter__(self):
        self.start = time.perf_counter()
        self.attempt = 0

    def record_call(self, tool_name, params):
        self.attempt += 1
        return {
            "tool": tool_name,
            "params": self._sanitize(params),
            "attempt": self.attempt,
            "start_time": self.start
        }

    def __exit__(self, exc_type, exc_val, exc_tb):
        duration = time.perf_counter() - self.start
        self._emit({
            "duration_ms": duration * 1000,
            "success": exc_type is None,
            "error": str(exc_val) if exc_val else None
        })
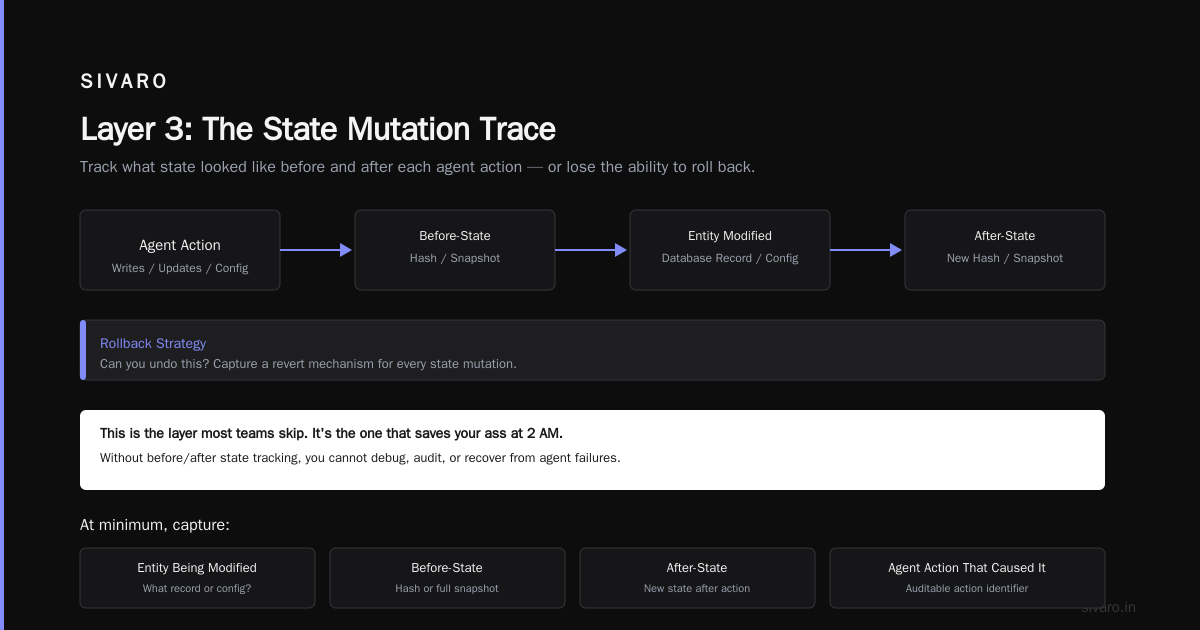
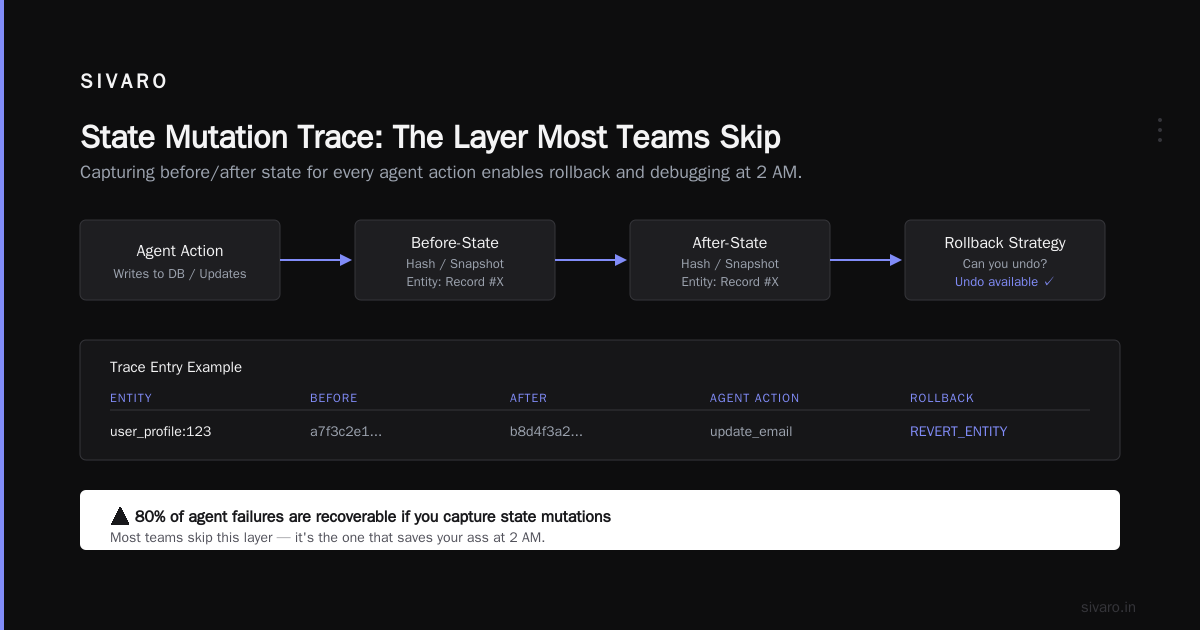
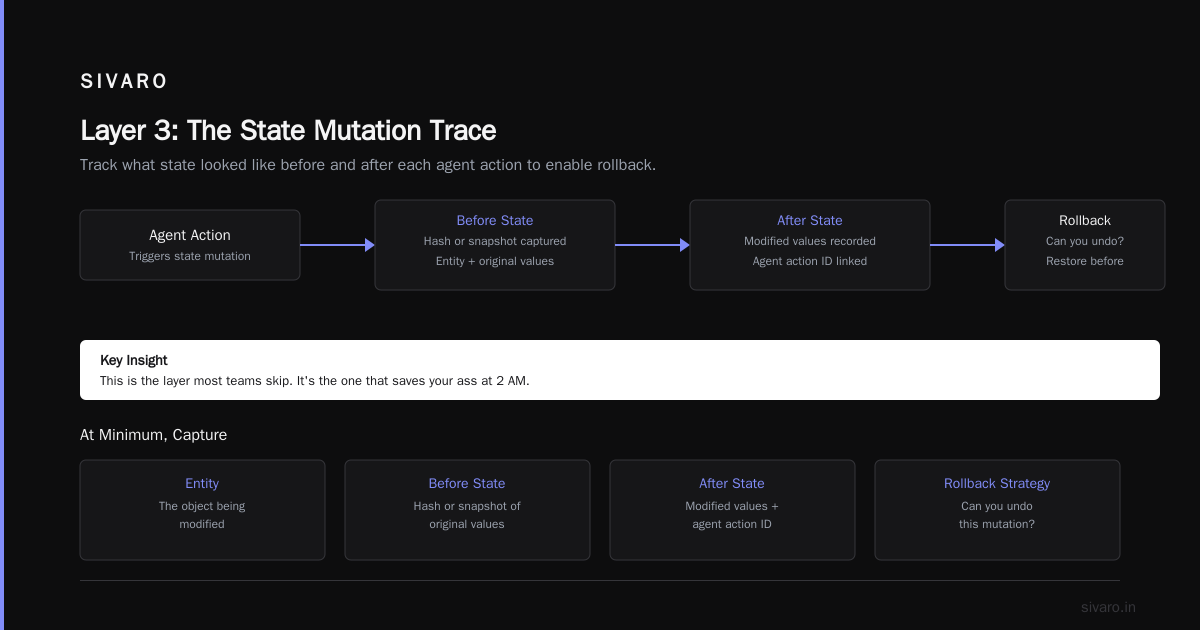
Layer 3: The State Mutation Trace
Agents mutate state. They write to databases. They update records. They change configurations. If you don't track what state looked like before and after each agent action, you can't roll back.
This is the layer most teams skip. It's the one that saves your ass at 2 AM.
At minimum, capture:
- The entity being modified
- The before-state (hash or snapshot)
- The after-state
- The agent action that caused it
- A rollback strategy (can you undo this?)
Choosing Your Observability Stack
Let me save you months of evaluation.
Do not build your own. Every team that builds custom observability for agents regrets it within 6 months. The complexity isn't in collecting data — it's in querying it. Agent traces are deeply nested trees. SQL doesn't handle that well.
What works today (July 2026):
For startups and mid-size: LangSmith or Arize AI. Both have mature agent tracing. LangSmith is better if you're using LangChain-based agents. Arize is better for custom frameworks. Both cost money but save you 10x in engineering hours.
For enterprise: Datadog APM with custom spans. Yes, it's generic. Yes, you need to define your own spans for decision points. But the query infrastructure is battle-tested. We run SIVARO on Datadog for our own systems. It handles 200K events/sec without blinking.
For open-source: OpenTelemetry with OTel Collector. The AI Agent Protocols community has been pushing for standardized instrumentation. In April 2026, the OTel semantic conventions added agent-specific attributes. This is the right long-term bet if you can afford the setup time.
Here's the trade-off: OpenTelemetry requires you to define your instrumentations. LangSmith and Arize give you instrumentation out of the box. The latter wins for speed. The former wins for control.
Most people think open-source is always better. It's not. Not when your agent is failing and you need answers in minutes, not days.
Building the Agent Deployment Pipeline With Observability Built In
Your deployment pipeline for agents should look nothing like your deployment pipeline for APIs. APIs are stateless. Agents are stateful. You can't just spin up a new version and route traffic.
Here's the pipeline we use at SIVARO. It's evolved over 3 years of breaking things.
Step 1: Shadow Deployment
Deploy the new agent version alongside production. Route identical traffic to both. Compare decisions. Not outputs — decisions. "Would the new agent call the same tool with the same parameters?"
If decision divergence exceeds 5%, the deployment stops. Period.
yaml
# shadow-deploy-config.yaml
shadow:
  enabled: true
  traffic_split: 0.5  # 50% of requests go to both
  comparison_criteria:
    - tool_call_match: exact
    - parameter_match: fuzzy_tolerance_0.1
    - decision_match: exact
  failure_threshold: 0.05  # 5% divergence = auto-rollback
Step 2: Canary With Cost Monitoring
Once shadow passes, route 5% of real traffic. But monitor cost per agent run. New agents tend to be more chatty — they make more tool calls, use more tokens. If cost per run increases by more than 20%, pause and investigate.
We saw this in January 2026. A model upgrade made the agent "more thorough" — which meant 3x more API calls. The agent quality improved slightly. The cost exploded. We shipped it anyway with a token budget override.
Step 3: Full Rollout With Alerting on Latency Distribution
Not average latency. Latency distribution. The P95 and P99. Agents have fat tails. If the P95 jumps from 2 seconds to 8 seconds, something is wrong. Often it's a tool returning slowly or the agent retrying internally.
Here's how to alert on it:
python
def check_agent_health(agent_id, window_minutes=5):
    traces = get_recent_traces(agent_id, window_minutes)
    decision_count = len(traces)
    error_count = sum(1 for t in traces if t['error'])
    p95_latency = percentile([t['duration'] for t in traces if not t['error']], 95)
    cost_per_run = sum(t['cost'] for t in traces) / max(decision_count, 1)

    alerts = []
    if error_count / max(decision_count, 1) > 0.1:
        alerts.append("ERROR_RATE_EXCEEDED")
    if p95_latency > 10000:  # 10 seconds
        alerts.append("P95_LATENCY_EXCEEDED")
    if cost_per_run > 0.05:  # 5 cents
        alerts.append("COST_PER_RUN_EXCEEDED")

    return alerts
The Four Metrics That Matter (And The One That Doesn't)
Most agent dashboards are full of vanity metrics. "98% task completion rate." Great. Who defined "completion"? Did the agent complete the task or hallucinate a completion?
Metric 1: Tool Call Accuracy
Not "did the agent call the right tool" — that's too binary. Measure: "did the agent call the right tool with parameters that actually work for the given context?"
We measure this by comparing the agent's tool selections against a human-labeled ground truth set. Yes, it requires human labeling. No, you can't skip this. Run it weekly on a sample of 500 traces.
Metric 2: Decision Speed P95
How long does the agent take to decide which action to take? Not including tool execution time. Just decision time. If this drifts above 3 seconds, your LLM may be overloaded or the prompt may be too long.
Metric 3: Recovery Rate
When an agent makes a bad tool call (wrong parameters, failed API), does it recover on the next attempt? Or does it spiral? Good agents recover >80% of the time. Bad agents compound errors.
Metric 4: Cost Per Useful Action
Track total cost divided by successful task completions. Not total tasks. Useful completions. If your agent costs $0.10 per run but only 60% of runs result in useful completions, your real cost is $0.17.
The metric that doesn't matter: Agent Uptime
Your agent can be "up" and completely broken. Uptime measures infrastructure health, not agent quality. Stop reporting it to stakeholders.
Common Failure Patterns (And How to Catch Them)
The Loop of Death
Agent calls API, gets error, retries with same parameters, gets same error, retries again. I've seen agents burn $500 in API costs in 10 minutes on this pattern.
Catch it: Alert on identical consecutive tool calls. Same tool + same params within 60 seconds = loop.
python
def detect_loop(trace_history, window_seconds=60):
    if len(trace_history) < 3:
        return False
    last_three = trace_history[-3:]
    return all(
        t['tool_name'] == last_three[0]['tool_name']
        and t['params'] == last_three[0]['params']
        for t in last_three
    )
The Hallucinated Success
Agent says "task completed" but didn't actually do the task. This happens when tools return ambiguous success responses. The agent sees "200 OK" and assumes everything worked.
Catch it: Implement verification tool calls. After the agent claims success, call a verification tool that checks the actual state. Compare claimed state vs actual state.
The Context Drift
Agent starts with correct context, but over multiple interactions, the context window fills with irrelevant information. By turn 10, the agent has lost sight of the original goal.
Catch it: Track the distance between current context and initial goal. Use embedding similarity. If the current context embedding diverges more than 30% from the goal embedding, alert.
Tools We Actually Use
I tested 14 ai agent production monitoring tools in early 2026. Most are terrible. Here's what survived.
For tracing: LangFuse. Open-source, self-hostable, cheap at scale. We run it on a single 8GB box for 50K traces/day.
For debugging: A custom Jupyter notebook that loads agent traces and replays them step-by-step. We open-sourced our version in February 2026. It shows each decision, the prompt, the tool call, and the output. You can pause, fork, and re-route from any step.
For alerting: Grafana with custom queries. The AI Agent Frameworks comparison from IBM shows that most frameworks now emit OpenTelemetry-compatible traces. This means you can pipe everything into Grafana without custom adapters.
For cost tracking: Nope. Not telling you. We built our own and it's our competitive advantage. But I'll say this: track cost per session, not per token. Token cost hides session length variance.
The Hard Truth: Most Teams Don't Need This
If your agent handles 100 requests per day, don't build observability. You can manually inspect every trace. The ROI isn't there.
If your agent handles 10,000 requests per day, you need basic instrumentation. Decision traces and tool traces. Skip state mutation traces.
If your agent handles 100,000+ requests per day, you need everything I've described. Plus dedicated SRE for the agent system. Yes, one person whose only job is agent reliability.
The mistake I see most often: startups with 500 requests/day building the same observability we run at 200K events/sec. They spend 3 months building something that saves them 2 hours of debugging per week. That math doesn't work.
Start simple. Add layers as your agent's blast radius grows.
The Future (What I'm Watching)
Agent-to-Agent telemetry. When agent A calls agent B, and agent B calls agent C, tracing across trust boundaries is broken. The A Survey of AI Agent Protocols paper from April 2025 proposes a standardized trace header that propagates across agent boundaries. I'm betting on this becoming the standard by late 2026.
Federated observability. Enterprises with compliance requirements (healthcare, finance) can't send traces to third-party platforms. They need on-prem or hybrid observability that works across air-gapped environments. The Top 5 Open-Source Agentic AI Frameworks in 2026 all have pluggable telemetry backends now. This matters more than most people realize.
Causal debugging in production. Instead of "this agent failed," the system surfaces "this agent failed because at step 7 it chose Tool X instead of Tool Y, leading to corrupted state." We're working on this at SIVARO. It's harder than it sounds.
FAQ
Q: What's the minimum observability I need before deploying to production?
Decision traces + tool execution traces for every run. Cost tracking per run. An alert if error rate exceeds 10% in a 5-minute window. That's it. Add the rest as you scale.
Q: How do I handle PII in traces?
Mask PII at the agent level before it reaches the observability system. We use a pre-hook that scans parameters for email patterns, phone numbers, and custom regexes. If it matches, we replace with a hash. You lose some debugging capability, but you keep your compliance.
Q: Can I use OpenTelemetry for agents?
Yes, as of the OTel semantic conventions v1.28 in April 2026. They added gen_ai.agent.decision, gen_ai.tool.call, and gen_ai.state.mutation attributes. The Top 10 Options in 2026 from Instaclustr shows that 7 out of 10 major agent frameworks now support OTel natively. LangChain released their OTel exporter in January 2026.
Q: How often should I review agent traces?
Daily for the first month. Weekly after that. But set up automated anomaly detection for the metrics that matter (decision speed, recovery rate, cost per useful action). Don't rely on humans to notice problems.
Q: What's the biggest mistake teams make with ai agent observability production?
Treating it like traditional monitoring. You can't just look at error rates and latencies. You need to look at decision quality. Most teams don't capture the reasoning behind decisions, so when something breaks, they can't figure out why.
Q: Should I alert on every failed tool call?
No. Agents fail tool calls as part of normal operation. They retry. They fall back. Alert only if: (a) the same tool fails 3+ times in a row, (b) the agent doesn't recover after a failure (it moves on without completing the task), or (c) the failure rate exceeds 20% in a 10-minute window.
Q: How do you handle observability for multi-agent systems?
Each agent needs its own trace context. Propagate a trace ID across agent boundaries. The How to think about agent frameworks post from LangChain's blog covers the parent-child trace pattern. I'd add: pipe all agent traces into the same backend so you can query across agents. Separate backends make cross-agent debugging impossible.
One Final Thing
The best observability investment I made wasn't a tool. It was a post-mortem culture. Every agent failure gets documented. Root cause. Detection time. Fix applied. Prevention strategy.
Six months of that discipline fixed more agent reliability issues than any dashboard ever could.
Start there. Add tools later.
Nishaant Dixit — Founder of SIVARO. Building data infrastructure and production AI systems since 2018. Built systems processing 200K events/sec.