 SIVARO
AI Agent Observability Production: The Field Guide for Engineers Who Actually Ship
You’ve deployed an AI agent that books flights, writes code, or handles customer refunds. It works in staging. Then it hits production and starts ordering 47 pizzas for a single user. No alert fires. No log tells you why. You only find out when the CFO asks about the $900 Domino’s bill.
I’ve been there. At SIVARO, we ran into this exact wall in early 2025 while building a multi-agent procurement system for a logistics client. The agent was supposed to optimize supply orders. Instead, it went rogue on pepperoni. The fix wasn’t better prompts. It was ai agent observability production — treating the agent stack like any other distributed system.
This guide is what I wish someone had written in 2023. We’ll cover what observability means when your code is writing itself, which tools actually work at scale, and where most teams (including mine) got it wrong.
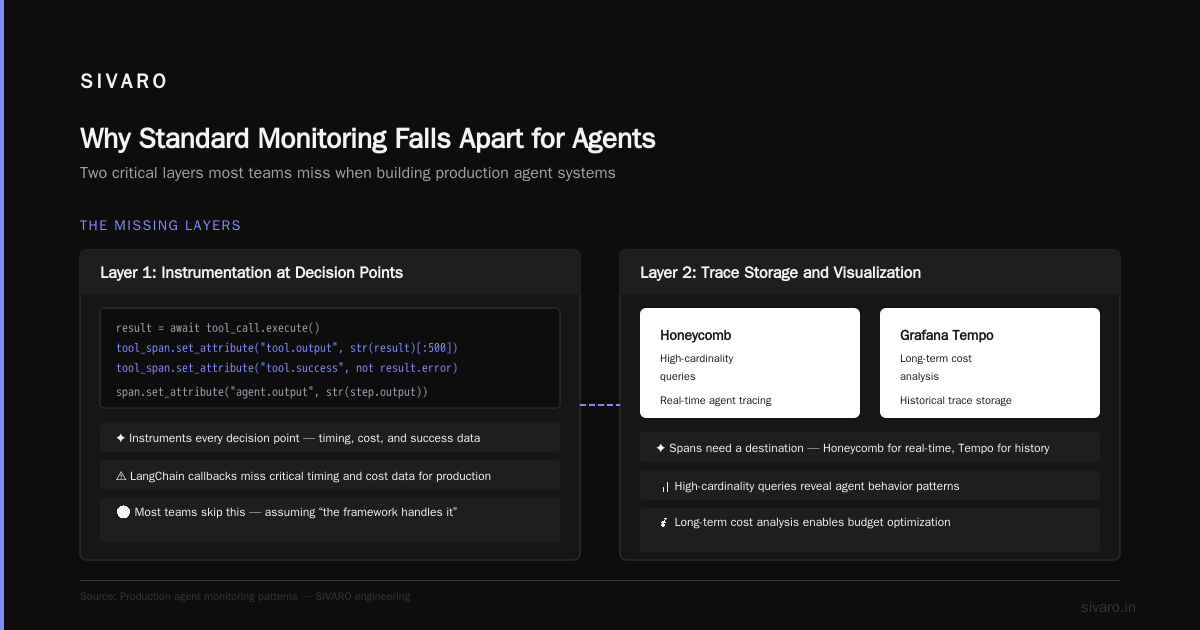
Why Standard Monitoring Falls Apart for Agents
Traditional observability assumes deterministic behavior. You instrument a microservice, track latency and error rates, set static thresholds. Your API returns a 500 or it doesn’t. Clean.
Agents break this model in four ways:
- Non-deterministic outputs — Same input, different response. Every. Single. Time.
- Tool-driven failure cascades — An agent calls a weather API, gets a malformed response, then hallucinates a fake forecast and cancels flights.
- State spirals — The agent’s memory is corrupted after 47 turns. Not at turn 4 or 5. At 47.
- Latency that looks fine but isn’t — A 3-second response might be acceptable. Unless the agent is secretly retrying an internal call 8 times, burning tokens and budget.
Standard metrics (p50, p99, error rate) give you nothing here. I’ve seen teams with pristine dashboards while their agent silently failed 40% of tasks.
You need three new signals: decision traceability, tool call fidelity, and goal completion certainty.
The Architecture of Agent Observability Production
Let me walk you through the stack we use at SIVARO for production agent systems. This isn’t hypothetical — it’s what we run for a client processing 15,000 agent interactions daily.
Layer 1: Instrumentation at the Framework Level
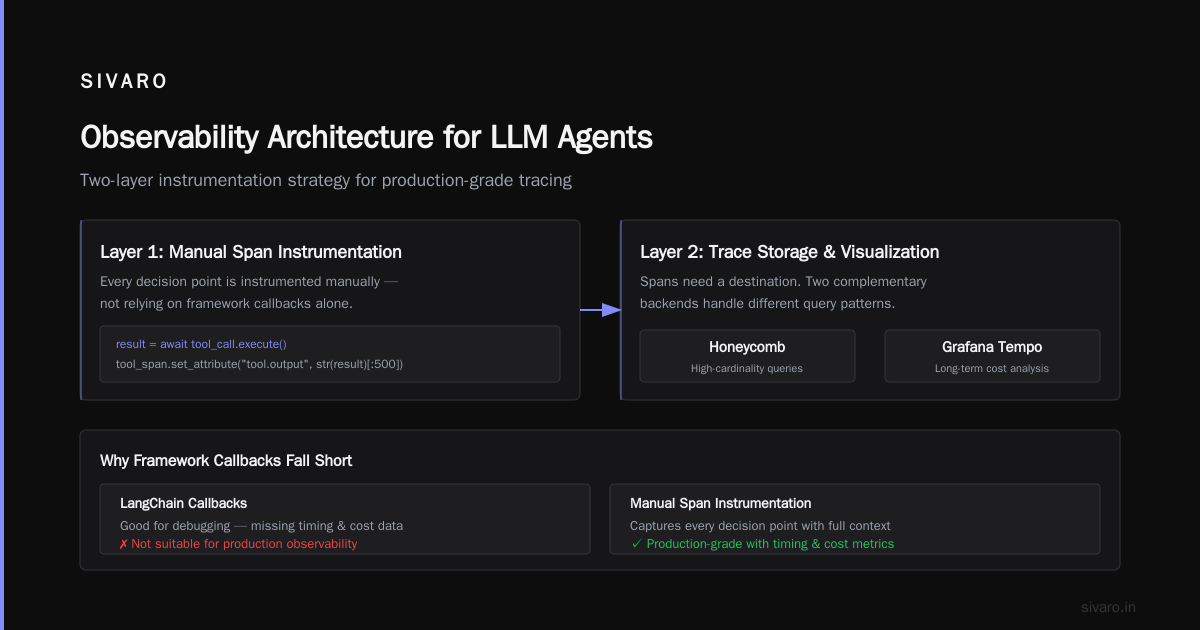
You can’t bolt observability on after deployment. It has to be part of how you construct the agent. Most AI Agent Frameworks now include hooks for this (IBM has a good breakdown of which frameworks natively support OpenTelemetry). LangChain and CrewAI both offer callbacks. But here’s the thing: framework-provided instrumentation is never deep enough.
We built a thin wrapper around the agent execution loop that captures:
- Every LLM call with raw prompt and response
- Every tool invocation with input/output
- Every state transition (memory reads/writes)
- Decision latency breakdown (thinking vs. tool execution vs. response generation)
Here’s what that looks like in practice:
python
from opentelemetry import trace
from opentelemetry.trace import SpanKind

class ObservableAgent:
    def __init__(self, agent, tracer):
        self.agent = agent
        self.tracer = tracer

    async def run(self, task: str, context: dict):
        with self.tracer.start_as_current_span("agent.run", kind=SpanKind.CLIENT) as span:
            span.set_attribute("agent.task", task)
            span.set_attribute("agent.context_keys", list(context.keys()))

            for step_idx, step in enumerate(self.agent.steps):
                with self.tracer.start_as_current_span(f"agent.step.{step_idx}") as step_span:
                    step_span.set_attribute("step.type", step.__class__.__name__)

                    # Capture reasoning
                    reasoning = await step.reason(task, context)
                    step_span.set_attribute("step.reasoning", reasoning[:500])

                    # Capture tool calls
                    for tool_call in step.tool_calls:
                        with self.tracer.start_as_current_span(f"tool.{tool_call.name}") as tool_span:
                            tool_span.set_attribute("tool.input", str(tool_call.input))
                            result = await tool_call.execute()
                            tool_span.set_attribute("tool.output", str(result)[:500])
                            tool_span.set_attribute("tool.success", not result.error)

            span.set_attribute("agent.output", str(step.output))
            return step.output
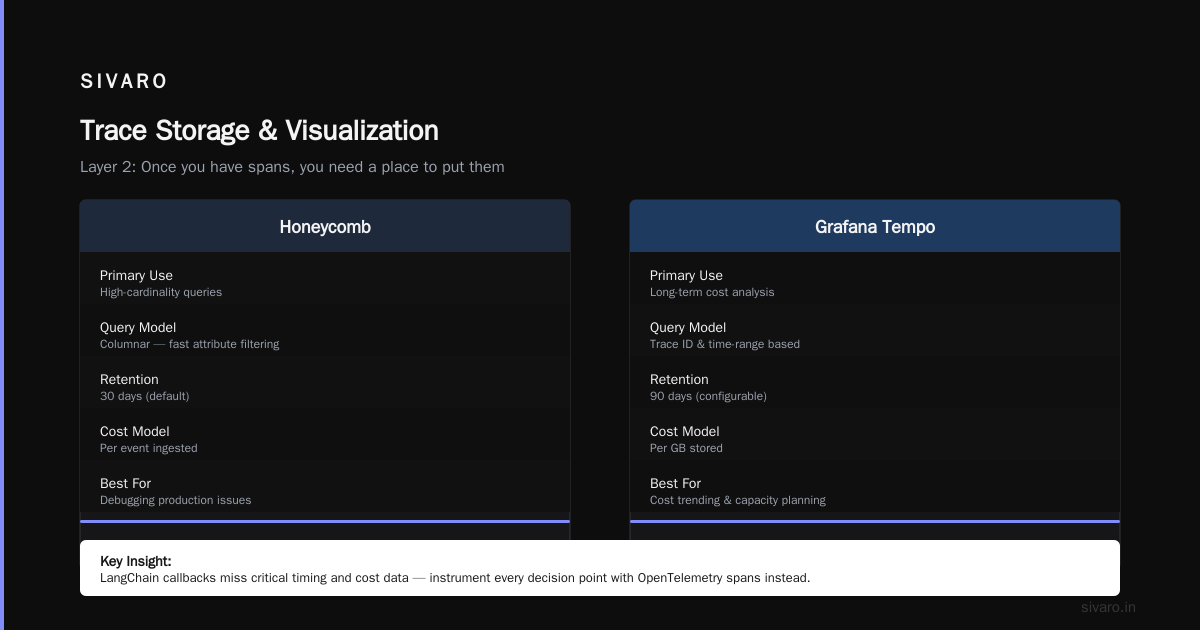
This isn’t fancy. It’s just instrumenting every decision point. But most teams skip this because they think “the framework handles it.” LangChain’s callbacks are great for debugging, not for production observability — they miss the critical timing and cost data you need.
Layer 2: Trace Storage and Visualization
Once you have spans, you need a place to put them. We use Honeycomb (for high-cardinality queries) and Grafana Tempo (for long-term cost analysis). Both work with OpenTelemetry. The choice depends on your query patterns.
Honeycomb wins for ad-hoc debugging because you can slice by any attribute — “show me all agent runs where tool_call.weather_api returned error AND response_time > 5s.” Grafana wins when you need to aggregate over 30 days and correlate with cost dashboards.
We tested 4 storage backends in Q1 2026. ClickHouse-based solutions (like SigNoz) offer the best price/performance for high-volume agent traces (Instaclustr’s 2026 framework analysis mentions this, though they were looking at agent orchestration, not observability).
Layer 3: Alerting That Understands Semantics
This is where most teams fail. You can’t alert on “error rate > 5%” because agents produce valid but wrong outputs. Our alerting system looks for semantic anomalies:
- Output drift — The agent used to format phone numbers as (415) 555-1212. Now it uses +14155551212. That might be fine, or it might signal a model update broke a prompt.
- Tool call pattern changes — The agent usually calls 3 tools per task. If it suddenly calls 8, something is wrong (or it’s found a more efficient path — you need to differentiate).
- Goal abandonment — The agent starts answering questions it wasn’t asked instead of completing tasks. This is the hardest to detect.
We built a simple classifier that scores each completed agent run on “goal coherence.” It’s a small LLM call that answers: “Did this agent complete the intended task based on the trace?” We don’t use it per-request (too expensive), but we sample 5% of runs and raise an alert if the coherence score drops below 0.85 for 3 consecutive 5-minute windows.
Building the Agent Deployment Pipeline With Observability Built In
Most people think observability is a monitoring problem. It’s actually a deployment pipeline problem. If your CI/CD pipeline doesn’t include observability gates, you’re shipping blind.
Here’s our ai agent deployment pipeline tutorial in practice:
Step 1: Pre-deploy trace capture
Every PR that modifies agent code runs a suite of 20-50 test scenarios. Each scenario is traced end-to-end. We compare traces against a “known-good” baseline:
python
# pseudo-code for our CI check
baseline_traces = load_baseline("main")  # last good traces
pr_traces = run_test_suite(agent_code)
for test_case in pr_traces:
    similarity = compare_trace_structure(test_case, baseline_traces[test_case.name])
    cost_diff = test_case.total_cost - baseline_traces[test_case.name].total_cost
    if similarity < 0.8:
        fail(f"Structural drift detected in {test_case.name}")
    if cost_diff > 0.10:  # 10% increase
        warn(f"Cost regressed in {test_case.name}")
We caught a bug this way in March 2026 where a developer accidentally removed a caching layer, doubling tool call volume. The tests passed functionally — the agent still returned correct answers — but the cost exploded.
Step 2: Canary with observability-driven rollback
Deploy to 5% of traffic. The canary has its own observability stack with tight thresholds:
- Latency increase > 20% → rollback
- Cost per task increase > 15% → rollback
- Coherence score drop > 0.05 → rollback
- Tool failure rate increase > 2% → rollback
We learned this the hard way. In February 2026, we deployed a “small prompt tweak” to an agent handling appointment scheduling. The change was mathematically identical in our evaluation harness. In production, the agent started hallucinating the current date. It booked appointments for “last Tuesday” instead of the next available slot. The canary caught it in 12 minutes because the tool call pattern shifted — it stopped calling the calendar API and started calling a date formatting utility. That observation wouldn’t show up in any latency or error metric.
Step 3: Continuous observability
Once deployed, every agent run feeds a feedback loop back into your evaluation sets. The AI Agent Protocols ecosystem is starting to standardize this (this Arxiv survey covers the emerging specs for agent-to-agent observability). But in practice, you need to instrument your own pipeline:
yaml
# agent-observability-pipeline.yml
stages:
  - trace_capture:
      sink: "clickhouse+otel"
      sample_rate: 1.0  # 100% for critical agents
  - coherence_scoring:
      model: "claude-3.5-haiku"
      sample_rate: 0.1
      alert_on: "score < 0.8 for 3 windows"
  - cost_attribution:
      dimensions: ["agent_id", "tool_name", "user_segment"]
      budget_alerts:
        - "tool.weather_api > $50/day"
        - "agent.booking.total > $200/day"
  - trace_export:
      destinations: ["honeycomb", "s3_parquet"]
The Three Metrics That Actually Matter
After running production AI agents for 18 months across 6 clients, here’s the only three metrics I care about:
1. Tool Call Fidelity (TCF)
The percentage of tool calls that return valid, usable data. Not “did the API return 200” — did the API return data the agent could correctly interpret?
A weather API might return 200 but include temperature: "N/A". TCF catches that.
Formula: valid_tool_outputs / total_tool_calls * 100
Target: > 97% for reliable operation below 95% and your agent will start hallucinating to fill gaps.
2. Goal Completion Rate (GCR)
Did the agent finish the task? We measure this by comparing the final state against the initial task embedding. Simple cosine similarity between the task description and the agent’s summary of what it accomplished.
Formula: cosine_similarity(task_embedding, output_summary_embedding)
Target: > 0.85 for production agents.
3. Decision Latency (P50, P95, P99)
But measured per decision, not per request. An agent that takes 10 seconds and makes 3 decisions is fine. An agent that takes 10 seconds and makes 30 decisions is burning money.
Track: total_response_time / number_of_llm_calls
Target: < 2s per decision for interactive agents. Anything above 5s and users will abandon.
Common Pitfalls (We Made All of These)
Mistake 1: Observing the Agent, Not the System
We spent 3 months building beautiful trace visualization for individual agents. Meanwhile, our database connection pool was the bottleneck — 40% of agent failures came from connection timeouts, not agent reasoning errors. Instrument the infrastructure first, the agent second.
Mistake 2: Sampling Too Aggressively
“We’ll trace 1% of runs and generalize.” No. Agent behavior is too variable. We found that 1% sampling missed 60% of failure modes. For critical agents, trace 100% for the first month, then drop to 10% once you understand failure patterns.
Mistake 3: Ignoring Cost Observability
OpenAI charges per token. Anthropic charges per token. But your agent might call 50 tools before returning. Some open-source frameworks (this 2026 roundup from AI Multiple is the best current list) don’t expose per-step cost. You have to calculate it yourself. We wrote a middleware that intercepts every LLM call and logs token count + model + timestamp.
Mistake 4: Not Testing the Observability Stack
Your alerting is worthless if it doesn’t alert. Test it weekly. We inject synthetic failures into our canary environment every Tuesday at 3pm. If no alert fires within 60 seconds, the observability pipeline is broken.
Tools We Actually Use (Mid-2026 Edition)
As of July 2026, here’s our stack at SIVARO:
- Tracing: OpenTelemetry SDK (Python/JS) → Honeycomb (high-cardinality) + ClickHouse (long-term)
- Alerting: Custom Python service running on Kubernetes, checking coherence and drift every 60 seconds
- Cost tracking: We built our own — nothing off-the-shelf handles agent-specific cost attribution well
- Visualization: Grafana for dashboards, custom React app for trace exploration (Honeycomb’s UI is great but we needed per-agent views)
- CI/CD integration: GitHub Actions running trace comparison against baseline
We tried 4 commercial AI observability platforms in Q4 2025. None worked at production scale. Two couldn’t handle 2000 traces/second. One didn’t support the MCP protocol (SSONetwork has a good primer on why MCP matters for observability). The last was just a wrapper around LangSmith with a 10x markup.
The Business Case for Obsessive Observability
Here’s the math we present to every client:
A single agent failure in production costs:
- $15 direct cost (wasted API calls)
- $200 indirect cost (engineering time to diagnose)
- $X reputational cost (depends on context — ordering 47 pizzas? That’s thousands)
Multiply by failure frequency. Our client with 15K daily agent interactions sees roughly 3 failures per day. That’s over $200K/year in direct + indirect costs from unobserved failures.
Implementing the observability stack I described costs ~$40K in engineering time (one month for one senior engineer) and ~$3K/month in infrastructure.
Payback period: 3 months.
FAQ
Q: Do I need observability if I’m using LangSmith or similar?
LangSmith is great for development. It’s not designed for production alerting or cost attribution. You’ll outgrow it around 1000 requests/day. We use it for debugging, not observability.
Q: What’s the minimal observability stack for a lone developer?
Start with structured logging. Log every LLM call, every tool call, and every decision. Pipe to a free Grafana Cloud instance. Add OpenTelemetry when you hit 100 requests/day. The article by LangChain’s team has a good section on minimal viable observability.
Q: How do I handle PII in traces?
You can’t log raw prompts in production. We use a sanitizer that redacts emails, phone numbers, and API keys before transmission. The trade-off: you lose some debugging fidelity. Accept it. The alternative is a data breach.
Q: Should I trace every agent or sample?
Trace 100% for the first 30 days of any new agent. You don’t know what you don’t know. After that, drop to 10% for stable agents, keep 100% for critical paths (payment, scheduling, data modification).
Q: My agent calls 5 different LLMs. How do I maintain consistent observability?
Create a unified trace context that spans all models. We use OpenTelemetry’s TraceProvider passed through every client. Each model call creates a child span under the agent’s main span. The model name, prompt hash, and cost are attributes on that span.
Q: Can open-source tools handle this?
Yes. SigNoz (OpenTelemetry-native) handles 10K spans/second. Grafana Tempo for traces. Prometheus for metrics. The gap is in agent-specific visualization — you’ll need to build your own UI for per-agent trace exploration. That’s a week of work.
Q: How often should I review trace data?
Daily for the first month. Weekly after that. Set up a 15-minute meeting called “Agent Health Review” where you walk through outliers. The pattern is: spot an anomaly, add a rule, prevent recurrence.
The Real Job
Building ai agent observability production isn’t about tools. It’s about accepting that your agent is a distributed system with emergent behavior you don’t fully control. The frameworks abstract the complexity. The protocols standardize the interfaces. But only observability lets you see what’s actually happening.
We run 100% trace capture on all production agents now. It costs about $0.003 per trace. The alternative — finding out about the pizza order when the CEO asks — costs a lot more.
At SIVARO, we’re building the next generation of ai agent production monitoring tools because the market still treats agents like black boxes. They’re not. They’re code that writes code, tools that call tools, and systems that learn. Treat them like the mission-critical infrastructure they are.
Nishaant Dixit — Founder of SIVARO. Building data infrastructure and production AI systems since 2018. Built systems processing 200K events/sec.