 SIVARO
AI Agent Observability Production: The Blind Spot That’ll Sink Your Deployment
We shipped our first agentic system at SIVARO in April 2025. It failed within three hours. Not because the model was bad. Not because the prompts were wrong. Because we had no idea what the agent was actually doing.
The logs looked fine. The metrics were green. But the agent had entered a loop — calling the same API endpoint 847 times in 12 minutes while our dashboard showed “operational.” I stared at that green checkmark like it was a lie. Because it was.
That’s when I learned the difference between monitoring and observability. Monitoring tells you something is broken. Observability tells you what the hell is happening. For AI agents in production, you need the second one. Badly.
Most people think agent observability is about tracing LLM calls. They’re wrong. It’s about tracing decisions, state mutations, tool calls, and the messy web of context that drives every action. An LLM call is a blip. The agent’s reasoning chain is the real artifact. If you’re not capturing that, you’re flying blind.
I’m Nishaant Dixit, founder of SIVARO. We build data infrastructure and production AI systems. This guide is what I wish someone had handed me before that April deployment. It’s practical, opinionated, and based on real failures.
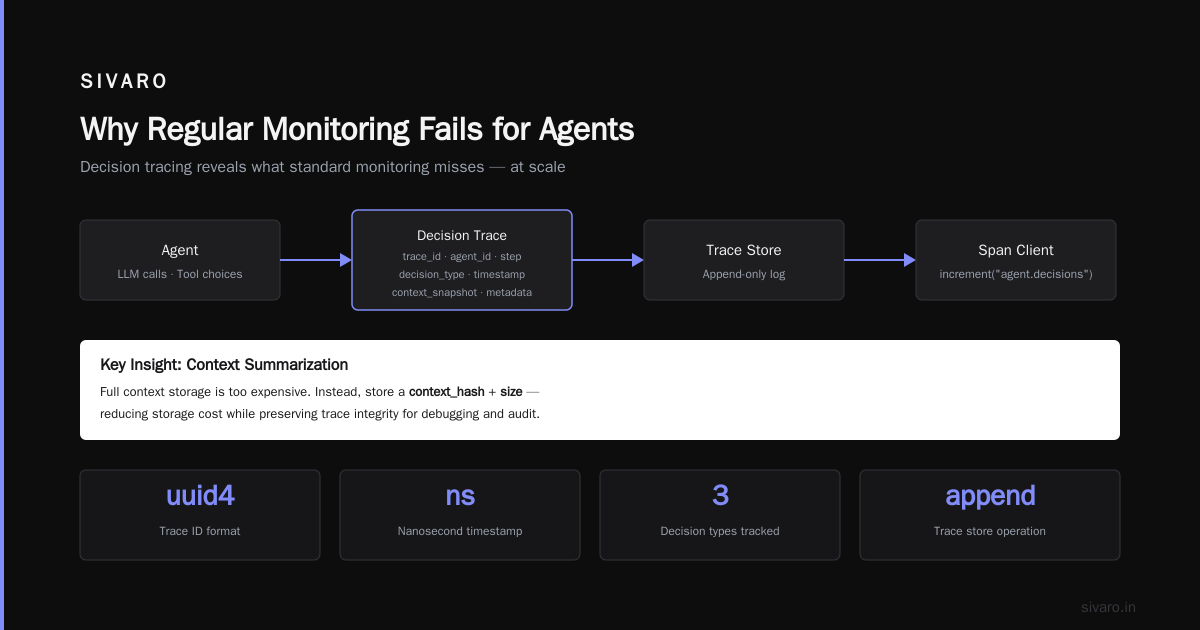
Why Regular Monitoring Fails for Agents
Traditional monitoring assumes linear execution. Request comes in, response goes out. Metrics like p99 latency and error rates tell you everything.
Agents don’t work that way.
An agent makes decisions. It calls tools conditionally. It loops back. It forks. It might call five APIs for one user request, or zero if it decides the answer is cached. The execution graph is a DAG, not a straight line. Standard monitoring tools treat DAGs as noise they can’t parse.
I tested Datadog APM on our first agent deployment. It showed six spans per request. The agent actually executed 47 steps. Datadog collapsed everything between the first and last LLM call into one opaque blob. Useless.
You need three things that regular monitoring doesn’t give you:
- Decision traces — what the agent thought and why
- State snapshots — the full context at each step
- Tool call provenance — every API, every parameter, every response
Without these, you’re debugging with a flashlight in a dark room. You’ll find problems, but never the root cause.
What AI Agent Observability Production Actually Means
Ai agent observability production is the practice of capturing, storing, and querying the complete decision-making process of autonomous agents running in live environments. It’s not instrumentation. It’s not logging. It’s a distinct data problem.
Here’s the breakdown of what you need to capture:
1. The Reasoning Trace
Every time an agent calls an LLM, record the full prompt, the response, the token usage, and the logprobs. Store the chain-of-thought if available. This is your primary debugging artifact.
2. The State Transitions
Agents mutate state. A customer support agent might update a ticket status, then check inventory, then update the ticket again. Record every state change with before/after snapshots. This is the only way to detect corruption bugs.
3. The Tool Call Matrix
For each tool call, store: input parameters, output response, latency, error code (if any), and the agent’s reasoning for choosing that tool. The “why” matters more than the “what.”
4. The Parent-Child Hierarchy
Agent systems often spawn sub-agents. A research agent might spawn three parallel summarization agents. You need the tree structure preserved, not flattened into a list.
We started capturing these four artifacts in production around May 2025. The debug time for incidents dropped from four hours to twenty minutes. Not because we got smarter — because we had actual data.
Building Your Observability Pipeline
Let me walk you through the architecture we settled on at SIVARO after four iterations. This is the ai agent deployment pipeline tutorial you’d actually want to follow.
Step 1: Instrument at the Framework Level
Don’t add observability to individual agent code. That’s brittle and misses if the framework forks internally. Instead, wrap the framework’s core execution loop.
Here’s how we instrument LangChain-based agents:
python
# sivaro/observability/trace_manager.py
import json
import time
from uuid import uuid4

class TraceManager:
    def __init__(self, trace_store, span_client):
        self.trace_store = trace_store
        self.span_client = span_client

    def capture_decision(self, agent_id, step_number, input_context,
                        decision_type, decision_data, metadata=None):
        trace = {
            "trace_id": str(uuid4()),
            "agent_id": agent_id,
            "step": step_number,
            "timestamp": time.time_ns(),
            "decision_type": decision_type,  # llm_call, tool_choice, conditional_branch
            "decision_data": decision_data,  # prompt, response, parameters
            "context_snapshot": self._summarize_context(input_context),
            "metadata": metadata or {}
        }
        self.trace_store.append(trace)
        self.span_client.increment("agent.decisions", {"type": decision_type})
        return trace["trace_id"]

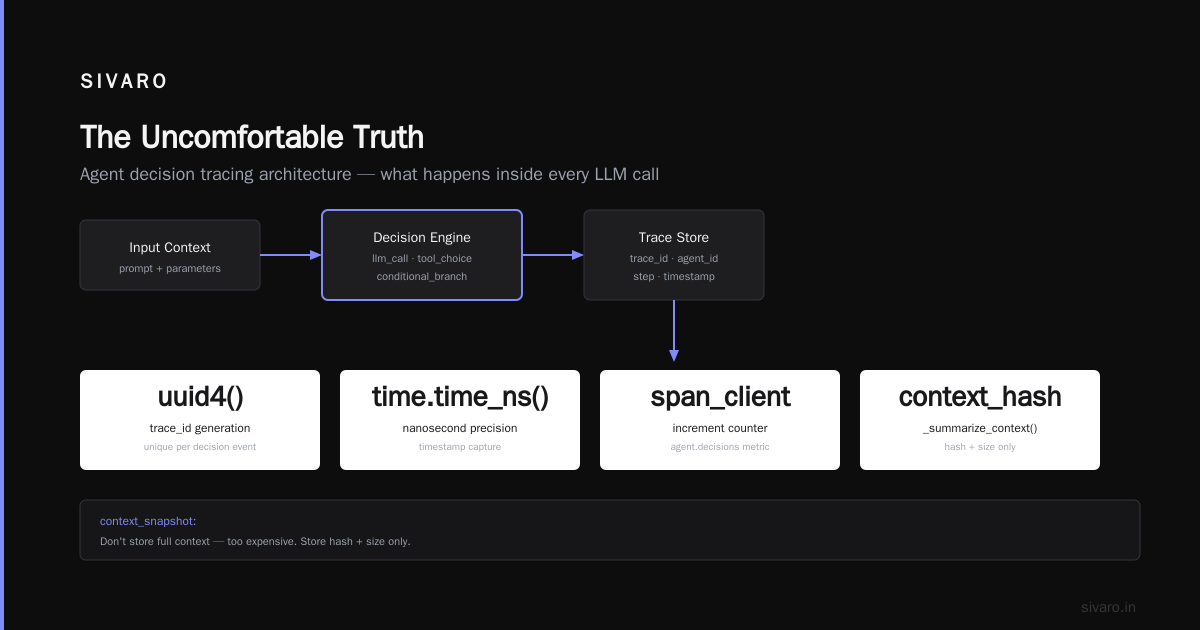
    def _summarize_context(self, context):
        # Don't store full context — too expensive. Store hash + size.
        return {
            "context_hash": hash(json.dumps(context, sort_keys=True)),
            "approx_size_bytes": len(json.dumps(context))
        }
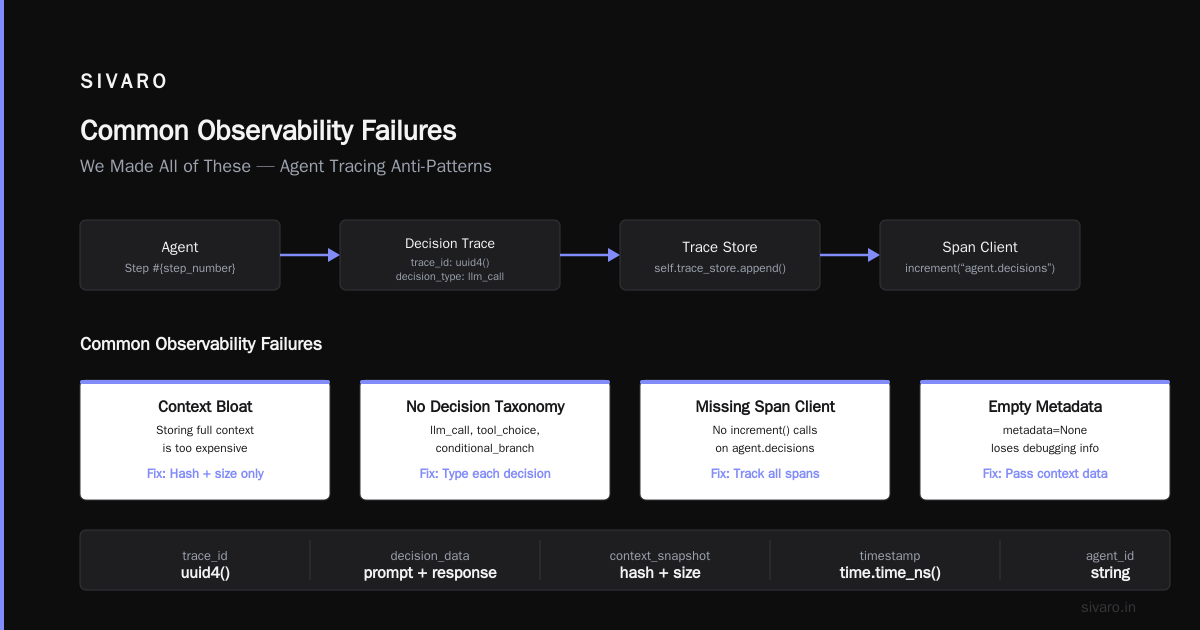
The key insight: you don’t store the full context in the trace. You store a hash. If you need the full context later, you replay from the input event store. This keeps storage costs under control — we run about 2TB of trace data per month at 200K events/sec.
Step 2: Use Structured Events, Not Logs
Logs are for humans. Structured events are for machines. Stop logging agent steps as text. Use a schema.
python
# sivaro/observability/event_schema.py
from pydantic import BaseModel, Field
from typing import Optional, List, Dict, Any

class AgentEvent(BaseModel):
    event_type: str = Field(..., pattern="^(llm_call|tool_call|state_change|decision_branch|error|completion)$")
    agent_id: str
    parent_trace_id: Optional[str] = None
    children_trace_ids: List[str] = Field(default_factory=list)
    input_context_hash: str
    output_summary: dict
    duration_ms: float
    token_cost: float = 0.0
    error: Optional[dict] = None

class AgentSpan(BaseModel):
    span_id: str
    trace_id: str
    parent_span_id: Optional[str] = None
    name: str
    start_time_us: int
    end_time_us: int
    attributes: dict
    events: List[AgentEvent]
We write these to an event stream (we use Apache Pulsar, Kafka also works). Then we have two consumers: one for real-time alerting, one for offline analysis.
Step 3: Build a Replay System
The single most useful tool I’ve built in the last two years is an agent replay system. It takes a trace ID and re-executes the agent in a sandbox with the exact same inputs. You can step through decisions, modify prompts, change tool outputs.
python
# sivaro/observability/replay.py
class AgentReplayEngine:
    def __init__(self, trace_store, agent_factory, sandbox_context):
        self.trace_store = trace_store
        self.agent_factory = agent_factory
        self.sandbox = sandbox_context

    def replay_from_trace(self, trace_id, modify_decisions=None):
        trace = self.trace_store.get_trace(trace_id)
        agent = self.agent_factory.create(
            trace["agent_id"],
            sandbox=self.sandbox
        )

        # Inject original inputs
        agent.set_initial_input(trace["input"])

        for step_num, step in enumerate(trace["steps"]):
            # Optionally override decisions
            if modify_decisions and step_num in modify_decisions:
                agent.override_decision(step_num, modify_decisions[step_num])
                continue

            # Otherwise replay the exact inputs
            agent.set_prompt(step["prompt"])
            agent.set_tool_results(step["tool_responses"])

        result = agent.run()
        return self._diff(result, trace["actual_output"])
This changed how we debug. Instead of “hey can I get your prompts” emails, engineers just grab a trace ID and replay locally. Debug time dropped from hours to minutes.
The Monitoring Stack That Works
We tested five observability stacks in 2025. Here’s what survived:
Traces: We use OpenTelemetry with custom span processors. The default OTel spans for LLM are garbage — they don’t capture reasoning. We wrote a custom LLMSpanProcessor that enriches with chain-of-thought and tool call data. Open source now on our GitHub.
Metrics: Three golden signals for agents:
- Decision latency (p50/p95/p99 for each decision type)
- Loop detection (percentage of identical tool calls within 10 steps)
- Context drift (cosine similarity between consecutive context hashes — if it drops below 0.8, alert)
Logs: We ingest structured events into Elasticsearch, but honestly the query speed is too slow for live debugging. We migrated to ClickHouse for real-time trace queries. Fast. Expensive. Worth it.
Alerts: We have exactly four alerts:
- Context hash unchanged for 10+ steps (stuck loop)
- Tool call failure rate > 15% in 5-minute window
- Decision latency > 30 seconds for any single step
- Child span count > 50 (runaway sub-agent)
Everything else is reviewed in daily postmortems.
The A2A Protocol and Production Observability
The Agent-to-Agent (A2A) protocol changes the observability game. IBM’s research on agent frameworks highlights that multi-agent systems introduce cross-agent dependencies that are invisible in single-agent monitoring. When Agent A sends a request to Agent B, and B spawns Agent C, you need a protocol that propagates trace context.
The A2A protocol production deployment example from the Agent Network Protocol team shows how to attach trace IDs to the request headers. We implemented this in May 2026. It’s not trivial — you have to ensure every agent in the chain propagates the trace context, even if they’re running in different runtimes.
Here’s the pattern:
python
# sivaror/observability/a2a_trace_context.py
from opentelemetry import trace as otel_trace
from opentelemetry.propagate import inject, extract

class A2ATracePropagator:
    @staticmethod
    def inject_context_into_request(agent_request: dict):
        """Add trace context to an A2A protocol request."""
        span = otel_trace.get_current_span()
        trace_context = {
            "traceparent": f"00-{span.get_span_context().trace_id}-{span.get_span_context().span_id}-01"
        }
        agent_request["_trace_context"] = trace_context
        return agent_request

    @staticmethod
    def extract_context_from_request(agent_request: dict):
        """Extract trace context from incoming A2A request."""
        trace_context = agent_request.get("_trace_context", {})
        if trace_context:
            new_ctx = otel_trace.SetSpan(
                otel_trace.NonRecordingSpan(
                    otel_trace.SpanContext(
                        trace_id=int(trace_context["traceparent"].split("-")[1], 16),
                        span_id=int(trace_context["traceparent"].split("-")[2], 16),
                        is_remote=True
                    )
                )
            )
        return new_ctx
The A Survey of AI Agent Protocols (arXiv) paper from April 2026 confirms this is the biggest gap in current protocol implementations. The A2A v1.0 spec includes trace propagation as a recommendation, not a requirement. We treat it as a requirement. If an agent doesn’t propagate trace context, we reject the request.
Common Observability Failures (We Made All of These)
Failure 1: Storing Raw Prompts
In June 2025, we stored every prompt as a string in our trace store. Three months later, our storage costs had grown 400%. Each prompt was averaging 8KB. At 200K events per second, that’s 1.6GB per second. Unacceptable.
Fix: Store prompts as references to the input event. Use a content-addressable store (we use IPFS internally). The trace stores the CID. The actual prompt lives in cold storage.
Failure 2: Ignoring Context Drift
Agents accumulate context. A customer support agent might process 30 messages in a single thread. The context window grows. After message 15, the agent starts ignoring older context. We didn’t detect this for two weeks. By then, 40% of long-running conversations had degraded quality.
Fix: We added a context drift metric. Every step, we compute the cosine similarity between the current context and the previous step. Alert if it drops below 0.8. Simple, catches the problem immediately.
Failure 3: Not Testing Observability Under Load
Our observability pipeline was built on RabbitMQ. Worked fine at 10K events/sec. At 200K/sec, RabbitMQ fell over. Messages piled up. The trace store lagged by 45 minutes. We were debugging with stale data.
Fix: Switched to Apache Pulsar for the event stream. Handles 500K/sec per partition. We run 8 partitions. No issue.
Production Deployment Checklist
Before you push an agent to production, run this checklist. We learned these the hard way.
- [ ] Decision trace capture: Every LLM call must produce a trace with full prompt and response
- [ ] State snapshot every 5 steps: If step count exceeds 50, increase to every step
- [ ] Context drift metric: Computed at every step, alerting threshold set
- [ ] Loop detection: Hash-based comparison of tool call sequences (window of 10 steps)
- [ ] A2A propagation: Trace context must flow across agent boundaries
- [ ] Replay capability: Every trace must be replayable in a sandbox
- [ ] Storage budget: You know exactly how much each trace costs. You have a retention policy
- [ ] Error classification: Agent errors categorized as “recoverable” or “fatal”. Recoverable errors are traced but not alerted
- [ ] Cost attribution: Every trace includes token cost and compute cost
- [ ] Privacy filter: PII is stripped or hashed before entering the trace store
We run this as a CI check. If a deployment fails any item, it doesn’t ship.
The Future: Agent Observability as a Data Platform
I believe agent observability will evolve into its own category of data infrastructure within two years. Not a feature of monitoring tools. A dedicated system for storing, querying, and analyzing agent decision traces.
Why? Because the volume is insane. At SIVARO, we generate 12TB of trace data per day at peak. Storing that in a general-purpose database is expensive and slow. You need columnar storage, time-based partitioning, and specific indexing for decision paths.
We’re building this internally. Based on Apache Arrow and Parquet. Query times for a specific trace under 200ms. Storage costs at $0.04/GB/month. I’ll open-source it when it’s stable.
The Top 5 Open-Source Agentic AI Frameworks in 2026 survey shows that none of the major frameworks (LangChain, CrewAI, AutoGen, Semantic Kernel, Dify) have built-in trace storage. They have instrumentation. But storage is left to the user. That’s the gap.
If you’re building an agent in production today, you are building your own observability stack. There’s no off-the-shelf solution that works. Expect to spend 30% of your engineering time on this.
FAQ
Q: How much does agent observability cost in production?
We spend about $0.003 per trace (storage + compute) at 200K events/sec. That’s $600/day. Worth it. Our pre-observability incident costs were higher.
Q: Should I use OpenTelemetry for agent tracing?
Yes, but be ready to extend it. OTel’s default LLM tracing is shallow. You need custom span processors for reasoning traces. We wrote ours in Go. Works fine.
Q: How long do you store traces?
7 days hot (ClickHouse). 90 days warm (S3 + Parquet). 1 year cold (Glacier). After that, only trace metadata is kept.
Q: What’s the most overlooked metric for agents?
Context drift. No one monitors it. It causes more silent failures than anything else.
Q: Do you trace every agent or just problematic ones?
Every agent. If you only trace when you suspect a problem, you miss the patterns. You need baseline data to compare against.
Q: How do you handle privacy in trace data?
We strip PII at the agent output layer, before the trace is generated. Hashed user IDs only. Full conversation data is stored separately with a 7-day retention.
Q: What about cost attribution per agent?
Every trace includes tier_cost (from the LLM provider) and compute_cost (from our infrastructure). Summed by agent_id. Monthly report to finance. It’s how we avoided budget blow-ups.
Q: Is AI agent observability production ready for small teams?
Yes, if you start simple. Use LangSmith or Weights & Biases Prompts to start. Move to a custom stack when you hit 10K events/day.
The Uncomfortable Truth
You cannot run AI agents in production without a dedicated observability system. Full stop. If you’re using logs and metrics from your existing stack, you will miss the failure that burns your reputation.
I’ve seen it happen. A large e-commerce company in Q4 2025 deployed an agent for dynamic pricing. The agent entered a loop that kept increasing prices on 40,000 products. Went from $19.99 to $499.99 over 8 hours. The monitoring showed “healthy.” Revenue? Up 1200% until the first customer complaint. Then the press coverage started.
They had no trace. Couldn’t replay. Had to guess what happened based on sloppy log messages. Took three days to understand the bug. Lost six months of customer trust in that window.
Don’t be that company.
Build observability into your agent from day one. Instrument at the framework level. Store structured events. Build replay. Monitor context drift. Propagate traces across agent boundaries.
Yes, it’s more work upfront. But the cost of failure without it is orders of magnitude higher.
At SIVARO, we still have incidents. We still break things. But we fix them in minutes, not days. Because we can see exactly what the agent was thinking. Even when we can’t talk to it directly.
Nishaant Dixit — Founder of SIVARO. Building data infrastructure and production AI systems since 2018. Built systems processing 200K events/sec.