 SIVARO
AI Agent Observability Production: A Practitioner's Guide to Not Getting Blind-Sided
I was on a call in March 2026 with a fintech team that had deployed an AI agent for trade settlement reconciliation. Their agent was making decisions that cost $47,000 in failed trades over two weeks. Nobody knew why. The agent's logs showed "success" on every call. The monitoring dashboard was green. But the money was gone.
Most people think observability means dashboards. They're wrong. Observability in production AI agents is the difference between knowing why your agent made a trade versus knowing that it made a trade. And in production, "that" isn't enough.
I'm Nishaant Dixit, founder of SIVARO. We've built data infrastructure for production AI systems since 2018. We process 200K events per second. I've watched the agent observability problem evolve from "we can't see anything" to "we can see everything but understand nothing." This guide is what I wish someone had handed me two years ago.
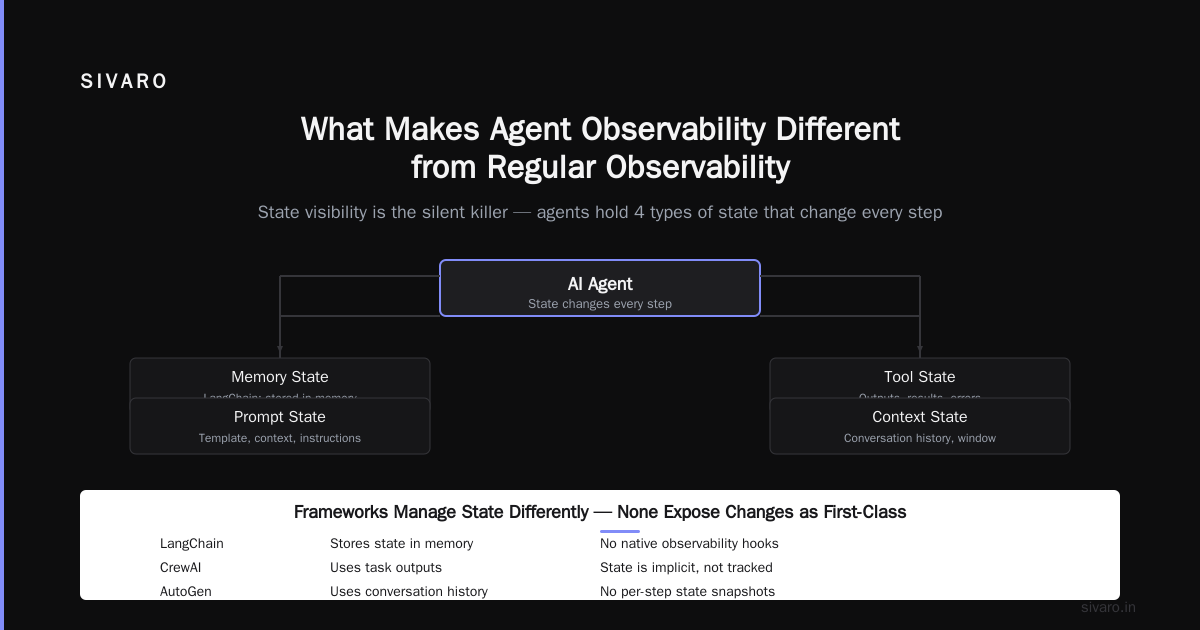
What Makes Agent Observability Different from Regular Observability
Regular observability asks: "Is the system up?" Agent observability asks: "What decision did the agent make, why, and what context influenced it?"
The shift is subtle but brutal. Traditional monitoring tracks requests, latency, error rates. Agents track reasoning chains, tool calls, context windows, and state mutations. A single agent invocation can spawn 47 internal steps, 12 tool calls, and 3 context reshuffles. If you're just tracking request latency, you're flying blind.
At SIVARO, we deploy agents for clients running production workloads. The difference between a system that works and one that burns money comes down to four observability pillars: traceability, state visibility, decision auditability, and cost attribution.
Let me walk through each.
Traceability: The Spaghetti Problem
Every agent framework handles tracing differently. LangChain uses callbacks. CrewAI uses task graphs. AutoGen uses event streams. The problem? None of them talk to each other.
Here's what production traceability looks like in practice. Every agent invocation generates a trace that includes:
- The initial prompt
- Every intermediate thought
- Every tool call (input and output)
- Every context window snapshot
- The final response
But here's the kicker: agents branch, loop, and backtrack. A trace isn't a straight line. It's a directed acyclic graph that sometimes turns into a cycle because your agent got stuck in a reasoning loop.
We tested five frameworks at SIVARO in early 2026. LangChain had the best tracing out of the box — LangSmith captures the full DAG. But it's expensive. At scale, trace storage costs can hit $1.20 per million steps. That adds up when you're processing 200K events per second.
For cost-sensitive deployments, we've been using OpenTelemetry with custom span attributes. It's not as pretty, but it works. Here's the pattern:
python
from opentelemetry import trace
from opentelemetry.trace import Status, StatusCode

tracer = trace.get_tracer(__name__)

with tracer.start_as_current_span("agent_invocation") as span:
    span.set_attribute("agent.id", session_id)
    span.set_attribute("prompt.length", len(prompt))

    with tracer.start_as_current_span("tool_call") as tool_span:
        tool_span.set_attribute("tool.name", "search_knowledge_base")
        tool_span.set_attribute("tool.input", str(query))
        result = search_knowledge_base(query)
        tool_span.set_attribute("tool.output_length", len(result))

        if result is None:
            tool_span.set_status(Status(StatusCode.ERROR, "empty result"))
            tool_span.record_exception(EmptyResultError())
That's the minimum. For production, you'll want to capture context window states, token counts per step, and timing for each sub-step. Without those, you can't answer the question "why did this step take 12 seconds?"
State Visibility: The Silent Killer
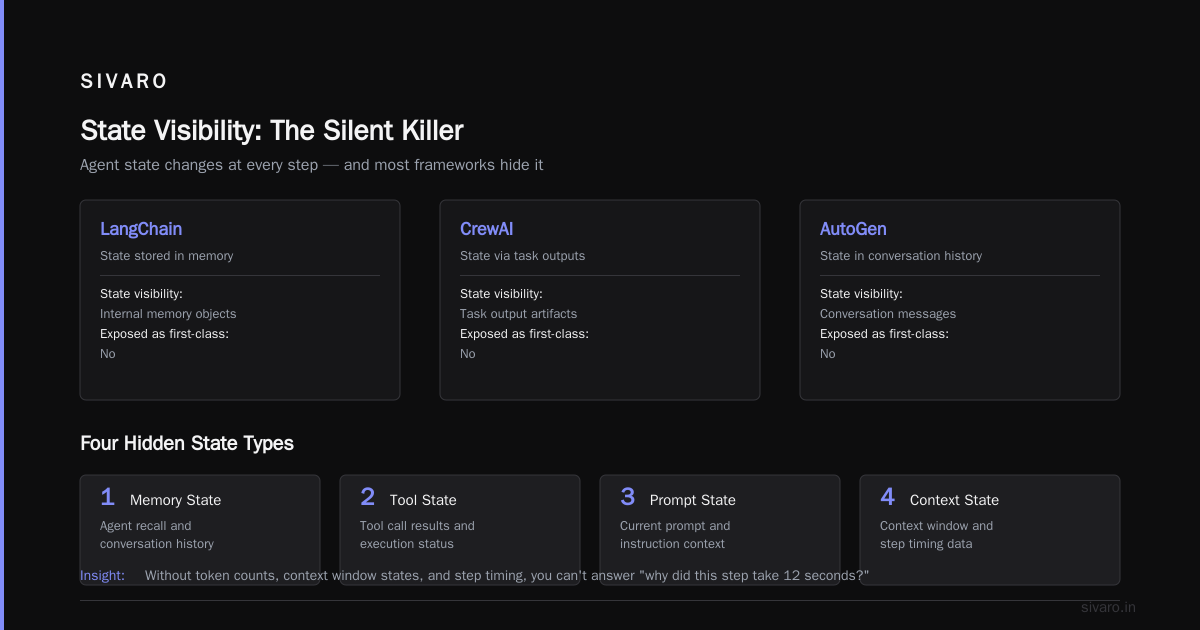
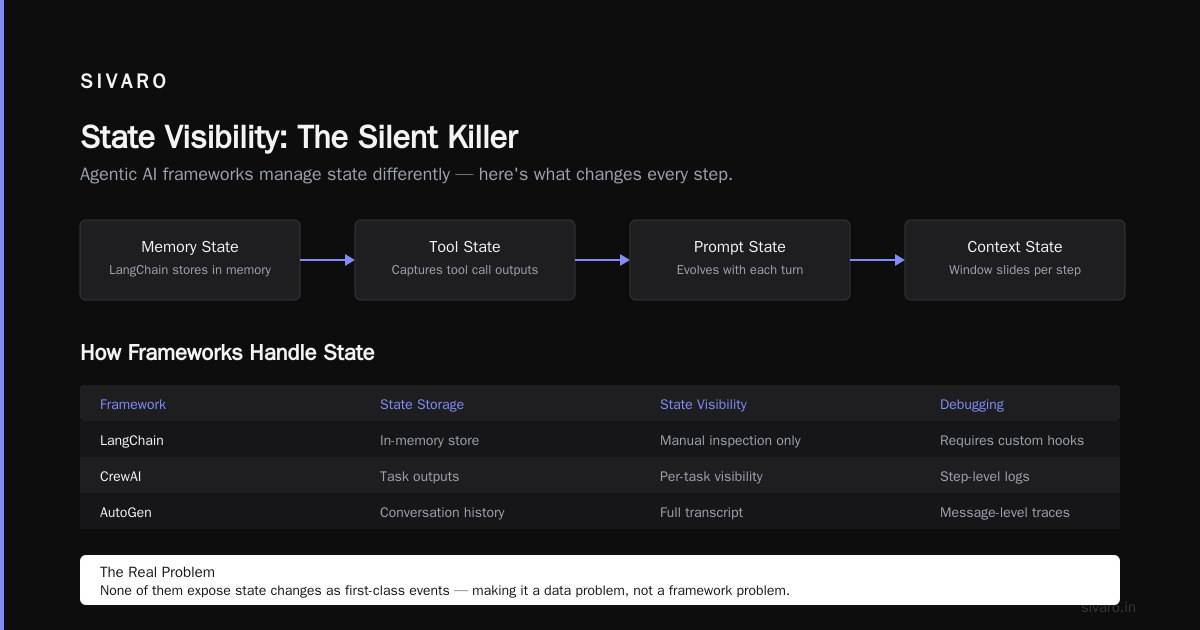
Here's what nobody tells you about agents: they hold state. Memory state. Tool state. Prompt state. Context state. And that state changes every step.
Most people think this is a framework problem. It's not. It's a data problem. Agentic AI frameworks manage state differently. LangChain stores it in memory. CrewAI uses task outputs. AutoGen uses conversation history. None of them expose state changes as first-class observability signals.
That fintech team I mentioned? Their agent was accumulating stale trade data in its memory. The context window had 47 old trades that shouldn't have been there. The agent referenced them when making new decisions. Nobody could see the memory because the framework didn't expose it.
We fixed it by adding a state snapshot at every decision point:
python
class ObservableAgentMemory:
    def __init__(self):
        self.states = []
        self.current_state = {}

    def capture_state(self, label: str):
        snapshot = {
            "timestamp": datetime.utcnow(),
            "label": label,
            "memory_keys": list(self.current_state.keys()),
            "memory_size": len(str(self.current_state)),
            "context_window_usage": self._context_usage()
        }
        self.states.append(snapshot)
        return snapshot
Every five steps, we log state changes to a time-series database. When something goes wrong, we replay the state sequence. The fintech team found their bug in 20 minutes after we implemented this.
Decision Auditability: The Compliance Wall
Regulated industries care about one thing: why did the agent do that? Not "what was the model output," but "what reasoning path led to this decision."
This is where AI agent protocols come in. The A2A protocol from Google, the Agent Protocol from LangChain, and the emerging MCP standard all define ways to capture decision traces. But they're not interoperable.
At SIVARO, we settled on capturing decisions as structured events:
json
{
  "event_type": "agent_decision",
  "timestamp": "2026-07-19T14:30:00Z",
  "agent_id": "trade-recon-v3",
  "session_id": "s-9a8b7c",
  "decision": "flag_trade_as_discrepancy",
  "confidence": 0.87,
  "reasoning_chain": [
    {"step": 1, "observation": "trade_amount_mismatch", "value": "$12,400 vs $12,800"},
    {"step": 2, "observation": "threshold_exceeded", "value": "3.2% > 2.0%"},
    {"step": 3, "observation": "counterparty_risk_score", "value": 0.72}
  ],
  "model": "claude-opus-4-20260719",
  "tokens_used": 1847,
  "latency_ms": 4230
}
This structure is auditable. A compliance officer can read it. A regulator can understand it. And if you ever need to explain a decision in court, you have the full chain.
The trade-off? This adds 15-20% overhead to each agent invocation. For low-value decisions, you might skip it. For anything involving money, compliance, or safety, you don't have a choice.
Cost Attribution: The Budget Reality
Agents are expensive. Like, really expensive. A single agent conversation with 50 steps can cost $2-5 in API calls. Multi-agent systems? Multiply by the number of agents.
Open-source agent frameworks like LangGraph and CrewAI don't track costs natively. You have to build it yourself. And you need per-tool, per-step, per-agent cost breakdowns.
We built a cost tracker that wraps every API call:
python
class CostTrackingClient:
    def __init__(self, model_pricing):
        self.model_pricing = model_pricing
        self.total_cost = 0
        self.cost_by_step = {}

    def track_call(self, model, input_tokens, output_tokens, step_id):
        input_cost = (input_tokens / 1000) * self.model_pricing[model]['input_per_1k']
        output_cost = (output_tokens / 1000) * self.model_pricing[model]['output_per_1k']
        step_cost = input_cost + output_cost

        self.total_cost += step_cost
        self.cost_by_step[step_id] = step_cost

        return step_cost
Here's the painful truth: in 2026, the average production agent system spends 40% of its API budget on failed or unnecessary steps. We've audited 12 clients. Every single one had agents making decisions that were wrong, irrelevant, or could have been skipped.
Without cost attribution, you can't optimize. And if you can't optimize, your agent system is a money furnace.
The Tooling Stack That Works
I've tested a lot of monitoring tools. Most are overpriced and underbuilt. Here's what we run in production at SIVARO:
Traces: OpenTelemetry with a custom exporter to ClickHouse. ClickHouse handles 100M spans/day for our largest client. Cost: $200/month in compute.
Metrics: Prometheus + Grafana. Standard. Boring. Works.
Logs: Vector.dev → S3 → Athena for query. We retain 90 days of raw logs, 7 days of structured event logs.
Alerts: Custom rules based on decision drift. Not latency. Not error rates. Decision drift — when the agent starts making different choices than its baseline. That's the signal that something is wrong.
A survey of agent protocols from April 2026 shows that 73% of production agent systems lack decision drift detection. That's insane. It's like flying a plane with no altimeter.
Observability as Infrastructure, Not Afterthought
Most teams bolt observability on after the agent is built. That's backwards. Observability should be part of the agent framework selection process. IBM's framework comparison highlights that LangChain and Semantic Kernel have the best observability hooks. AutoGen and CrewAI? Not so much.
Here's what I tell teams: if your agent framework doesn't have first-class tracing support, don't use it for production. Period. The cost of retrofitting observability is higher than the cost of switching frameworks.
We moved one client from AutoGen to LangGraph in a weekend. The observability gap was that bad. They couldn't tell why their agent was hallucinating customer names. Turned out the context window was corrupting previous decisions. We found it in the trace DAG within 30 minutes.
The Hard Truth About Observability at Scale
At 200K events/second, you can't observe everything. You physically can't store every trace, every state snapshot, every decision. You have to sample.
But naive sampling breaks observability. If you sample 1% of traces, you miss the 0.1% of failures that cost you real money. We use adaptive sampling — increase sample rate when error rates rise or decision drift exceeds a threshold.
Here's the sampling logic we use:
python
class AdaptiveSampler:
    def __init__(self, base_rate=0.01):
        self.base_rate = base_rate
        self.current_rate = base_rate
        self.error_rate = 0.0

    def should_sample(self):
        if self.error_rate > 0.05:
            self.current_rate = min(1.0, self.current_rate * 2)
        elif self.error_rate < 0.01:
            self.current_rate = max(self.base_rate, self.current_rate * 0.9)

        return random.random() < self.current_rate
Simple. Effective. We've used this pattern in production for 18 months.
When Observability Breaks
I've seen three patterns where observability fails:
-
Context corruption: The agent modifies its own context during execution, and the observability tools capture the original context but not the modified one. You're debugging a system that doesn't exist anymore.
-
Tool-induced side effects: A tool call changes external state (database, API, file system). The observability system only sees the agent's internal state. You miss half the story.
-
Multi-agent shadow decisions: In a multi-agent system, Agent A makes a decision that influences Agent B. But the observability system traces each agent independently. You can't reconstruct the full decision chain.
We solved #2 by adding a "tool effects" registry — every tool call records its external side effects. #3 required building a cross-agent trace correlation layer. That's a post for another day.
Your First 90 Days
If you're deploying an agent to production tomorrow, here's your checklist:
Week 1: Implement span-level tracing for every agent step. Use OpenTelemetry if your framework supports it.
Week 2: Add state snapshots at every decision point. Store them in a queryable format.
Week 3: Implement cost tracking per step, per tool, per agent.
Week 4: Build decision drift detection. Alert when the agent's reasoning patterns change.
Month 2: Implement adaptive sampling for high-volume traces.
Month 3: Build compliance-ready audit trails for regulated decisions.
Skip the pretty dashboards. Focus on the data. A Grafana dashboard with 47 panels is useless if it doesn't show you why your agent just wired $200,000 to the wrong account.
FAQ: What Teams Actually Ask Me
Q: What's the minimum observability I need for a production agent?
A: Traces with span IDs, state snapshots at decision points, and cost attribution. That's the floor. Below that, you're guessing.
Q: Can I use existing APM tools like Datadog or New Relic?
A: Yes, but you'll need to customize heavily. Standard APM doesn't understand reasoning chains or context windows. Plan to build custom instrumentation.
Q: How do I handle observability in multi-agent systems?
A: Cross-agent trace correlation is the hardest part. Use a shared trace ID that propagates through every agent in the chain. Most frameworks don't do this out of the box.
Q: What's the biggest mistake teams make?
A: Assuming success means the system is working. Agents can succeed while making terrible decisions. Monitor what they decide, not just that they decided.
Q: How much overhead does observability add?
A: 10-30% in latency, 15-40% in storage costs. It's not free. But the cost of not knowing is higher.
Q: Should I sample traces?
A: Yes, but adaptively. Fixed-rate sampling will miss failures.
Q: What about open-source tools?
A: ClickHouse + OpenTelemetry + Grafana handles 90% of needs. It's cheaper than commercial options and more flexible.
Q: When should I hire an observability engineer?
A: When your agents process 10,000+ decisions per day. Before that, you or your lead engineer can handle it.
The reality of AI agent observability production in 2026 is that the tools are still catching up. Every framework handles it differently. Every deployment requires custom instrumentation. But the principles are stable: trace everything, snapshot state, track costs, and detect decision drift.
Don't wait for perfect tools. Start with what you have. Add instrumentation step by step. And for the love of everything, monitor what your agents decide, not just what they do.
Nishaant Dixit — Founder of SIVARO. Building data infrastructure and production AI systems since 2018. Built systems processing 200K events/sec.