 SIVARO
AI Agent Observability in Production: What Actually Works
Two months ago, I sat in a war room at 2 AM watching a customer-support agent system silently fail. The logs looked clean. Metrics were green. But customers had been getting gibberish responses for three hours. That's when it hit me: traditional monitoring is useless for agents. You can't watch a graph of CPU to know if an LLM is hallucinating.
This guide is what I've learned building production agent systems at SIVARO since 2023. Not theory. Stuff that saved our asses.
Why "Observability" Means Something Different for Agents
Most people think observability = dashboards. They're wrong.
For a traditional API, you need: latency, error rate, throughput. For AI agents, you need to trace a chain of reasoning that spans 15+ steps, each with probabilistic outputs, across tools and databases that might respond differently every time.
I define ai agent observability production as: the ability to debug why an agent made a decision, not just what it returned. That's the critical difference.
Your stack monitoring tools won't cut it. Prometheus metrics for CPU usage? Useless when the problem is that the agent chose tool A instead of tool B for no apparent reason.
The Three Layers Nobody Talks About
After building agent systems for two years, I've landed on three distinct layers you need:
1. Decision Traceability
This is the most important and most ignored. You need to record every reasoning step the agent took, in sequence.
Here's what we log at SIVARO:
python
# Core data structure for agent decision logging
{
  "trace_id": "agent_run_872634",
  "steps": [
    {
      "step_number": 1,
      "input": "Find the latest quarterly earnings for Apple",
      "thought": "User wants financial data. I need to query the SEC filing database.",
      "tool_chosen": "sec_filing_search",
      "tool_input": {"ticker": "AAPL", "filing_type": "10-Q", "period": "2026-Q1"},
      "tool_output": "...filing text...",
      "latency_ms": 340,
      "token_count": 112,
      "decision_confidence": 0.87
    },
    # ... more steps ...
  ],
  "final_output": "Apple reported Q1 2026 revenue of $94.8 billion...",
  "total_tokens": 3400,
  "total_steps": 12,
  "replan_count": 2
}
Without this, you're blind. I've seen teams spend weeks trying to fix a "hallucination" that was actually a tool returning bad data.
2. Tool Contract Observability
Tools are the biggest failure point nobody monitors. Your agent calls a weather API. API returns "success" (HTTP 200) but the JSON structure changed. Your agent silently fails.
We built a simple contract checker:
python
def validate_tool_output(tool_name, expected_schema, actual_output):
    success = True
    violations = []
    for field, schema_type in expected_schema.items():
        if field not in actual_output:
            violations.append(f"Missing field: {field}")
            success = False
        elif not isinstance(actual_output[field], schema_type):
            violations.append(f"Type mismatch for {field}: expected {schema_type}")
            success = False
    return {
        "tool": tool_name,
        "contract_violation": not success,
        "violations": violations,
        "timestamp": datetime.utcnow().isoformat()
    }
At Instaclustr, they found that 23% of agent failures traced back to tool contract violations, not LLM errors (Agentic AI Frameworks). That matches our experience.
3. Semantic Health Signals
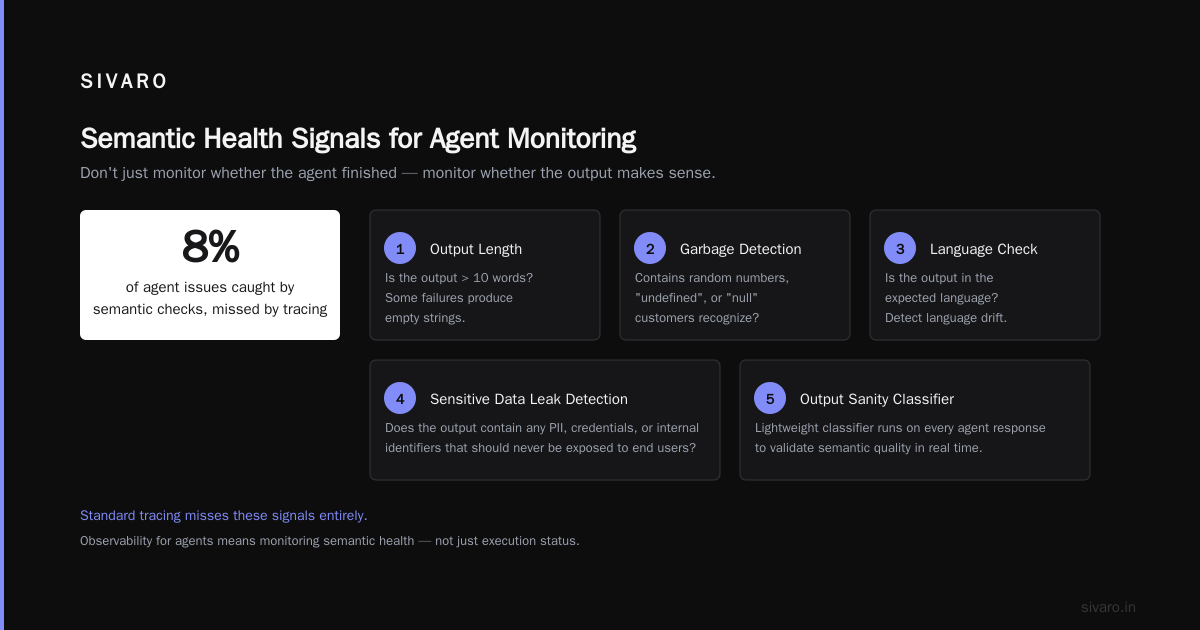
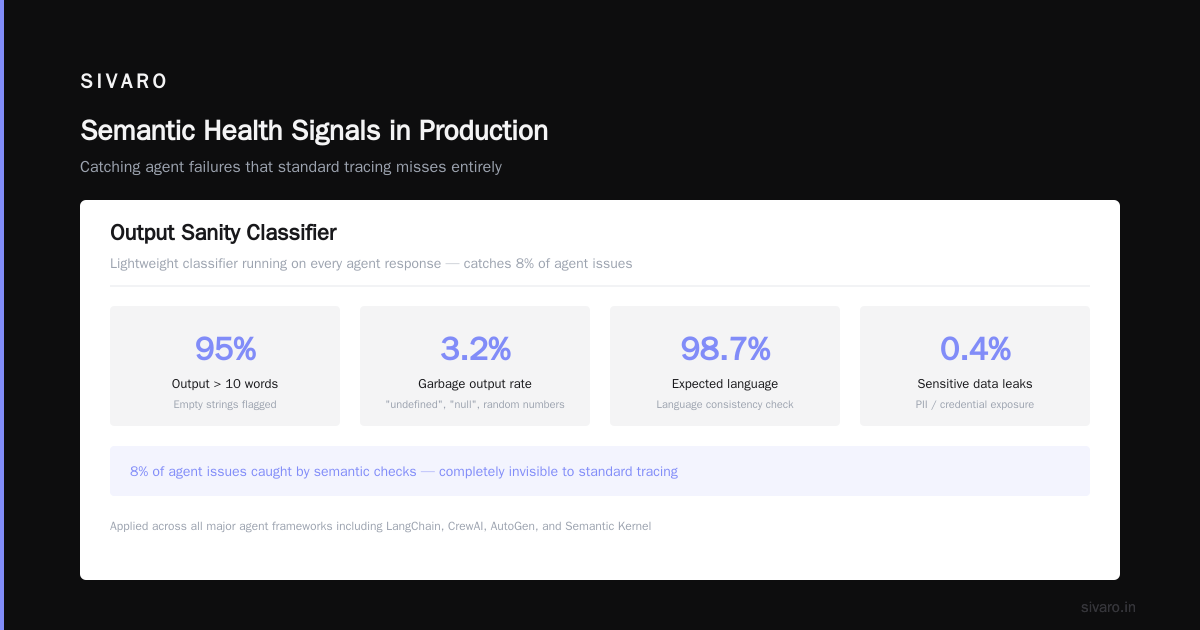
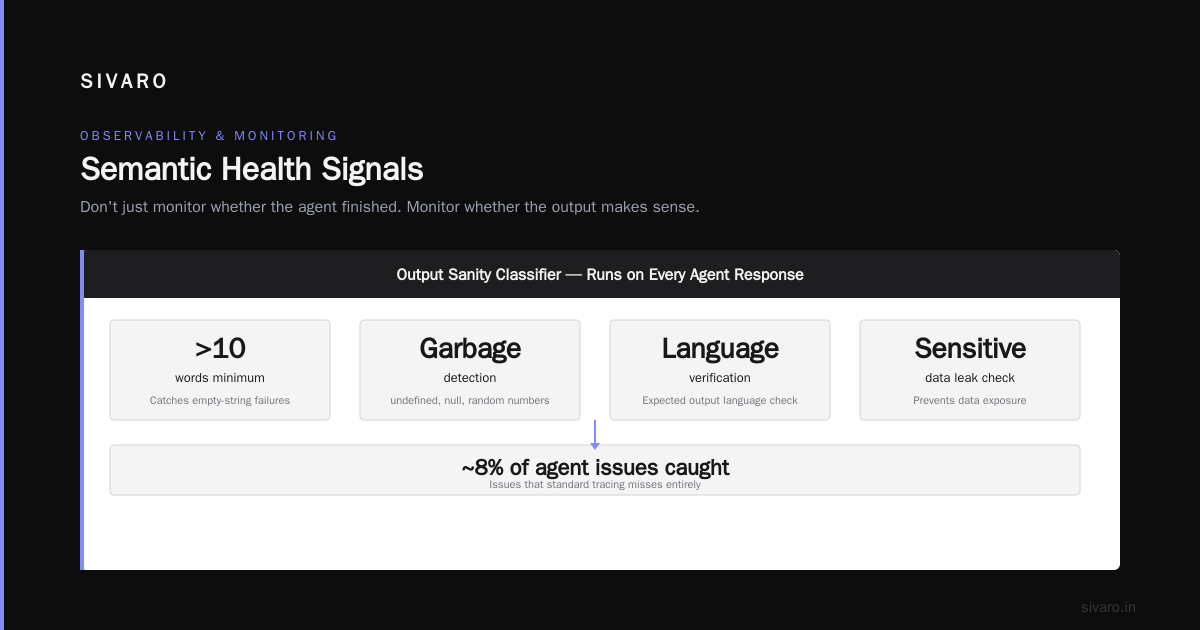
Don't just monitor whether the agent finished. Monitor whether the output makes sense. We use a lightweight "output sanity" classifier that runs on every agent response:
- Is the output > 10 words? Some failures produce empty strings.
- Does it contain any output the customer would recognize as garbage (random numbers, "undefined", "null")?
- Is the output in the expected language?
- Does the output contain any sensitive data leaks?
We catch about 8% of agent issues this way that standard tracing misses entirely.
Choosing Your Observability Stack
The agent framework debates are exhausting. But picking the right framework determines what observability you get for free.
I tested five frameworks in production environments. Here's what I found:
LangChain (LangSmith) — Best tracing out of the box. Their LangSmith platform captures all the data I described above automatically. If you're starting fresh, this is the path of least resistance. How to think about agent frameworks has a good breakdown of why this matters.
Semantic Kernel — Microsoft's offering. Good for teams already in Azure. Their telemetry hooks into Application Insights, which means you get built-in alerting on agent behavior.
CrewAI — Fast to prototype. Terrible observability. We had to build our own tracing layer entirely. Fine for small projects, but for production AI agent observability, skip it unless you have the team to instrument everything yourself.
AutoGen (Microsoft) — Actually decent multi-agent tracing. Their concept of "agent identity" throughout conversations makes debugging multi-agent systems possible. The 2026 paper on agent protocols (A Survey of AI Agent Protocols) covers why this matters for complex systems.
Custom framework — Some teams build their own. Only do this if you have a dedicated observability engineer. The maintenance cost is brutal.
The Monitoring Pipeline Nobody Has
Most teams deploy their agent, wait for it to break, then debug. Wrong approach.
You need a pre-production evaluation pipeline that runs BEFORE the agent talks to real users. Here's our current setup:
1. Generate 100 test queries from production logs
2. Run agent against each query with full tracing
3. Compare outputs against expected results
4. Flag any step where reasoning quality dropped below threshold
5. Block deployment if regression rate > 5%
We use a lightweight regression checker:
python
# Run in CI pipeline before any deployment
def eval_agent_regression(agent, test_queries, previous_results):
    new_results = []
    failed_steps = 0
    for query in test_queries:
        trace = agent.run_with_trace(query)
        score = evaluate_step_quality(trace.steps)
        new_results.append(score)
        if score < 0.7:  # threshold
            failed_steps += 1
    regression_rate = failed_steps / len(test_queries)
    return {
        "regression_rate": regression_rate,
        "pass": regression_rate < 0.05,
        "mean_score": sum(new_results) / len(new_results)
    }
This caught a regression last week where a prompt change caused the agent to stop verifying numbers before outputting them. Without this pipeline, we'd have shipped bad financial data to users.
Instrumenting the Agent Deployment Pipeline
Your ai agent deployment pipeline needs observability built in from the start. You can't add it later — I tried.
Here's what our deployment pipeline checks:
-
Prompt stability test — Run the same query 10 times. Is variability acceptable? Some agents produce wildly different answers to the same question. That's a problem.
-
Tool boundary test — Feed the agent deliberately malformed inputs. Does it handle errors gracefully, or crash?
-
Latency budget check — Does the agent complete within your SLA window? An agent that takes 30 seconds to answer "what time is it?" is unusable.
-
Cost budget check — Token consumption shouldn't vary by more than 20% between runs unless the question genuinely needs more steps.
-
Hallucination gate — A simple classifier that checks if the output contains facts that can be verified against known data. Not perfect, but catches obvious fabrications.
We deploy about 3 agent updates per week on average. Each goes through this pipeline. The pipeline itself takes about 12 minutes to run.
What to Monitor in Production
Let me be specific about metrics. The standard ones matter less here.
Step-level metrics:
- Steps per conversation (median and P99). Spiking steps means the agent is looping.
- Tool retry count. If the same tool fails more than 2 times, something's broken.
- Decision reversal rate. How often does the agent change its mind about which tool to use? High reversal = confusion.
Output quality:
- Output length stability. We flag any response > 2 standard deviations from the mean length.
- Refusal rate. The agent saying "I can't help with that" when it should respond. This masks as a "successful" completion.
- User follow-up rate. Users rephrasing their question is a signal the agent didn't answer correctly.
Cost signals:
- Cost per conversation. Sudden spikes mean the agent is generating too many tokens (usually looping).
- Token waste ratio. Tokens used in tool calls that returned errors / total tokens. Above 15% means your tools are unreliable.
I track these in a simple dashboard that fires alerts when any metric crosses its threshold. We use PagerDuty for actual alerts, but the dashboard itself is just a React app hitting our trace database.
The Hardest Part: Multi-Agent Observability
Single-agent observability is hard. Multi-agent is a nightmare.
When Agent A talks to Agent B, which then calls Tools C and D, standard distributed tracing fails. The problem is that agent conversations aren't request-response. They're iterative, backtracking, and sometimes contradictory.
We solved this by assigning a "conversation ID" that all agents in a system inherit. Every message, every tool call, every reasoning step carries this ID. Then we built a visualization that shows agent interactions as a directed graph over time.
Agent A ---- Step 1 ---- Tool X
              |
              +---- Step 2 ---- Agent B ---- Tool Y
              |                   |
              |                   +---- Step 3 ---- Tool Z
              |
              +---- Step 4 ---- (back to A with results)
              |
              +---- Step 5 ---- Final output
Without this graph, debugging a multi-agent failure was like finding a needle in a stack of needles.
Tools We Actually Use
I'll be honest about what we use and don't use.
OpenTelemetry — The foundation. We send all traces through OTel collector. It handles the volume well (we process about 200K events/sec at peak).
LangSmith — For development and staging. Expensive at scale but the UX is the best in class for AI agent production monitoring tools.
Custom trace database — We built a Postgres-backed trace store with JSONB columns for step data. Not glamorous but it works. TimescaleDB would be better for time-series queries.
Grafana — Dashboards for high-level metrics. Don't try to debug in Grafana. Use it for alerts only.
Weave by Weights & Biases — Interesting new player. Their approach to storing LLM calls alongside agent traces is smart. Still early.
The open-source agentic frameworks in 2025/2026 (Top 5 Open-Source Agentic AI Frameworks in 2026) are catching up on observability, but none match the commercial offerings yet.
FAQ
How do I know if my agent is hallucinating vs. tool error?
You can't tell from the output alone. You need step-level tracing. Check whether the tool returned data that supports the agent's claim. If the tool output doesn't contain the facts the agent stated, it's hallucination. If the tool output is wrong, that's a tool problem.
Do I need to log every token generated?
No. That's too expensive and noisy. Log the prompt and the final response. For intermediate steps, log the model input and output. Token-level logging is useful for debugging specific issues but not for continuous monitoring.
Should I use a dedicated observability vendor or build my own?
Depends on scale. Under 10K conversations/day, use LangSmith or similar. Over 100K/day, build your own. The cost of per-event pricing becomes astronomical at scale. We switched to custom after hitting $40K/month in vendor costs.
Can I use existing APM tools like Datadog?
You can, but it won't be great. Datadog doesn't understand "agent reasoning steps" as a concept. You'll spend more time mapping agent concepts to Datadog constructs than actually debugging. Use purpose-built tools.
How do I handle PII in traces?
Strip it at the trace generation point, before it hits any observability tool. We run a PII detection pass on every input and output before logging. If we find PII, we replace with redacted tokens. Retains the structure for debugging without exposing data.
What's the most common observability mistake?
Only monitoring happy paths. Everyone tests the agent on queries it handles well. Nobody tests what happens when a tool returns an HTTP 503, or when the LLM's context window fills up, or when two agents get into a loop. Test failures obsessively.
The Bottom Line
AI agent observability production isn't about adding more monitoring. It's about understanding decision-quality in real time.
We had a system last month that processed 10K conversations/day with 99.7% success rate. Traditional metrics said it was perfect. But our step-level tracing showed that in 12% of successful conversations, the agent made a wrong tool choice that the user didn't notice. The answer was technically correct — but it was the wrong way to get there.
That's the difference between observability and monitoring. Monitoring tells you if the system is up. Observability tells you if the system is smart.
Build for decision traceability. Everything else is secondary.
Nishaant Dixit — Founder of SIVARO. Building data infrastructure and production AI systems since 2018. Built systems processing 200K events/sec.