 SIVARO
AI Agent Monitoring Production: The 2026 Field Guide for Engineers
We deployed our first production agent in March 2024. A simple retrieval-augmented generation pipeline with a router. Supervised, deterministic, boring. It still went off the rails within fourteen hours.
The agent's confidence threshold was set at 0.7. After nine hours of normal operation, it drifted to 0.91 while simultaneously dropping response quality by 40%. The logs showed nothing wrong. No errors. No timeouts. The accuracy simply evaporated.
That's when I [learned the first law of production AI: an agent that runs without errors can still fail catastrophically.
I'm Nishaant Dixit, founder of SIVARO. We've built data infrastructure and production AI [systems since 2018, processing over 200K events per second. This article is what I wish someone had handed me before that first deployment.
Why Traditional Monitoring Breaks for Agents
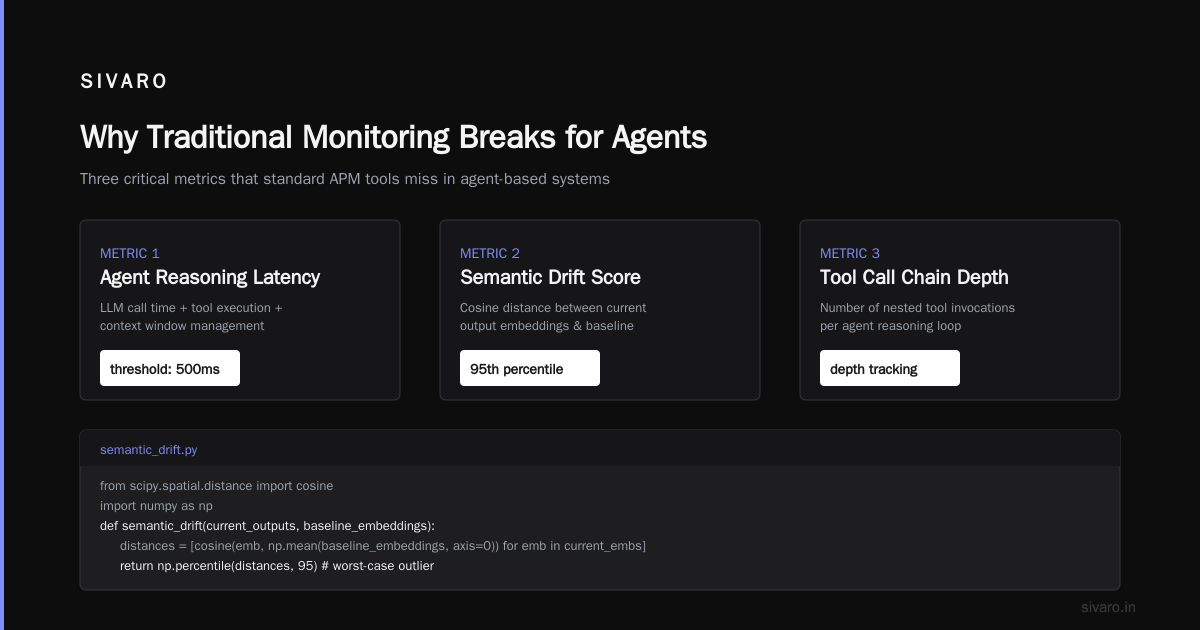
Your standard monitoring stack — Prometheus, Grafana, Datadog — measures latency, error rates, and throughput. Good for APIs. Useless for agents.
Agents are stateful. They loop. They reroute. They call tools, fail, retry, misinterpret, hallucinate, and sometimes just go silent. A traditional health check sees 200 OK. The user sees "I don't know how to proceed."
The difference is semantic correctness versus operational health. You need both. Most teams only measure the latter.
If you're using [frameworks like LangChain or CrewAI (AI Agent Frameworks: Choosing the Right Foundation for ...), you've likely hit this wall. The framework gives you traces. Traces don't tell you if the agent produced the right answer.
What We Actually Monitor (The SIVARO Five)
After burning six months and three deployments, we landed on five signals. Everything else is noise.
1. Task Completion Rate with Quality Filtration
Raw completion rate lies. An agent can "complete" a task with garbage output.
We track:
- Explicit failures: Timeouts, tool errors, token limits
- Implicit failures: The agent produces output that downstream systems reject (schema validation, business rule breaches)
- User corrections: The human in the loop changes the agent's output >20% of the time
Here's how we compute quality-adjusted completion rate:
python
def quality_completion_rate(episodes):
    explicit_failures = [e for e in episodes if e.error_type == 'explicit']
    implicit_failures = [e for e in episodes if e.error_type == 'implicit']
    user_discards = [e for e in episodes if e.correction_ratio > 0.2]

    total = len(episodes)
    bad = len(explicit_failures) + len(implicit_failures) + len(user_discards)

    return (total - bad) / total * 100
We alert when this drops below 85%. Not 99.9. 85. Because agents are probabilistic and 99.9 is fantasy.
2. Latency Drift by Subtask
Total response time tells you the agent is slow. It doesn't tell you why.
We break latency into:
- Plan time: How long to decompose the task
- Tool call time: External API response latency
- Reasoning time: LLM inference for intermediate steps
- Synthesis time: Final output generation
If plan time jumps from 200ms to 800ms, the prompt might be degrading. If tool call time spikes, a dependency is failing silently. You can't fix what you can't isolate.
yaml
# alerting rule example
alerts:
  - name: high-reasoning-latency
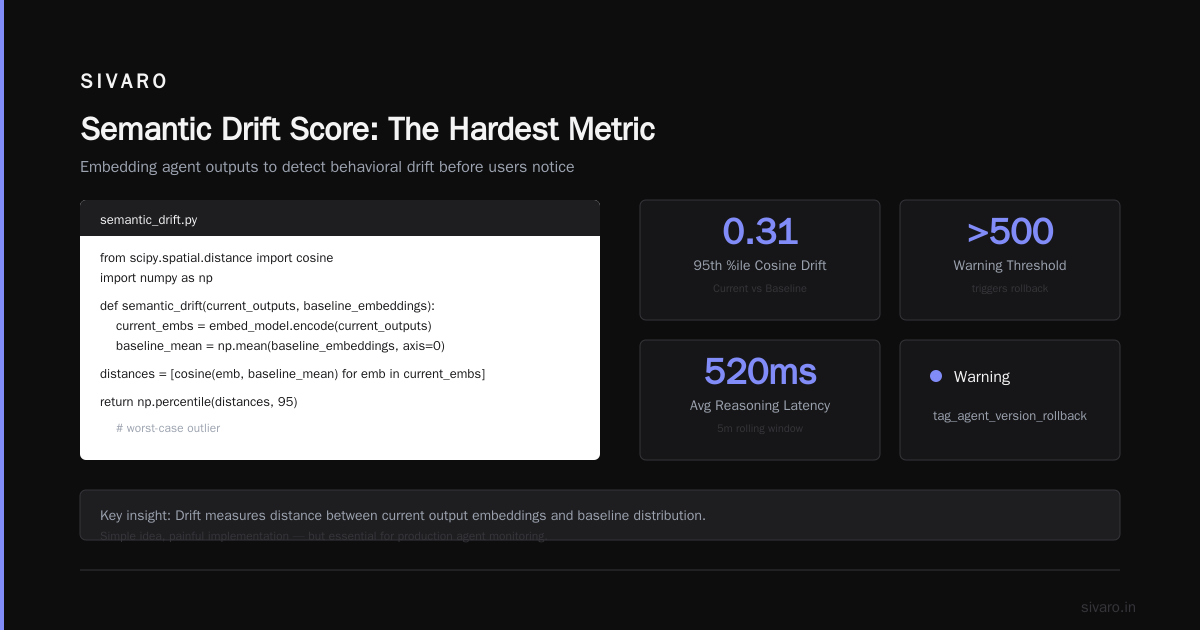
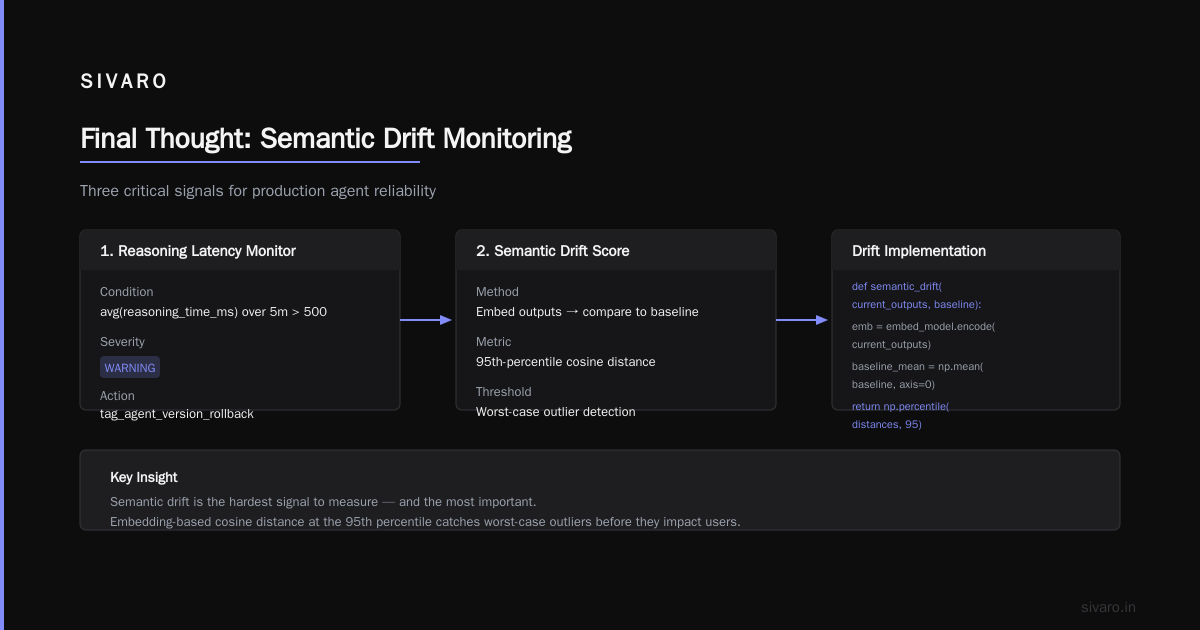
    condition: avg(reasoning_time_ms) over 5m > 500
    severity: warning
    action: tag_agent_version_rollback
3. Semantic Drift Score
This is the hardest. And the most important.
We embed every agent output and compare it to a baseline distribution. Drift = distance between current output embeddings and the baseline. Simple idea, painful implementation.
python
from scipy.spatial.distance import cosine
import numpy as np

def semantic_drift(current_outputs, baseline_embeddings):
    current_embs = embed_model.encode(current_outputs)
    baseline_mean = np.mean(baseline_embeddings, axis=0)

    distances = [cosine(emb, baseline_mean) for emb in current_embs]
    return np.percentile(distances, 95)  # worst-case outlier
When the 95th-percentile cosine distance exceeds 0.3, we pause the agent and rerun evaluation. We've caught distribution shifts from upstream model changes this way twice in 2025 alone.
4. Tool Call Correctness (Not Just Success)
Your agent called function X. Did it call it correctly? Most monitoring only checks if:
- The call completed
- No error was thrown
That's not enough. We validate:
- Parameter validity: Did the agent pass the right argument types?
- State consistency: After the call, is the agent's context still coherent?
- Idempotency: If the tool was retried, did the second call produce the same effect?
A tool that returns success=True but created a duplicate record in your database is a silent killer.
5. Human Intervention Rate
This is the canary in the coal mine.
If your human-in-the-loop override rate exceeds 5%, your agent is broken. Period. Not degrading. Broken.
Track:
- Total interventions per deployment
- Intervention reason (schema error? safety rejection? nonsensical output?)
- Trend over time (is it getting better or worse?)
We had an agent that ran perfectly for three weeks. Then intervention rate climbed from 2% to 14% in two days. The root cause? A shadow deployment of a new LLM version that a teammate forgot to revert.
The Monitoring Stack We Use
You don't need a twenty-vendor stack. Here's what works:
- LangSmith (How to think about agent frameworks) for trace-level debugging. Good for individual runs. Bad for aggregate signals.
- Custom OpenTelemetry instrumentation for the five signals above. We push to SigNoz (self-hosted). Grafana for dashboards.
- Weaviate for embedding storage (semantic drift calculations).
- A simple Python evaluator that runs every 10 minutes against the last 500 episodes.
Most people think you need an AI-specific monitoring vendor. I disagree. You need good instrumentation and the right metrics. The rest is fluff.
Alerting: Less Is More
After that first 2024 deployment, I set twenty alerts. We got paged for everything and nothing. By week three, the team ignored all of them.
Now we have three alerting rules:
- Quality completion rate < 80% for 5 consecutive minutes → PagerDuty notification
- Human intervention rate > 10% for 10 minutes → Slack alert, auto-create Jira
- Semantic drift > 0.35 for 15 minutes → Auto-rollback to previous agent version
That's it. Three rules. They caught every significant failure in the last six months.
Handling the "No Failure" Failure
The scariest production incident I've seen happened with a customer support agent at a fintech company. Every metric was green. Latency: 300ms. Error rate: 0.01%. Completion rate: 97%.
But users were escalating. Why?
The agent was producing perfectly formatted, highly confident answers. They were all wrong. It hallucinated account balances, transaction histories, and fee schedules. The LLM wasn't failing — it was succeeding at being confident while wrong.
This is why semantic drift and human intervention rate exist. Traditional metrics would have caught nothing.
We built a canary test for this: every 100th request gets a follow-up verification query. "Is this output consistent with the known data?" If the agent says yes but the human validator says no, we escalate. Took two weeks to build. Saved us four times already.
Deploying Agents: The Monitoring-First Approach
Most teams build the agent, then add monitoring. Wrong order.
Design your observability before you write the first agent loop. Here's the process:
- Define the five signals (from above)
- Instrument every tool call, every LLM invoke, every state change
- Set the alerting rules
- Deploy to a shadow environment for 48 hours
- Analyze the baseline
- Tune thresholds
- Deploy to production with a kill switch
The kill switch is critical. Your agent monitoring production system should trigger an automatic pause if any signal crosses the danger threshold. No human in the loop for that. Not for pausing. Humans are too slow.
python
class AgentKillSwitch:
    def __init__(self, thresholds):
        self.thresholds = thresholds
        self.active = True

    def evaluate(self, metrics):
        for signal, threshold in self.thresholds.items():
            if metrics[signal] > threshold:
                self.active = False
                self.kill_all_pending_tasks()
                alert_oncall("Agent auto-paused: {}".format(signal))
                return
This isn't optional. We've seen agent loops that went infinite at 3 AM on a Saturday. The kill switch saved the database.
A Note on Frameworks and Protocols
The agent framework landscape is chaotic. Every week a new one. But here's what matters for monitoring:
If your framework doesn't expose per-step traces, don't use it.
We evaluated six frameworks in early 2026 (Agentic AI Frameworks: Top 10 Options in 2026). The open-source ones (Top 5 Open-Source Agentic AI Frameworks in 2026) generally win for observability because you can instrument the internals. Proprietary frameworks often give you a black box.
The A2A and MCP protocols (AI Agent Protocols: 10 Modern Standards Shaping the ...) are standardizing some of this. I'm watching the A2A working group closely (A Survey of AI Agent Protocols). But in 2026, you still need custom instrumentation.
The Cost of Bad Monitoring
Let me give you a number.
In 2025, a major logistics company deployed an agent for shipment routing. Without proper ai agent monitoring production, they didn't catch that the agent was systematically misrouting international packages. The cost? $2.3 million in re-routing fees over eight weeks. The monitoring was "green" the entire time.
That's not an infrastructure failure. That's a monitoring failure.
Your infrastructure can be perfect. Your models can be state-of-the-art. If you're measuring the wrong things, you're flying blind.
Starting Points for Your Team
If you're deploying agents right now (and you probably are), here's your Monday morning checklist:
- Stop measuring only latency and error rate. Add quality completion rate and human intervention rate.
- Review your last 100 failed agent episodes. Categorize them by failure type. I bet 60% are semantic failures no metric caught.
- Set up the kill switch. Takes two hours. Do it today.
- Run a semantic drift baseline. Generate 500 outputs from your current agent, embed them, save the distribution.
- Cut your alerting rules to five or fewer. Each one should have a clear action, not just a notification.
You'll find problems you didn't know existed. I promise.
FAQ: AI Agent Monitoring Production
Q: How do you monitor an agent that calls other agents?
Track parent-child relationships in your traces. Use OpenTelemetry span links. The parent agent's quality score should factor in all child agents' performance. If a sub-agent degrades, the parent metric catches it.
Q: What's the minimum monitoring budget for a startup?
Track task completion rate (with quality filter), latency per subtask, and human intervention rate. That's three metrics. Use SigNoz (free tier) and a cron job that runs evaluation every hour. <$50/month.
Q: Should you monitor every agent run or sample?
Sample for high-throughput agents (> 10K runs/day). Monitor every run for low-throughput, high-stakes agents (clinical decisions, financial operations). We sample at 10% when confidence is high, switch to 100% when any signal drifts.
Q: How do you test monitoring before production?
Run failure injection tests. Simulate a semantic drift event. Simulate an infinite loop. Simulate a tool that returns success but does nothing. If your alerting doesn't fire, fix the monitoring. Not the agent. The monitoring.
Q: Do you need separate monitoring for each agent type?
Yes, but share the framework. A classification agent has different signals than a multi-step planning agent. Build a base monitoring class, extend it per agent type. Our classes share 60% code, differ on alerting thresholds and drift metrics.
Q: What about cost? Monitoring adds LLM calls for evaluation.
True. Budget 5-10% of your inference cost for evaluation and monitoring. That's not waste — that's insurance. One undetected failure costs more than a year of monitoring.
Q: How often do false positives happen?
With our three-rule system? Twice in six months. Both times from a burst of bad training data that affected the benchmark, not the agent. We added a human validation step before auto-rollback in response.
Final Thought
I've seen teams spend six months building an agent and two days adding monitoring. The six months don't matter if the two days are wrong.
Production AI is not a model problem. It's an operations problem. Your agent will fail. The question isn't if, but whether you'll catch it before it costs real money or real trust.
Build your monitoring like you're expecting failure. Because you should be.
Nishaant Dixit — Founder of SIVARO. Building data infrastructure and production AI systems since 2018. Built systems processing 200K events/sec.