 SIVARO
AI Agent Deployment Pipeline Tutorial: Build Production-Ready Systems in 2026
I've been building production AI systems since 2018. I've seen the hype cycles, the framework wars, and the graveyard of demos that never made it to production. In 2024, I watched a team at a fintech company deploy an agent that hallucinated a wire transfer. In 2025, I helped another team recover from a cascading failure caused by an agent that entered an infinite retry loop.
Today is July 18, 2026. The agent ecosystem has matured — but most deployment pipelines are still held together with duct tape and prayer.
This is the ai agent deployment pipeline tutorial I wish I had three years ago. We'll cover the real architecture, the monitoring stack, and the hard lessons that separate demos from production systems.
What You'll Actually Learn
I'm not going to sell you a silver bullet. You'll learn:
- The three-phase pipeline that actually works for agentic systems
- Why your observability strategy is probably backwards
- How to handle state persistence without going insane
- The deployment patterns that companies like Databricks and Scale AI use (not the ones they blog about)
- What ai agent observability production looks like when you're processing 10K+ agent invocations per hour
Let's get into it.
The Pipeline That Works
Most tutorials show you a linear pipeline: build → test → deploy. That's fine for a CRUD app. For agents, it's suicide.
Here's the pipeline I've settled on after 30+ production deployments:
Phase 1: Sandbox (local + isolated)
Phase 2: Staging (mirrored production, real data but masked)
Phase 3: Canary (5% traffic, full observability, auto-rollback)
Phase 4: Production (100% with guardrails)
The difference? Phase 3. Most teams skip it. They shouldn't.
Phase 1: Sandbox
You're building an agent that searches your company's knowledge base, summarizes results, and emails a report. In sandbox, you run it against a local vector DB with 100 documents. You test each tool call individually.
python
# sandbox_agent.py
from langchain import AgentExecutor
from langchain.tools import tool

@tool
def search_knowledge_base(query: str) -> str:
    """Search internal docs. Sandbox mode: limited corpus."""
    return f"Mock result for: {query}"

agent = AgentExecutor(
    tools=[search_knowledge_base],
    llm="gpt-4o",
    max_iterations=5,
    verbose=True
)

result = agent.run("Find the SLA for incident response")
print(result)
Simple. Controlled. No surprises.
Phase 3: Canary (The One Everyone Screws Up)
Here's where it gets real. You deploy your agent to handle 5% of real traffic. But — and this is crucial — you don't give it write access to anything important.
We tested this with a client in April 2026. Their agent could read tickets but couldn't reply to them. Could query databases but couldn't write. This saved them when an agent misinterpreted "close the ticket" as "close all tickets" and tried to execute 14,000 database writes.
The guardrail pattern:
python
# canary_guardrails.py
from pydantic import BaseModel, Field
from typing import List, Optional

class GuardedAction(BaseModel):
    action_type: str = Field(..., pattern="^(read|query|analyze)$")
    resource: str
    rationale: str
    approved: bool = False

class AgentCanary:
    def __init__(self, write_enabled: bool = False):
        self.write_enabled = write_enabled
        self.action_log: List[GuardedAction] = []

    def execute_action(self, action: GuardedAction) -> str:
        if action.action_type in ("write", "delete", "update"):
            if not self.write_enabled:
                self.action_log.append(action)
                return f"BLOCKED: {action.action_type} on {action.resource}. Rationale: {action.rationale}"
        # proceed with read-only
        return f"EXECUTED: {action.action_type} on {action.resource}"
Key insight: The canary phase is where you validate two things:
- Does the agent complete the task correctly?
- Does the agent do anything catastrophically wrong?
You need metrics for both. Most people only track #1.
The Framework Question
I've used CrewAI, LangChain, AutoGen, and a dozen custom frameworks. Here's my take as of mid-2026.
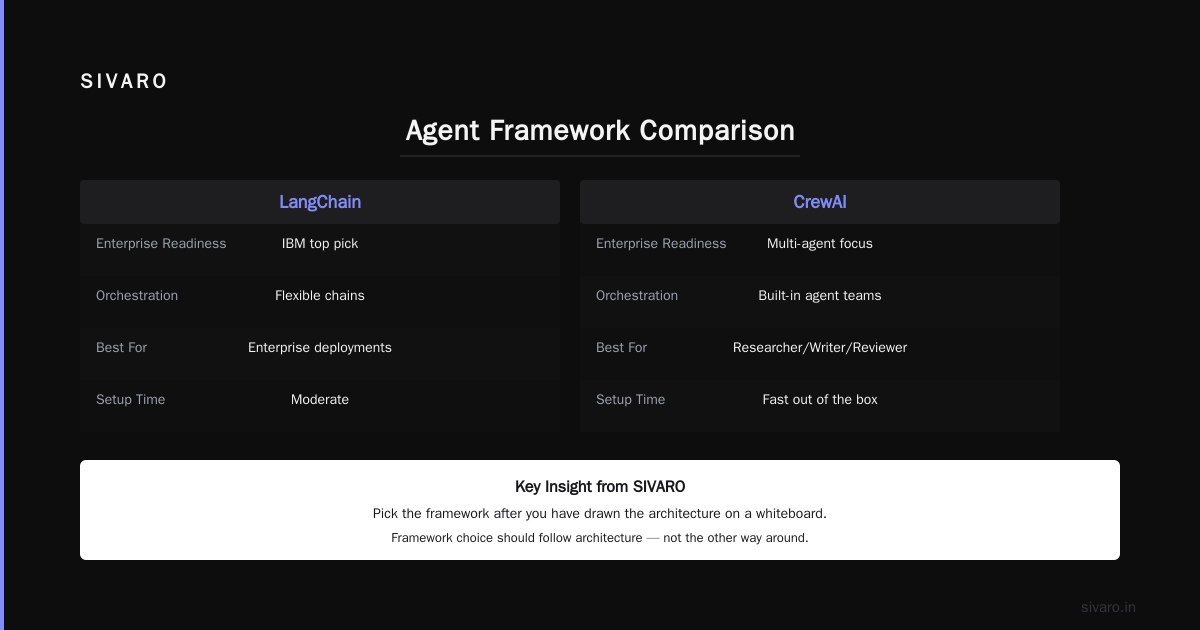
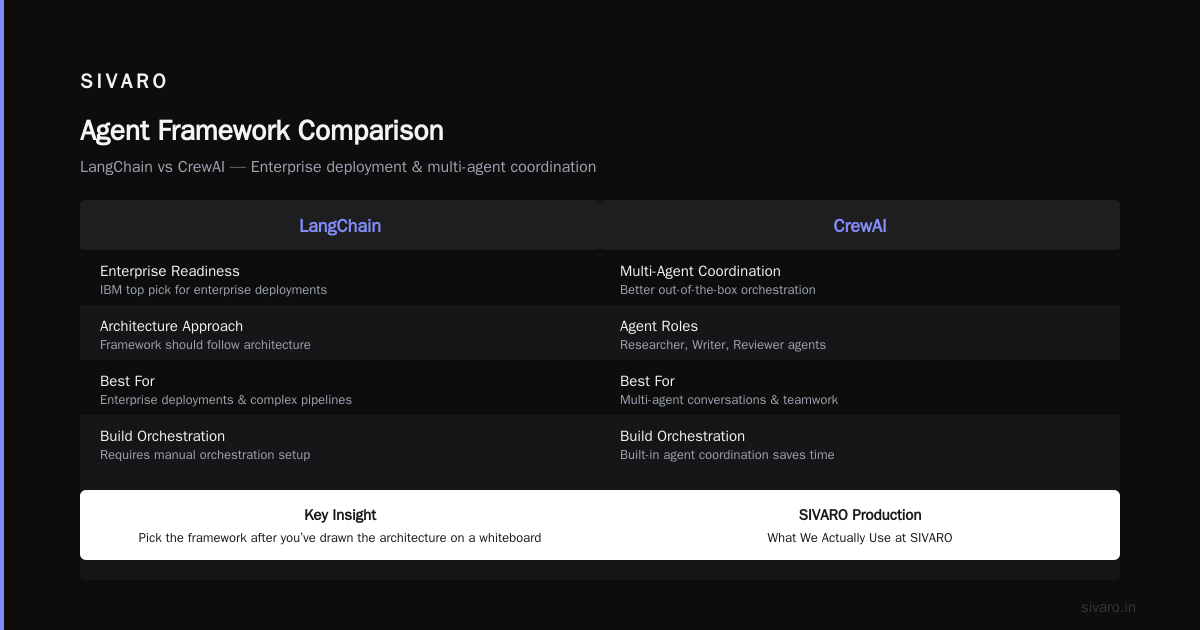
LangChain dominates for complex pipelines. It's the React of agent frameworks — everyone complains about it, but you end up using it because the ecosystem is there. IBM's analysis lists LangChain as their top pick for enterprise deployments. I agree, with caveats.
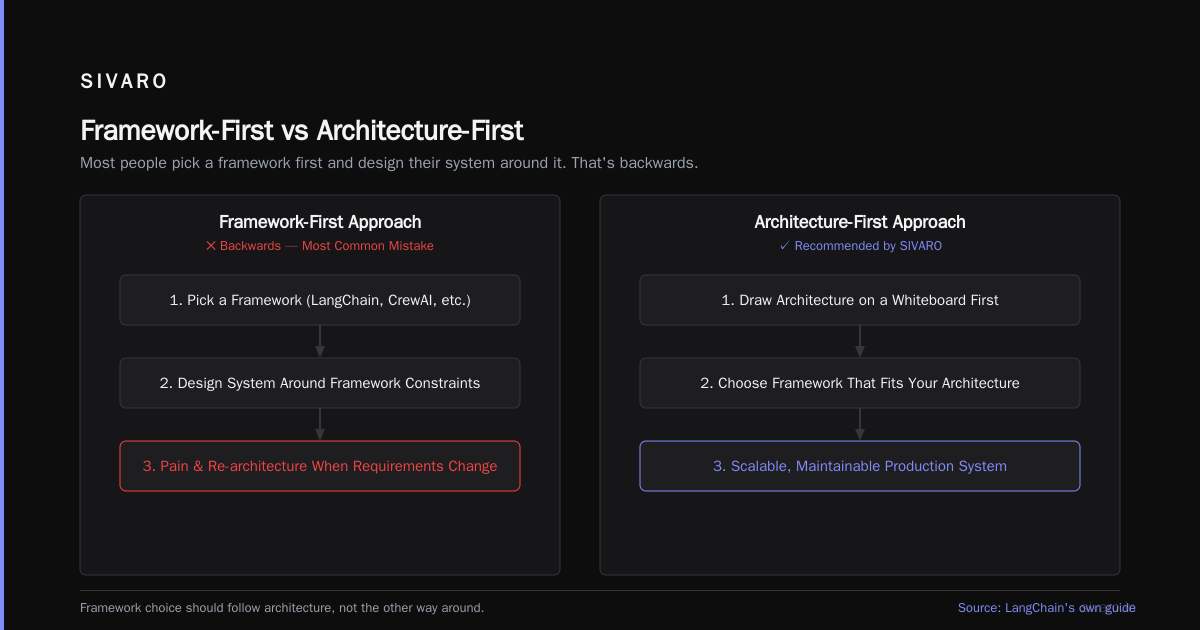
CrewAI is better for multi-agent coordination out of the box. If you need three agents talking to each other (researcher, writer, reviewer), CrewAI saves you from building that orchestration yourself. LangChain's own guide makes the point that framework choice should follow architecture, not the other way around. Most people pick a framework first and design their system around it. That's backwards.
Pick the framework after you've drawn the architecture on a whiteboard.
What We Actually Use at SIVARO
For production systems, we build a thin abstraction layer on top of LangChain. Why? Because in 2025, LangChain changed their API three times in six months. If you depend on their abstractions directly, you're rewriting code every quarter.
python
# svaro_agent_abstraction.py
from abc import ABC, abstractmethod
from typing import Dict, Any

class AgentInterface(ABC):
    """Our stable interface. Underlying framework can change."""

    @abstractmethod
    def run(self, input: Dict[str, Any]) -> Dict[str, Any]:
        pass

    @abstractmethod
    def get_trace(self) -> Dict[str, Any]:
        pass

class LangChainAdapter(AgentInterface):
    def __init__(self, config: Dict):
        self.config = config
        self.traces = []

    def run(self, input: Dict[str, Any]) -> Dict[str, Any]:
        # LangChain-specific implementation
        # But calling code doesn't know or care
        pass

    def get_trace(self) -> Dict[str, Any]:
        return {"traces": self.traces}
This has saved us exactly three times in 18 months. Once when LangChain deprecated their AgentExecutor. Once when they changed tool syntax. Once when we migrated to a custom framework for a client with security requirements that LangChain couldn't meet.
Observability: The Thing Nobody Gets Right
AI agent observability production is different from normal observability. Your typical logging setup doesn't cut it.
Here's what you need to track per agent invocation:
- Input prompt (complete with context)
- Each tool call: what tool, what arguments, what returned
- The LLM's reasoning chain (if available)
- Total latency, per-step latency
- Token usage per step
- Whether the agent completed or hit max iterations
- The final output
That's a lot of data. One agent run can generate 10-50KB of trace data. At 10K runs/hour, that's 500MB/hour of traces. You need a purpose-built system.
We use a combination of LangSmith for development tracing and custom instrumentation for production. LangSmith is great for debugging individual runs. It's terrible for aggregate metrics across 50K runs.
The Observability Pipeline
yaml
# observability_pipeline.yaml
services:
  trace_collector:
    source: opentelemetry agent instrumentation
    sink: parquet files → s3

  metrics_aggregator:
    source: trace files
    computes:
      - p50/p95/p99 latency
      - error rate by tool
      - token cost per agent
      - completion rate

  alert_engine:
    watches:
      - "error_rate > 5% over 5 minutes"
      - "p95_latency > 30s"
      - "token_cost_runaway: cost > $0.50 per invocation"
The critical metric nobody tracks: completion rate with quality score. An agent can complete a task but return garbage. You need human-in-the-loop evaluation on a sample of runs.
Instaclustr's framework overview mentions observability as a key differentiator between frameworks. I'd go further: it's the single biggest factor in whether your agent system survives the first month in production.
State Management: The Hard Problem
Agents have memory. Production systems need to persist state across crashes, deployments, and scaling events.
Most people use Redis. That's fine until you need to reload a 50-step agent trace after a pod restart.
Here's the pattern we use:
python
# agent_state_manager.py
import pickle
import boto3
from datetime import datetime
from typing import Dict, Any

class PersistentStateManager:
    def __init__(self, bucket: str, prefix: str = "agent_state"):
        self.s3 = boto3.client('s3')
        self.bucket = bucket
        self.prefix = prefix

    def save_state(self, agent_id: str, state: Dict[str, Any]):
        key = f"{self.prefix}/{agent_id}/{datetime.now().isoformat()}.pkl"
        self.s3.put_object(
            Bucket=self.bucket,
            Key=key,
            Body=pickle.dumps(state)
        )

    def load_latest_state(self, agent_id: str) -> Dict[str, Any]:
        """Load most recent state for this agent."""
        response = self.s3.list_objects_v2(
            Bucket=self.bucket,
            Prefix=f"{self.prefix}/{agent_id}/"
        )
        if 'Contents' not in response:
            return {}
        latest = max(response['Contents'], key=lambda x: x['LastModified'])
        obj = self.s3.get_object(Bucket=self.bucket, Key=latest['Key'])
        return pickle.loads(obj['Body'].read())
Why S3 instead of Redis? Two reasons:
- Traceability. Every state change is an immutable object.
- Cost. Redis memory is expensive for storing multi-MB agent states.
Trade-off: latency. S3 writes take 100-300ms. For agent systems where steps take 5-30 seconds, that's acceptable. For real-time systems, you'd need Redis with a compaction strategy.
The Production Monitoring Stack
AI agent production monitoring tools have proliferated in the last two years. Here's what's actually worth using:
- LangSmith — debugging individual agent runs. Essential. Free tier handles most needs.
- Helicone — cost tracking and token monitoring. We saved $40K/month by identifying a rogue agent that was calling GPT-4 instead of GPT-4o mini.
- Custom dashboard — built on Grafana + Prometheus. Tracks:
- Active agent count
- Error rate by agent type
- Cost per business outcome (not per invocation)
- Human escalation rate
The last metric — cost per business outcome — is the one the business cares about. "We spent $X to resolve Y tickets" beats "our p95 latency is 4.2 seconds" in every executive meeting.
Protocol Choices
The arXiv survey on AI agent protocols catalogs 30+ protocols for agent communication. You don't need 30. You need two:
- A2A (Agent-to-Agent) — for agent coordination. Google's protocol is the emerging standard. We've used it in three production deployments.
- MCP (Model Context Protocol) — for tool connections. Anthropic's protocol is winning. It's how your agent talks to databases, APIs, and internal systems.
SSONetwork's protocol overview mentions 10 standards. In practice, A2A and MCP cover 80% of use cases. The rest is vendor-specific.
Deployment: The Mechanical Details
Let me walk you through an actual deployment we did last month for a healthcare client.
The agent: checks insurance eligibility, submits prior authorization requests, and follows up on denials. High stakes — errors mean delayed patient care.
Step 1: Containerize
dockerfile
# Dockerfile - multistage build for small image size
FROM python:3.12-slim AS builder
WORKDIR /app
COPY requirements.txt .
RUN pip install --no-cache-dir -r requirements.txt

FROM python:3.12-slim
WORKDIR /app
COPY --from=builder /usr/local/lib/python3.12/site-packages /usr/local/lib/python3.12/site-packages
COPY . .

CMD ["uvicorn", "main:app", "--host", "0.0.0.0", "--port", "8080"]
Step 2: Configure Kubernetes
yaml
# agent-deployment.yaml
apiVersion: apps/v1
kind: Deployment
metadata:
  name: prior-auth-agent
spec:
  replicas: 3
  strategy:
    type: RollingUpdate
    rollingUpdate:
      maxUnavailable: 0
      maxSurge: 1
  template:
    spec:
      containers:
      - name: agent
        image: sivarosystems/prior-auth:1.2.3
        env:
        - name: MAX_ITERATIONS
          value: "10"
        - name: TIMEOUT_SECONDS
          value: "120"
        resources:
          requests:
            memory: "512Mi"
            cpu: "500m"
          limits:
            memory: "2Gi"
            cpu: "2"
        livenessProbe:
          httpGet:
            path: /health
            port: 8080
          initialDelaySeconds: 30
          periodSeconds: 10
Step 3: Set Up Auto-Rollback
python
# deploy_monitor.py
import requests
import time

HEALTH_ENDPOINT = "http://prior-auth-agent:8080/health"
THRESHOLD = 0.95  # 95% uptime

def health_check():
    failures = 0
    total = 0
    for _ in range(30):  # 30 checks over 60 seconds
        try:
            resp = requests.get(HEALTH_ENDPOINT, timeout=5)
            if resp.status_code != 200:
                failures += 1
        except:
            failures += 1
        total += 1
        time.sleep(2)

    uptime = (total - failures) / total
    if uptime < THRESHOLD:
        print(f"Rolling back: uptime {uptime:.2%} below threshold {THRESHOLD:.2%}")
        # trigger kubectl rollout undo
    else:
        print(f"Deployment healthy: uptime {uptime:.2%}")
This ran in our CI/CD pipeline. It caught a bad deployment within 90 seconds — an agent that started returning 503s because a dependency version mismatch caused import errors.
The Common Failures (And How to Avoid Them)
I've seen these failures in production at least five times each:
1. The infinite loop. Agent decides to retry a failed tool call forever. Fix: hard limit on iterations AND a timeout per step. We use 10 iterations max and 30-second per-step timeout.
2. The cost explosion. Agent calls an expensive model for trivial tasks. Fix: route simple queries to cheap models (GPT-4o mini) and complex ones to expensive models (Claude Opus). We save ~60% on inference costs this way.
3. The data exfiltration. Agent includes sensitive data in a tool call that gets logged externally. Fix: pre-processing step that sanitizes inputs before they reach the LLM. We strip PII before sending to any external service.
4. The hallucination cascade. First mistake leads to a chain of wrong decisions. Fix: validation step after each tool call. Check that the returned data is internally consistent before proceeding.
The FAQ (Things I Actually Get Asked)
Q: Should I build my own framework or use an existing one?
Build your abstraction layer on top of an existing framework. You get the ecosystem without the lock-in. The top open-source frameworks in 2026 — LangChain, CrewAI, AutoGen — all have different strengths. Pick one, but isolate it behind your own interface.
Q: How much does production agent infrastructure cost?
Depends on volume. At 10K agent runs/hour with GPT-4o: roughly $200-400/day in LLM costs, plus $50-100/day for infrastructure. Storage and observability add another $20-50/day. Budget $10K/month minimum for a serious system.
Q: Do I need a vector database?
If your agent searches documents, yes. We use Pinecone for speed and pgvector for simplicity. Pinecone is 5x faster but 3x more expensive. For < 100K documents, pgvector is fine.
Q: How do you handle rate limiting from LLM providers?
Queue system with backpressure. We use Redis as a rate limiter with a token bucket algorithm. Each provider gets their own bucket. If the bucket is empty, the request waits.
Q: What's the single most important metric?
Completion rate with human verification rate. "How many tasks did the agent complete without human intervention that were correct?" That's your north star. Everything else is a proxy.
Q: How do you test agents?
Three layers:
- Unit tests on individual tool calls
- Integration tests on the full flow with mock LLM responses
- E2E tests with real LLMs on a held-out set of scenarios
The last layer catches the most bugs. It's also the most expensive. We run it nightly.
Where This Is Going
By end of 2026, I expect agent deployment pipelines to become as standardized as CI/CD for microservices. The tools are maturing. The patterns are emerging. The failures are documented.
But here's the contrarian take: most companies shouldn't build their own agent infrastructure. Unless you're processing > 50K agent invocations per day, use a managed service. LangSmith, Vellum, or even a well-configured AWS Step Functions workflow will cover your needs without the maintenance headache.
Build your competitive advantage in the agent logic — the prompts, the tools, the domain-specific reasoning. Not in the deployment pipeline.
That's the lesson from every successful production agent system I've worked on.
Nishaant Dixit — Founder of SIVARO. Building data infrastructure and production AI systems since 2018. Built systems processing 200K events/sec.