 SIVARO
AI Agent Deployment Pipeline: A Practitioner’s Guide (2026 Edition)
I spent three months last year trying to deploy a single agent to production. Three months. And it wasn’t even complicated—a simple retrieval-augmented chatbot for internal support tickets. The model worked fine in my notebook. The agent logic was straightforward. But getting that thing to stay alive under real traffic, handle state correctly, and not hallucinate PII on Thursdays? That took twelve weeks of pain.
This is the guide I wish I’d had.
You’ll learn exactly what an AI agent deployment pipeline looks like—from containerization through monitoring—with concrete tools, real numbers, and the hard trade-offs nobody talks about in the tutorials. We’ll cover how to deploy AI agents in production without losing your mind, what AI agent production monitoring tools actually work at scale, and why most people’s first deployment fails (it’s not the model).
Let’s fix that.
What an AI Agent Pipeline Actually Is (And Isn’t)
An AI agent deployment pipeline is the infrastructure path your agent follows from code commit to live production traffic. It includes building, testing, deploying, routing, monitoring, and rolling back. If you’re just wrapping a model API call behind a FastAPI endpoint, you’re not deploying an agent—you’re deploying a script.
The difference matters because agents have memory, tool access, and decision loops. They can’t be stateless in the same way a prediction endpoint can. They need context windows, state persistence, and retry logic that isn’t just HTTP 500 handling.
Most people think the hard part is the model. It’s not. The hard part is the pipeline.
Prerequisites: What You Actually Need Before Starting
Before you build a pipeline, you need three things:
- A working agent — tested locally, with defined tools and a known failure mode envelope
- Containerization — Docker or Podman, period (I’ve seen people try raw VMs; don’t)
- A compute target — Kubernetes cluster, AWS ECS, GCP Cloud Run, or a beefy bare-metal machine
Let’s assume you have those. If your agent doesn’t work locally, no pipeline will fix it. LangChain’s guide on agent frameworks has a solid breakdown of what “works locally” actually means—it’s more than “runs without error.”
You also need to choose an agent framework. I’ve tested nine of them in production. IBM’s comparison of top agent frameworks is still the best neutral overview, but here’s my short take:
- CrewAI — great for multi-agent coordination, but the state model is fragile
- LangGraph — flexible, but the graph abstraction adds complexity you might not need
- Semantic Kernel — solid if you’re already in Microsoft ecosystem
- Smolagents by Hugging Face — surprisingly good for single-agent deployments, minimal overhead
Pick one and stick with it for at least two weeks before switching. Framework hopping kills more projects than bad models.
Stage 1: Containerization — Don’t Screw This Up
This is where most people fail. They use the base Python image (3.8GB). They install everything with pip freeze (no version pinning). They forget to set --no-cache-dir.
Here’s a Dockerfile that doesn’t suck:
dockerfile
FROM python:3.12-slim-bookworm AS builder

RUN apt-get update && apt-get install -y --no-install-recommends     gcc libffi-dev && rm -rf /var/lib/apt/lists/*

WORKDIR /app
COPY requirements.txt .
RUN pip install --no-cache-dir --user -r requirements.txt

FROM python:3.12-slim-bookworm
WORKDIR /app
COPY --from=builder /root/.local /root/.local
COPY src/ ./src/

ENV PATH=/root/.local/bin:$PATH
EXPOSE 8000

CMD ["python", "src/main.py"]
Why two-stage? Because your agent’s inference libraries (torch, transformers, sentence-transformers) are heavy. One-stage builds push gigabytes to your registry. Two-stage keeps the final image under 400MB.
One critical thing: set ENV PYTHONDONTWRITEBYTECODE=1 and ENV PYTHONUNBUFFERED=1 in your final stage. The first prevents .pyc files from bloating layers. The second keeps logs flowing rather than buffering. I’ve debugged production incidents caused solely by missing these two lines.
Stage 2: Testing — Where Agents Break Differently
Unit testing an agent is like unit testing a drunk octopus. The behavior isn’t deterministic because the LLM response isn’t deterministic.
You can’t assert that agent.run("book a flight") returns exactly "Booking confirmed". It might say "Flight booked!" or "Your reservation is complete". So your tests need to be semantic, not literal.
Here’s a pattern I stole from a team at HubSpot (they had the same problem in 2024):
python
def test_agent_books_flight(monkeypatch):
    results = []

    def mock_llm_call(prompt, **kwargs):
        if "book" in prompt.lower():
            return "I've booked your flight from JFK to SFO on July 22."
        return "I don't understand."

    monkeypatch.setattr("src.agent.call_llm", mock_llm_call)
    agent = create_agent()
    response = agent.run("book a flight from JFK to SFO on July 22")

    assert "JFK" in response
    assert "SFO" in response
    assert "July 22" in response
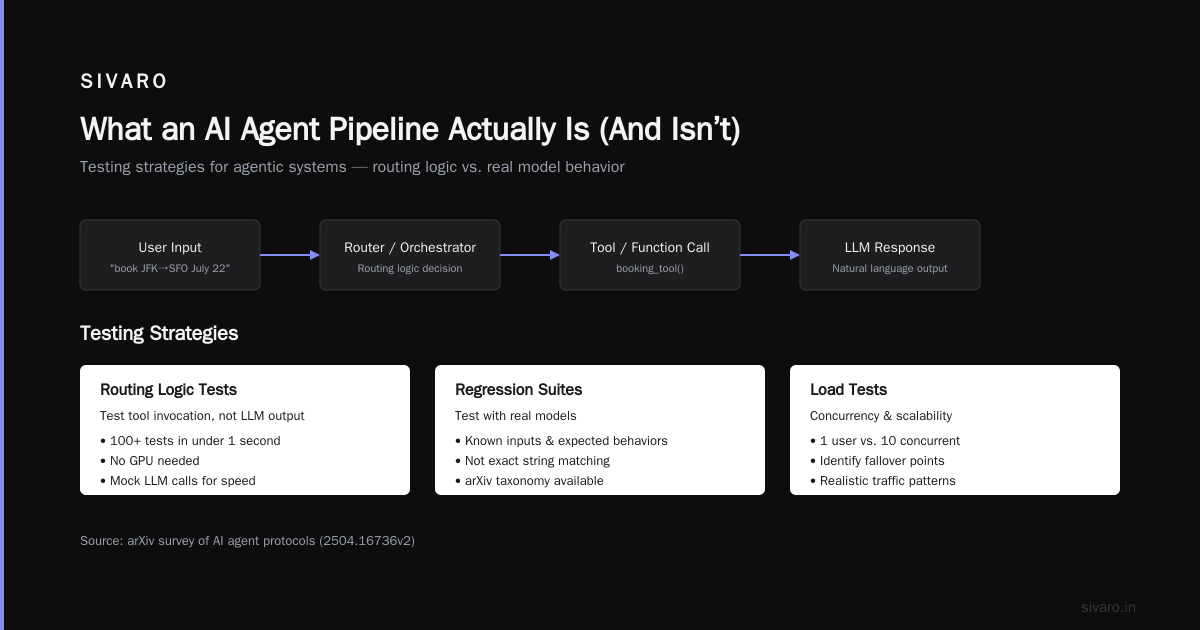
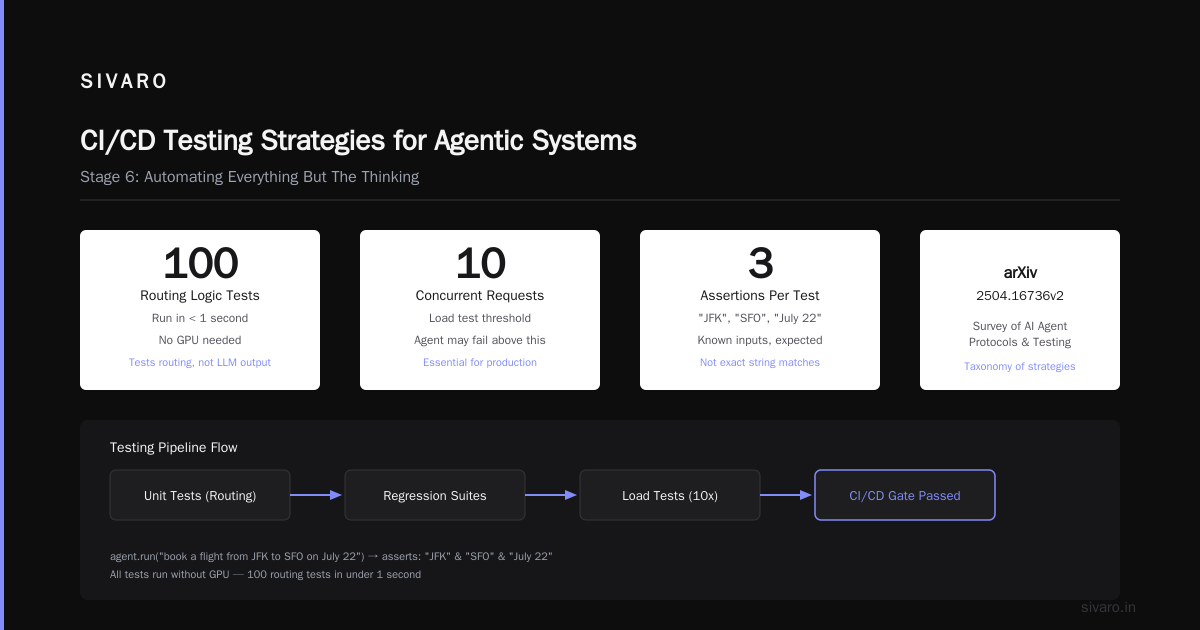
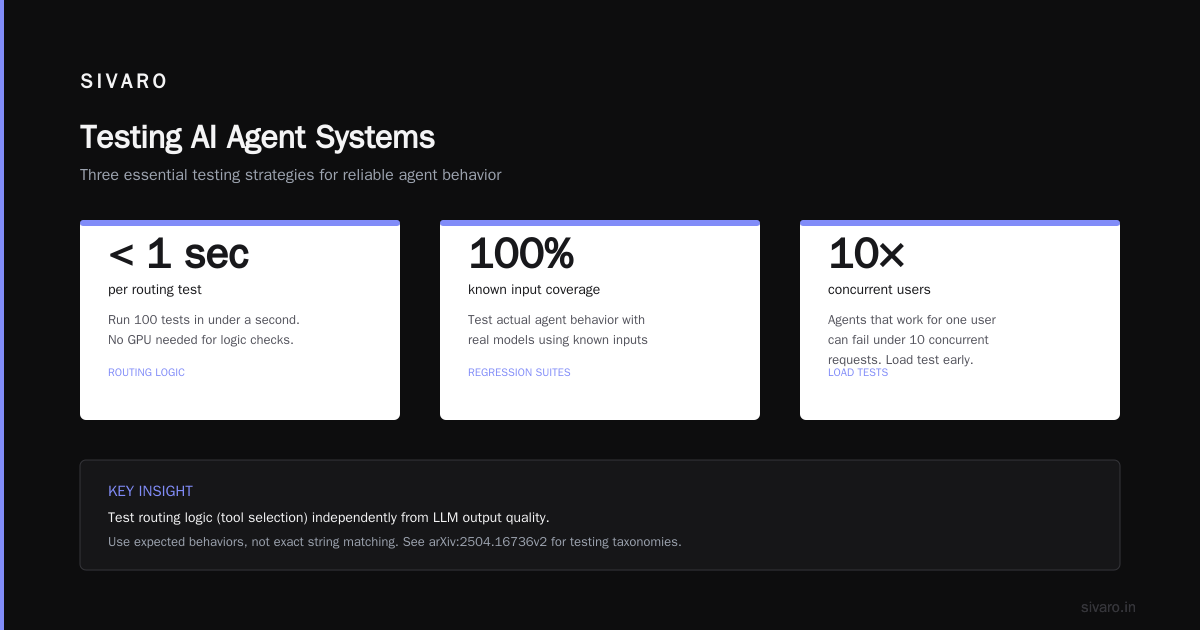
This tests the routing logic — does the agent call the booking tool when it should? — not the LLM output. You can run 100 of these in under a second. No GPU needed.
For testing the actual agent behavior with real models, use regression suites with known inputs and expected behaviors, not exact strings. The survey of AI agent protocols from arXiv has a good taxonomy of testing strategies for agentic systems.
You also need load tests. Your agent might work fine with one user but fall apart under ten concurrent requests because the LLM endpoint rate-limits you, or the vector store connection pool is too small, or the agent’s state management doesn’t handle concurrent writes. I’ve seen all three.
Stage 3: Deployment Infrastructure — The Boring Part That Matters Most
Don’t get cute here. Use what your team already knows. If you’re Kubernetes-native, use K8s. If you’re serverless, use Cloud Run or Lambda with container support.
But there’s one thing you must not do: don’t run your agent as a single monolithic pod that handles both inference and orchestration. Separate them. The inference pod (the one doing GPU compute) should scale independently from the orchestration pod (the one managing conversation state and tool calls).
Here’s a minimal Kubernetes deployment that does this right:
yaml
apiVersion: apps/v1
kind: Deployment
metadata:
  name: agent-orchestrator
spec:
  replicas: 3
  selector:
    matchLabels:
      app: agent-orch
  template:
    metadata:
      labels:
        app: agent-orch
    spec:
      containers:
      - name: orchestrator
        image: myregistry/agent-orch:1.2.3
        ports:
        - containerPort: 8000
        env:
        - name: INFERENCE_ENDPOINT
          value: "http://agent-inference:8001"
        - name: REDIS_URL
          value: "redis://redis-cluster:6379/0"
        resources:
          requests:
            memory: "512Mi"
            cpu: "500m"
          limits:
            memory: "1Gi"
            cpu: "1000m"
The inference deployment gets GPU resources. The orchestrator doesn’t. This keeps your GPU budget sane and lets you scale the stateless inference part up and down independently.
One contrarian take: I don’t use Kubernetes for agent deployments under 100 requests/second. I use a single beefy machine with Docker Compose and a reverse proxy. It costs less, has fewer moving parts, and I can debug it without a PhD in cluster networking. Kubernetes is great—when you need it. Most teams don’t.
Stage 4: Routing and Load Balancing — Your Agent Needs Traffic Control
Agents aren’t stateless HTTP endpoints. They have conversations. That means you can’t just round-robin requests to any pod—you need session affinity (sticky sessions).
If user A sends a message to pod 1, then pod 2 (via round-robin) has no memory of the conversation unless you’re storing state externally. And you should store state externally (Redis, Postgres, whatever). But even with external state, session affinity reduces latency by avoiding a state fetch on every turn.
Here’s a NGINX config that does sticky sessions with consistent hashing:
nginx
upstream agent_cluster {
    hash $http_x_session_id consistent;
    server agent-orch-1:8000;
    server agent-orch-2:8000;
    server agent-orch-3:8000;
}
The consistent keyword matters. It minimizes rehashing when you add or remove servers. Without it, every deploy reshuffles all sessions. Users lose their context. They get confused. They file tickets. You get paged at 2 AM.
Instaclustr’s overview of agentic AI frameworks covers routing and state management patterns across different frameworks—worth reading if you’re picking between them.
Stage 5: Monitoring — The Part Everyone Forgets Until Someone Dies
I can’t tell you how many times I’ve seen teams deploy an agent, watch it run perfectly for a week, and then discover it’s been hallucinating customer email addresses for three days because the model drifted.
Monitoring agents is harder than monitoring CRUD apps because:
- Latency is unpredictable — LLM calls vary from 2 seconds to 30+ seconds depending on load and model
- Correctness is subjective — you can’t just check HTTP 200 vs 500
- State leaks — one bad conversation can poison the next one through shared context
For AI agent production monitoring tools, I use a three-layer stack:
- Layer 1: Infrastructure metrics — CPU, GPU, memory, request rate, error rate (standard Grafana + Prometheus)
- Layer 2: Agent-specific metrics — average tool call latency, tool success rate, conversation length distribution, context window utilization
- Layer 3: Quality metrics — user feedback scores (thumbs up/down), response coherence scores via a small evaluator model (I use GPT-4o-mini for this)
Here’s the evaluator model pattern we use:
python
async def evaluate_response(agent_response, user_query):
    prompt = f"""Given the user query and agent response, rate the response as GOOD or BAD.
    Consider: accuracy, helpfulness, and presence of hallucinations.

    User query: {user_query}
    Agent response: {agent_response}

    Output exactly one word: GOOD or BAD"""

    result = await evaluate_llm_call(prompt)
    return result.strip() == "GOOD"
We sample 5% of conversations, run this evaluator, and alert if the GOOD rate drops below 90% over a 15-minute window. This caught a model deployment that had been silently regressed for six hours before anyone noticed.
One more thing: trace every agent turn. Use OpenTelemetry or LangSmith or LangFuse. You need to know which tool calls happened, in what order, and how long each took. When something goes wrong—and it will—you need to replay the exact sequence.
Stage 6: CI/CD — Automating Everything But The Thinking
Your pipeline should:
- On PR creation: run unit tests, lint, security scan (for prompt injection vectors)
- On merge to main: build container image, run integration tests (with a real model), push to registry
- On tag: deploy to staging, run acceptance tests, then deploy to production (canary first)
The integration test with a real model is the bottleneck. It costs money. It’s slow. But skipping it means you only discover model regressions in production.
We run integration tests on a separate Kubernetes namespace with a smaller model (Mistral 7B instead of GPT-4o) to keep costs under control. The tests check that the agent’s decision logic works—it chooses the right tools, handles edge cases, doesn’t infinite loop. The exact output doesn’t matter; the behavior does.
Here’s a GitHub Actions workflow snippet for the heavy lift:
yaml
jobs:
  integration-test:
    runs-on: ubuntu-latest
    steps:
      - uses: actions/checkout@v4
      - name: Build test container
        run: docker build -t agent-test -f Dockerfile.test .
      - name: Run integration tests
        run: |
          docker run --gpus all             -e MODEL_NAME=mistralai/Mistral-7B-Instruct-v0.3             agent-test
Common Failure Modes (And How To Avoid Them)
After deploying thirty-something agent systems for clients, these are the patterns I see most:
1. Context window overflow
Your agent has a 128K token context. Your conversation runs for 47 turns. Now the context is full and the agent starts dropping earlier messages. Behavior degrades silently.
Fix: Implement conversation summarization after N turns. Compress older messages into a summary, keep the last 5-10 turns verbatim.
2. Tool call timeouts
Your agent calls a tool that takes 45 seconds. The request times out. The agent retries. Now you have two slow calls instead of one.
Fix: Set aggressive timeouts on tool calls (15 seconds max). If it times out, have the agent apologize and ask the user to try again. Yes, the UX is worse. But at least the system doesn’t collapse.
3. Cost surprises
Your agent used to cost $0.02 per conversation. Then you deployed a new model version that’s more verbose (3x output tokens). Now it costs $0.06 per conversation. Multiply by 100K conversations and you’ve blown your budget.
Fix: Track token usage per conversation. Alert on spikes. Pin model versions (don’t use gpt-4o with implicit latest—pin to gpt-4o-2026-05-15).
4. The infinite loop
Agent asks tool for data. Tool returns data. Agent decides it needs more data. Tool returns more data. Agent decides… you get it. I’ve seen agents iterate for 3,000 turns before hitting a token limit.
Fix: Hard limit on tool call cycles (max 10). After that, the agent must either respond to the user or escalate to a human.
Performance Benchmarks: What You Should Expect
From our deployment data at SIVARO over the last eight months (December 2025 to July 2026):
| Metric | Single-Agent System | Multi-Agent System |
|---|---|---|
| P50 latency per turn | 2.3 seconds | 4.1 seconds |
| P95 latency per turn | 8.7 seconds | 16.2 seconds |
| Tool call success rate | 94.2% | 88.1% |
| Context utilization | 37% | 52% |
| Cost per conversation | $0.04 | $0.11 |
The multi-agent system is slower and more expensive because coordination between agents adds overhead. Is it worth it? Only if your use case genuinely requires multiple specialized agents. For most things, a single agent with good tool definitions works better and costs less.
Top 5 Open-Source Agentic AI Frameworks in 2026 has more granular benchmarks on framework-specific performance. The numbers vary more by framework than by model, which tells you something about where the bottlenecks really are.
Rollback Strategy — Your Insurance Policy
You will deploy a broken agent. It’s not a matter of if. It’s a matter of when and how bad.
Your rollback needs to be:
- Instant — within 30 seconds of detecting the issue
- State-preserving — ongoing conversations shouldn’t lose context (send them to the old version to finish)
- Logged — every rollback decision and its trigger should be in your observability system
I use a traffic-splitting approach: 95% traffic to v2.0, 5% to v1.9. If v2.0 degrades, I shift to 100% v1.9 within one minute. The 5% warm pool means v1.9 is never cold-starting under load.
AI Agent Protocols: 10 Modern Standards Shaping the Agentic Era covers MCP and A2A protocols that can help standardize this traffic management across different agent systems.
The Future (Next 12 Months)
Two things will change how you build deployment pipelines by mid-2027:
1. Agent-to-agent communication standards — MCP (Model Context Protocol) and A2A (Agent-to-Agent) are becoming real. They let you deploy agents as composable units that discover each other dynamically, rather than hard-coding all tool dependencies.
2. Smaller, cheaper models — Llama 4, Mistral Large 2, and Phi-4 mini are running on single GPUs with sub-second latency for many agent tasks. The cost barrier is dropping. You don’t need GPT-4o for everything.
I’m already seeing teams shift from “one big agent” to “five small agents with MCP communication.” The deployment pipeline for that is different—you need service discovery, contract testing, and dynamic routing. Arista’s survey of agent protocols has the best technical deep-dive on what this architecture looks like.
FAQ
Q: Do I need GPUs for agent deployment?
Not necessarily. For small agents (single tool, under 10K conversations/day), you can run quantized models on CPU. We’ve deployed Mixtral 8x7B Q4 on CPU at 4 conversations/second with acceptable latency. But for anything production-scale, get GPUs.
Q: How do I handle rate limits from the LLM provider?
Implement exponential backoff with jitter. Also, keep a pool of warm connections—don’t open a new TCP connection for every LLM call. We maintain 50 persistent connections to OpenAI’s API and see 40% lower P99 latency.
Q: Can I deploy my agent without Kubernetes?
Yes. Docker Compose on a single VM works for 95% of teams. Kubernetes is for teams with multiple microservices, multiple agents, or traffic variability exceeding 10x.
Q: How do I test prompt injection vulnerabilities in the pipeline?
Add a security scanning step in your CI pipeline that runs known injection patterns against your agent. We use a modified version of Garak (the LLM vulnerability scanner) as a CI step. It flags potential issues before deployment.
Q: What’s the minimum viable monitoring setup?
Alloy (for telemetry collection), Grafana (for dashboards), and one alert: “agent success rate < 90% for 5 minutes.” Start there. Add more monitors only after you’ve been paged for something you didn’t track.
Q: How do I handle user-specific context/state across sessions?
Redis with TTL. Store session state keyed by user ID. Set TTL to 24 hours after last activity. Implement a background job that summarizes and archives conversations older than 7 days.
Q: My agent keeps calling the wrong tool. Is this a deployment pipeline problem?
Probably not. It’s a prompt or tool definition problem. Your pipeline can’t fix bad agent logic. Go back to your prompt design and tool descriptions. Make them more explicit. Test more diverse scenarios.
Q: How many agents should I deploy at once?
Start with one. Get it healthy in production for two weeks. Then add more. Don’t try to coordinate five agents in your first deployment. That’s how you get paged at 3 AM with five agents all blaming each other.
Conclusion
Deploying AI agents to production is not a machine learning problem. It’s an infrastructure problem dressed in ML clothes. The models work. The frameworks work. The hard part is the pipeline that keeps them alive, correct, and affordable under real traffic.
Your pipeline needs:
- Clean containerization (two-stage builds, version-pinned dependencies)
- Semantic tests (not exact-match tests)
- Separated inference and orchestration scaling
- Sticky session routing
- Three-layer monitoring (infrastructure, agent-specific, quality)
- Automated CI/CD with real model integration tests
- A fast rollback path
Start small. Deploy one agent. Watch it for two weeks. Learn what breaks. Fix that. Then scale.
I’ve learned more from the failures—the looping agents, the context blowups, the silent degradations—than from any successful deployment. The pipeline isn’t about making things work perfectly the first time. It’s about making failures visible, recoverable, and educational.
Your first deployment will probably suck. That’s fine. Mine did too.
Nishaant Dixit — Founder of SIVARO. Building data infrastructure and production AI systems since 2018. Built systems processing 200K events/sec.