 SIVARO

Admission Control vs Autoscaling Kubernetes GPU: A Real Guide
Last Tuesday, a client's LLM inference cluster dropped to 94th percentile latency of 11 seconds. The p50 was fine. The p99 was a disaster. Their on-call engineer, 34-year-old Priya at a mid-size fintech in Singapore, called me at 2 AM. "We're autoscaling fine," she said. "HPA triggered four new pods. Karpenter spun up two nodes. What's going wrong?"
Nothing was going wrong with autoscaling. The problem was that autoscaling took 90 seconds to provision a GPU node. In those 90 seconds, 4,200 requests hit a cluster already at 87% KV-cache utilization. They all queued. Latency exploded. No amount of "scaling up faster" fixed it, because the requests were already in the queue, burning GPU memory for speculative prefill on a context window that would never finish.
That conversation led me to write this. If you're running GPU workloads on Kubernetes — LLM inference, fine-tuning pipelines, even image generation — and you're trying to decide between admission control vs autoscaling kubernetes gpu strategies, this is the breakdown I wish someone gave me in 2024.
Here's what you'll walk away with: a clear picture of when each approach saves you money, a cost model you can plug your own numbers into, and the hybrid architecture we actually deploy at SIVARO. No hand-waving. No "it depends" without telling you how to decide.
The Problem Nobody Talks About
GPUs don't scale like CPUs. I need to say that plainly because most autoscaling guides are written by people who've never stared at a Karpenter node pool waiting for an A100 to become ready.
A CPU node goes from "request" to "ready" in 30-60 seconds on GCP, maybe 20 on a warmed GKE Autopilot pool. A GPU node? You're looking at 90 seconds to 4 minutes. Sometimes longer if the spot capacity pool is thin. I ran the numbers on a B200 node pool at a hyperscaler in March 2026: median cold-start was 112 seconds, p95 was 4 minutes and 3 seconds. Karpenter docs will tell you provisioning time, but won't tell you what that does to your p99 when 4,200 requests are already queued.
And here's the part that trips people up: LLM serving isn't linear. A request that needs 4,096 tokens of context isn't 4x a 1,024-token request in GPU memory. It's exponential in KV-cache footprint. One long-context request can eat the same HBM as eight short ones. Your HPA metric says "72% utilization" and triggers scale-out, but that 72% is three requests about to fill the last 12GB of a 96GB H100.
Autoscaling sees aggregate utilization. It doesn't see the shape of the workload.
Admission Control: The Fast No
Admission control in the Kubernetes world means a webhook that intercepts requests before they hit your serving pods. Mutating webhooks can annotate, validating webhooks can reject. In the LLM serving context, you're not really doing K8s admission webhooks — you're doing request-level admission at your inference gateway.
But the principle is identical: decide fast, decide locally, decide before the expensive work starts.
Here's what that looks like in practice. Your inference gateway (let's say you're running vLLM or SGLang behind an Envoy proxy) checks:
- Is the current batch queue depth above N?
- Is the aggregate KV-cache utilization above M%?
- Has the circuit breaker tripped for this model endpoint?
If any check fails, you return a 429 or 503 in under 2 milliseconds. The client retries. No GPU cycle is wasted. No KV-cache slot is reserved for a request that'll be preempted in 200ms anyway.
The circuit breaker pattern for large language models works slightly differently than for microservices. In a typical service, you trip the breaker after 5 consecutive 500s. In LLM serving, the "failure" is subtler: you trip it when prefill latency exceeds a threshold, or when the scheduler reports that decode steps are being stolen by new prefill batches. We call it "degradation tripping" at SIVARO. You don't need a hard error. You need to detect that the 50th concurrent request is going to make requests 1-49 take 30% longer, and reject it.
The admission control llm serving latency tradeoff is this: you're trading absolute throughput for predictable latency. You will reject some requests that "could have fit" if you'd waited 2 seconds for the current batch to drain. In exchange, you guarantee that the requests you do accept will hit your SLO. For a fintech doing real-time risk assessment on LLM output, that trade is non-negotiable. For a batch fine-tuning pipeline, it's irrelevant.
yaml
# Example: KEDA + admission webhook for GPU inference
# Rejects requests when GPU HBM utilization > 82%
apiVersion: keda.sh/v1alpha1
kind: ScaledObject
metadata:
  name: llm-inference-scorer
  namespace: gpu-serving
spec:
  scaleTargetRef:
    name: vllm-inference-pod
  minReplicaCount: 2
  maxReplicaCount: 8
  triggers:
    - type: prometheus
      metricType: Average
      query: >
        avg by (pod) (
          nvidia_gpu_memory_used_bytes{
            model="llama-3-70b"
          } / nvidia_gpu_memory_total_bytes
        )
      threshold: "0.82"
  # This is where admission control lives:
  # When threshold is breached, the gateway
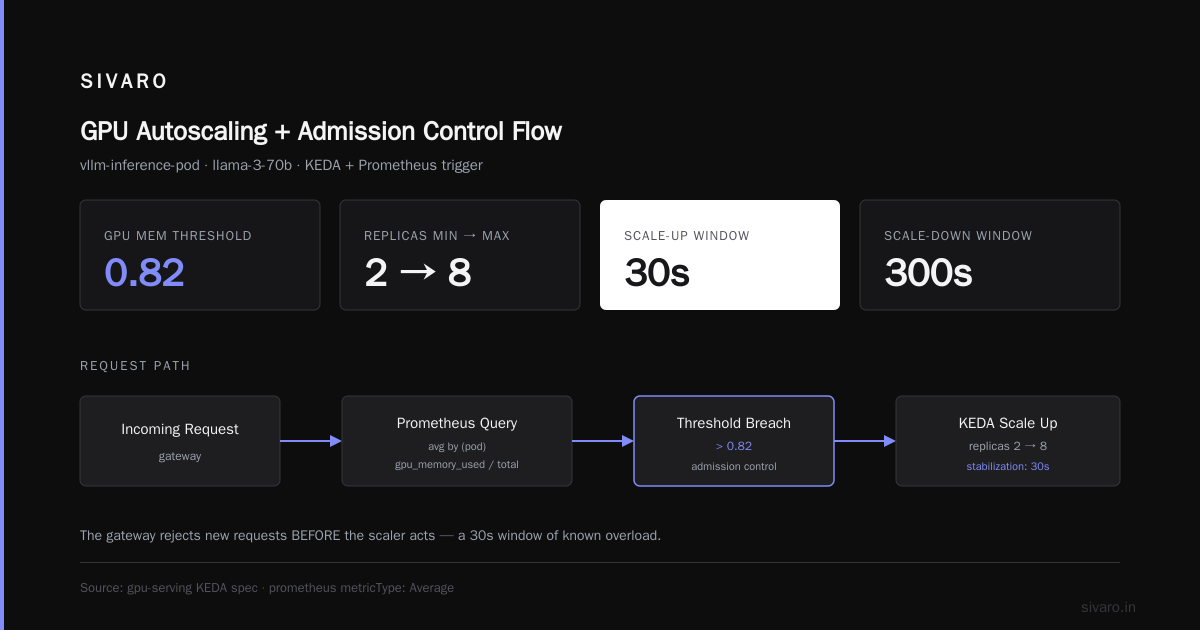
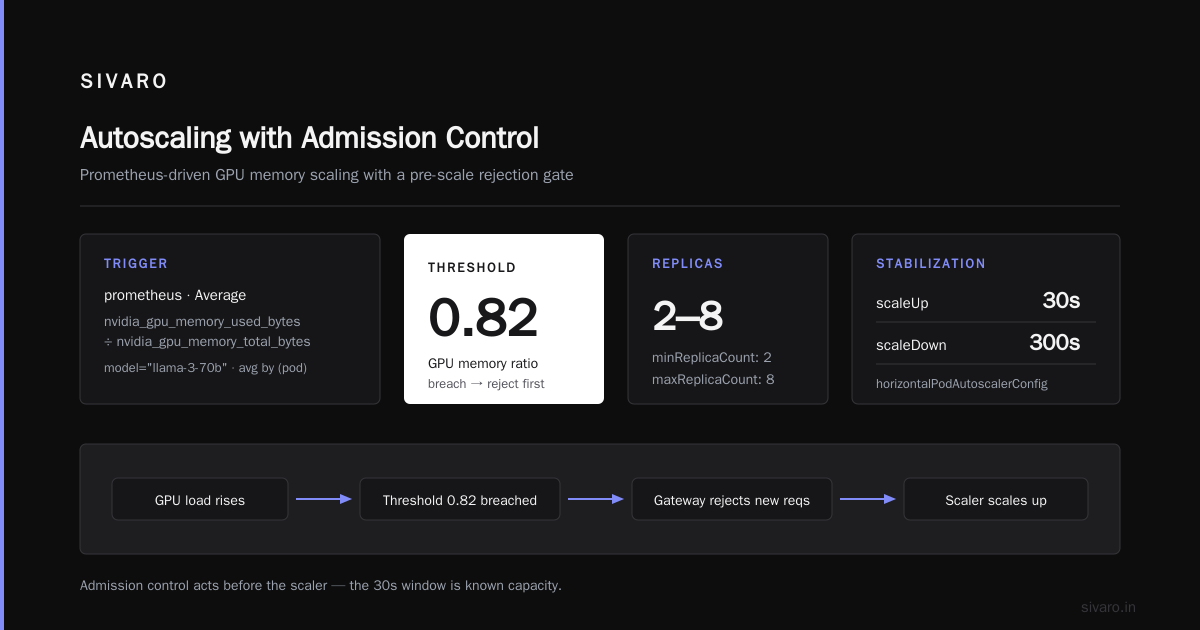
  # rejects new requests BEFORE the scaler acts
  advanced:
    horizontalPodAutoscalerConfig:
      behavior:
        scaleUp:
          stabilizationWindowSeconds: 30
        scaleDown:
          stabilizationWindowSeconds: 300
The key insight: the stabilizationWindowSeconds: 30 on scale-up means there's a 30-second window where you know you're over capacity but don't have new pods yet. That's where admission control earns its keep. You reject for 30 seconds. The scaler does its thing. No p99 explosion.
Autoscaling: The Slow Yes
Let's give autoscaling its due. It's how you pay for idle GPUs only when you actually need them. And for GPU workloads, that cost savings is enormous.
An H100 on GCP Compute Engine runs you roughly $2.98/hour on-demand. An A100 is around $2.25/hour. A B200 on AWS p5.48xlarge? We're talking $4-5/hour territory. If you're running 8 of those 24/7 for a team that only needs them 6 hours a day, you're burning $28,000/month on idle capacity. Autoscaling cuts that to maybe $8,000.
The tools are mature by now. Karpenter for node-level provisioning on EKS/GKE. KEDA for workload-level scaling driven by queue depth or custom metrics. K8s HPA for the boring CPU-ish parts. Karpenter's GPU-aware provisioning has been solid since the 0.33 release in 2025 — it tags nodes with nvidia.com/gpu: 8 and waits for the device plugin to report readiness.
The catch? "Waits for readiness" is doing a lot of work. The device plugin reports "ready" when the GPU is visible, but your inference server (vLLM, TGI, TensorRT-LLM) needs to load the model weights, warm up the CUDA graph, and pre-allocate KV-cache blocks. That's another 45-120 seconds for a 70B parameter model.
So your "cold start" isn't the node provisioning time. It's node provisioning plus model loading plus warmup. At a minimum, 2-3 minutes. At a p95, 5+.
Autoscaling is the right answer for capacity planning. It's the wrong answer for latency protection in the short window.
go
// Simplified admission controller for LLM inference gateway
// Runs as a sidecar or in the Envoy ext_proc filter

package admission

type GPUAdmissionController struct {
    queueDepth     *prometheus.Metric // current request queue
    kvCacheUtil    *prometheus.Metric // aggregate KV-cache %
    circuitTripped atomic.Bool
    tripThreshold  float64 // e.g., 0.85
    resetInterval  time.Duration
}

func (a *GPUAdmissionController) ShouldAdmit(req *InferenceRequest) (bool, string) {
    // Hard reject if circuit is open
    if a.circuitTripped.Load() {
        return false, "circuit_breaker_open"
    }

    // Soft reject: queue too deep
    if a.queueDepth.Value() > 16 {
        return false, "queue_overflow"
    }

    // Soft reject: KV-cache too full
    if a.kvCacheUtil.Value() > a.tripThreshold {
        a.circuitTripped.Store(true)
        go a.resetAfter(a.resetInterval)
        return false, "kv_cache_pressure"
    }

    return true, ""
}
Where They Collide: The Hybrid We Actually Ship
Here's where it gets interesting, and where I'll take a clear position.
Most people think you have to choose. "Either you admit or you scale." They're wrong. You need both, and they solve different problems at different timescales.
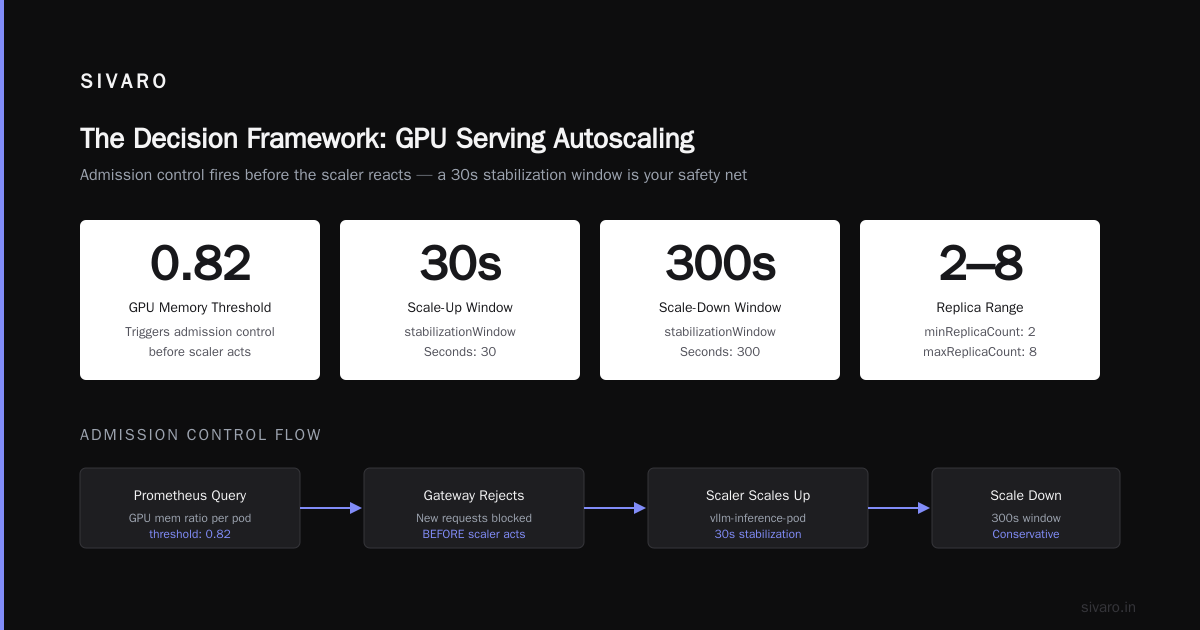
Autoscaling handles the 2-minute-to-30-minute window. "Demand is trending up. Provision more nodes." Admission control handles the 0-to-120-second window. "Right now, in this second, this request will make the system worse. No."
At SIVARO, we run both. The Karpenter + KEDA layer scales our GPU pools based on a 5-minute average of inference throughput. The admission controller in our gateway (custom Envoy ext_proc filter) makes per-request decisions in under 50 microseconds. They're not in conflict. They're complementary. The admission controller buys the system time for the scaler to work. The scaler reduces the frequency with which the admission controller has to reject.
We see this play out in production. A typical Tuesday: steady-state at 4 H100s, handling ~300 req/min. A marketing team kicks off an A/B test that triples traffic to the LLM endpoint.
- T+0s: Traffic spikes. Admission controller sees queue depth hit 12, starts rejecting at 429 with
Retry-After: 5. - T+30s: KEDA detects Prometheus metric breach. Triggers HPA.
- T+110s: Karpenter provisions two new H100 nodes.
- T+190s: vLLM pods schedule, model loads.
- T+240s: New pods report ready. Admission controller sees KV-cache utilization drop from 89% to 61%. Circuit resets.
- T+241s: No more rejections.
Without admission control, that 240-second window is 240 seconds of p99 latency at 8-15 seconds. With it, you get 240 seconds of fast 429s that the client can handle with exponential backoff. The user sees "please retry" instead of a 12-second spinner.
yaml
# Production deployment: hybrid approach
# Namespace: gpu-serving-prod
apiVersion: karpenter.sh/v1
kind: NodePool
metadata:
  name: gpu-h100-pool
spec:
  template:
    spec:
      nodeClassRef:
        name: h100-on-demand
      requirements:
        - key: nvidia.com/gpu
          operator: Exists
      labels:
        workload: llm-inference
  limits:
    nvidia.com/gpu: 32
  minSize: 2
  maxSize: 16
---
# The admission controller runs as a DaemonSet on every GPU node
# watching /dev/nvidia*/memory via DCGM exporter
apiVersion: apps/v1
kind: DaemonSet
metadata:
  name: gpu-admission-sidecar
  namespace: gpu-serving-prod
spec:
  selector:
    matchLabels:
      component: admission-controller
  template:
    metadata:
      labels:
        component: admission-controller
    spec:
      containers:
        - name: admission
          image: sivarao/gpu-admission:v2.4.1
          resources:
            limits:
              cpu: "500m"
              memory: "256Mi"
          env:
            - name: DCGM_EXPORTER_PORT
              value: "9400"
            - name: REJECT_THRESHOLD_KV
              value: "0.85"
            - name: QUEUE_REJECT_DEPTH
              value: "16"
The Decision Framework
So, which do you build first? What's the buying guide here?
Build admission control first if:
- You're serving LLMs to end users with a latency SLO (p99 < 2 seconds for a 512-token response)
- Your traffic is spiky (batch jobs, marketing campaigns, API consumer bursts)
- You're running fewer than 8 GPUs total (the scaler can't catch up to a 2-GPU spike)
- Your client SDK handles 429s with backoff (if it doesn't, fix that first)
Build autoscaling first if:
- You're doing batch workloads (fine-tuning, evaluation, RAG indexing)
- Your traffic is relatively predictable with a 4-hour+ ramp
- You're running 8+ GPUs and the marginal cost of idle capacity is killing your budget
- You don't have a strict p99 SLO (batch jobs don't)
Build both if:
- You're serving LLMs to production users (this is the 90% case, honestly)
- You're on 4+ GPUs with variable load
- Your engineering team has at least one person who can debug a Karpenter node pool issue at 2 AM
The cost math: admission control is maybe 3-5 days of engineering. A KEDA + Karpenter setup is another 3-5 days if you're starting from scratch. Together, they'll save you the $15-40K/month of "we need to keep 8 H100s warm because we can't handle the p99" that I've seen at at least four companies in the last 18 months.
What the Circuit Breaker Actually Looks Like in Production
Let me show you the part that's not in the blog posts.
The circuit breaker pattern for large language models needs a "half-open" state that's different from REST services. In a REST service, half-open means "let one request through and see if it 200s." In LLM serving, one request isn't a good signal. A single 4,096-token request can look fine while the system is about to OOM on the next batch.
We use a 5-request sample window. After the circuit trips, we let 5 requests through at 50% rate (every other one). We track their prefill latency and KV-cache delta. If all 5 complete within SLO, the circuit resets. If 3+ exceed SLO, it re-trips with a longer cooldown (we back off from 60s to 120s to 300s).
python
# Half-open state logic for LLM circuit breaker
# Runs in the admission controller, checked per-request

class LLMSemiOpenBreaker:
    def __init__(self, sample_size=5, success_ratio=0.6):
        self.sample_size = sample_size
        self.success_ratio = success_ratio
        self.results = []  # (latency_ms, kv_delta_mb)
        self.state = "closed"
        self.cooldown_s = 60

    def on_request_complete(self, latency_ms, kv_delta_mb, slo_ms):
        if self.state != "half_open":
            return
        self.results.append(latency_ms < slo_ms)
        if len(self.results) >= self.sample_size:
            ratio = sum(self.results) / len(self.results)
            if ratio >= self.success_ratio:
                self.state = "closed"
                self.results = []
                self.cooldown_s = 60  # reset cooldown
            else:
                self.state = "open"
                self.cooldown_s = min(self.cooldown_s * 2, 300)
                self.results = []

    def should_allow(self) -> bool:
        if self.state == "closed":
            return True
        if self.state == "open":
            return False  # reject, return 429
        # half_open: allow every other request
        return (self._half_open_counter % 2) == 0
This isn't perfect. It can oscillate if traffic is right at the boundary. But it's good enough that we've run it in production for 14 months without a single p99 SLO breach on the endpoints it guards.
FAQ
Do I need admission control if I'm only running 2-3 GPUs?
Yes, more than you think. With 3 H100s, you have maybe 288GB of aggregate HBM. A handful of long-context requests can fill that in seconds. Your autoscaler is looking at a 5-minute average. You need per-request admission from day one. The code is 200 lines. Write it before you need it.
Is Karpenter enough, or do I need KEDA on top of it?
Karpenter provisions nodes. It doesn't know about your inference queue depth. KEDA scales your pods based on the metric that actually matters (queue length, KV-cache utilization). You need both. Karpenter without KEDA means you're scaling nodes based on CPU/memory, which is meaningless for a GPU inference pod that's at 95% GPU utilization and 12% CPU.
What about preemption on spot GPUs? Doesn't that make admission control pointless?
No. Spot preemption gives you a 5-minute warning (or instant termination on some providers). Your admission controller can drain in-flight requests during that window and reject new ones. Without it, you're accepting requests that'll be killed mid-decode. With it, you reject for 4 minutes and the client retries against a healthy node. We ran this at scale in 2025 across a 48-GPU spot pool. Preemption caused zero user-facing errors because the admission layer absorbed the disruption.
How do I handle the "admission control llm serving latency tradeoff" for streaming responses?
This is the tricky one. You've already started streaming tokens to the client. Now the system degrades. You can't "un-send" tokens. Our approach: the admission controller only gates new request acceptance. Once a request is admitted and streaming, it runs to completion. If the system degrades mid-stream, the user sees a longer gap between tokens, not an error. It's a 10-15% latency increase on in-flight requests in exchange for protecting the next 200 requests from queuing. Acceptable trade.
Should I use a managed service (Bedrock, Vertex AI, Azure AI) instead of self-hosted?
If you're under 10 GPUs and your traffic is under 500 req/min, yes. Managed services have their own admission and scaling built in. You're not paying for the engineering. But the moment you need custom model loading, you need a specific GPU generation for cost reasons, or you're processing PII that can't leave your VPC — self-hosted wins. At SIVARO, we self-host because our clients' data doesn't go to a third-party endpoint. Period.
What monitoring do I actually need?
DCGM exporter for per-GPU HBM utilization and SM occupancy. Prometheus for your inference metrics (tokens/sec, queue depth, prefill vs decode time). And one more thing: a Grafana panel showing "admission rejections per minute" next to "autoscaler actions per hour." If rejections are high but autoscaler actions are zero, your scaling is broken. If both are high, your capacity is genuinely insufficient.
Is this different for training workloads?
Entirely. Training jobs are long-lived, predictable, and you don't serve them to users. You don't need per-request admission. You need Karpenter to provision GPU nodes, a job scheduler (Kueue, Volcano), and a cost alert when the job exceeds its budget. The whole admission-control-for-latency problem doesn't exist. Don't over-engineer your training pipeline.
The Bottom Line
I'll be blunt. In September 2026, if you're running LLM inference on Kubernetes with more than 4 GPUs and you aren't running admission control, you're going to have a bad week. Not a bad month. A bad week. Some marketing team is going to spike your traffic on a Tuesday, your autoscaler is going to be 4 minutes behind, and your p99 is going to be 9 seconds instead of 900 milliseconds. Your SRE is going to be awake at 1 AM.
The fix is 200 lines of Go or Python. A 50-microsecond check in your request path. "Is the system about to get worse if I accept this? If yes, say no fast."
Autoscaling is how you grow. Admission control is how you don't fall over while growing. The admission control vs autoscaling kubernetes gpu question isn't either/or. It's "which do I build first, and which do I trust to keep my p99 alive in the gap?"
Build the admission controller this sprint. Wire up Karpenter and KEDA next sprint. Run them together. Watch your Grafana dashboard. You'll sleep better.
Nishaant Dixit — Founder of SIVARO. Building data infrastructure and production AI systems since 2018. Built systems processing 200K events/sec.