 SIVARO

Admission Control LLM Serving Latency Tradeoff
Most teams I talk to think their LLM latency problems are a capacity problem. They're wrong. Nine times out of ten, it's an admission control problem wearing a capacity problem's clothes.
Last month I watched a Series B company burn $40K in a weekend on H100s because their p99 latency spiked whenever traffic spiked. They threw more GPUs at it. Latency got worse. Here's why: when a vLLM server saturates, every extra request queues behind the others, and every request gets slower. More capacity didn't help — the problem was that they were letting every request in the door.
The admission control LLM serving latency tradeoff is the tension between accepting work and protecting the latency of work already in flight. Admit too much and you get queue collapse. Admit too little and you leave GPU cycles idle. The whole game is finding that line, and then moving it as traffic shifts.
This piece covers what admission control actually is in an LLM serving context, why it's different from classic web serving, and how to build it. I'll show real code, real numbers, and the mistakes I've personally made deploying this at SIVARO.
Why LLM Serving Breaks Normal Admission Control Instincts
Classic web admission control assumes requests are cheap and independent. An nginx worker handling a static asset takes microseconds. Reject the request and the client just retries somewhere else. The math is linear: more requests, more CPU, predictably more throughput.
LLM inference violates all of that.
A single 70B parameter request on an H100 with vLLM might take 800ms if it's alone. Add ten concurrent requests and each one takes 3 seconds. Add fifty and you're at 15 seconds and your KV cache is thrashing. The relationship between concurrency and per-request latency is not linear — it's quadratic past the knee of the curve, then it falls off a cliff entirely when you hit KV cache pressure and start swapping.
I call this the hockey stick from hell. And it's why naive autoscaling on GPU utilization is a disaster. By the time utilization hits 95%, you're already deep in the bad zone. More replicas take 90 seconds to spin up. Your users have already given up.
There's also the prefill/decode split that makes everything harder. Prefill (processing the input prompt) is compute-bound and short. Decode (generating tokens) is memory-bandwidth-bound and long. A request with a 32K token prompt can hog the GPU's compute for seconds while a chat request with 200 tokens waits in line. Mixed workloads make predictable admission control genuinely hard.
What Admission Control Actually Is (In This Context)
Admission control is the policy layer that decides, at the moment a request arrives, whether to accept it, queue it, reject it, or degrade it. That's it. Four verbs. The complexity is in the policy.
In LLM serving you have roughly five knobs:
Accept — push the request into the running batch. Normally this is what you want.
Queue — hold the request with a deadline. Works if you have a real SLO and the queue is short. Terrible if you don't cap queue depth, because a deep queue just adds latency without adding throughput.
Reject — return 429 or 503 immediately. Honest. Users can retry or hit a fallback. Almost always better than queueing into the abyss.
Degrade — route to a smaller model, lower max_tokens, or disable streaming. Users notice quality difference but stay online.
Shed — drop low-priority requests under load. Only works if you can classify priority, which most teams can't do well.
The interesting part is that accept/queue/reject decisions have to be made in under a millisecond, because you're paying for GPU time either way. Every microsecond of admission logic eats into your throughput.
The Latency Tradeoff, Stated Honestly
Here's the tradeoff in one sentence: every request you admit adds a small latency penalty to every request already running, and that penalty compounds.
On an H100 running Llama 3.1 70B with vLLM, going from batch size 8 to batch size 32 roughly triples p50 latency per request while only doubling aggregate tokens/sec. That's the tradeoff curve. You get more throughput per GPU at higher batch sizes, but each user waits longer.
Most teams optimize the wrong side of this curve. They maximize throughput per GPU, then wonder why their chatbot feels sluggish. The right answer depends on what you're building:
- Interactive chat: cap batch size low, accept idle GPU, keep p99 under 2s
- Batch summarization: crank batch size, let p50 be 30s, nobody cares
- Agent loops making tool calls: medium batch, strict timeout, fall back hard
At SIVARO we run a tiering system where every request carries a class: interactive, batch, internal. The admission controller uses different concurrency caps per class. An interactive request that arrives when interactive slots are full gets rejected fast rather than queued behind a batch job. This alone cut p99 for one client from 11s to 1.8s without adding a single GPU.
Where the Circuit Breaker Pattern Fits
The circuit breaker pattern for large language models is the escape hatch when admission control alone isn't enough. Fowler's original pattern is about failing fast when a downstream dependency is broken. In LLM serving, "broken" means saturated, not dead.
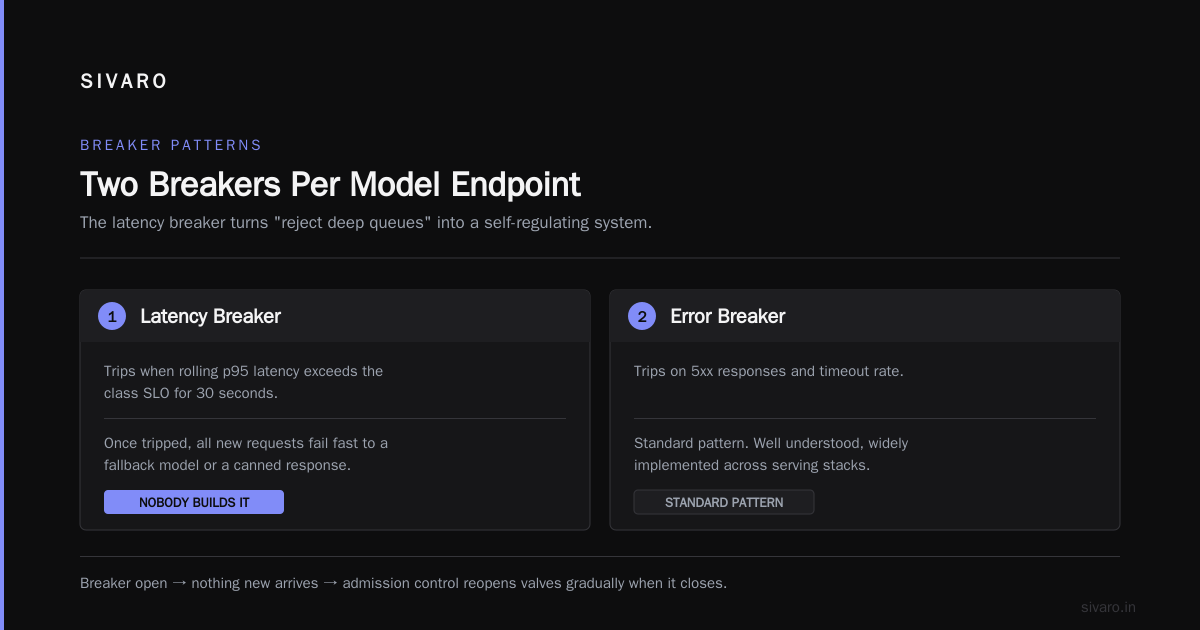
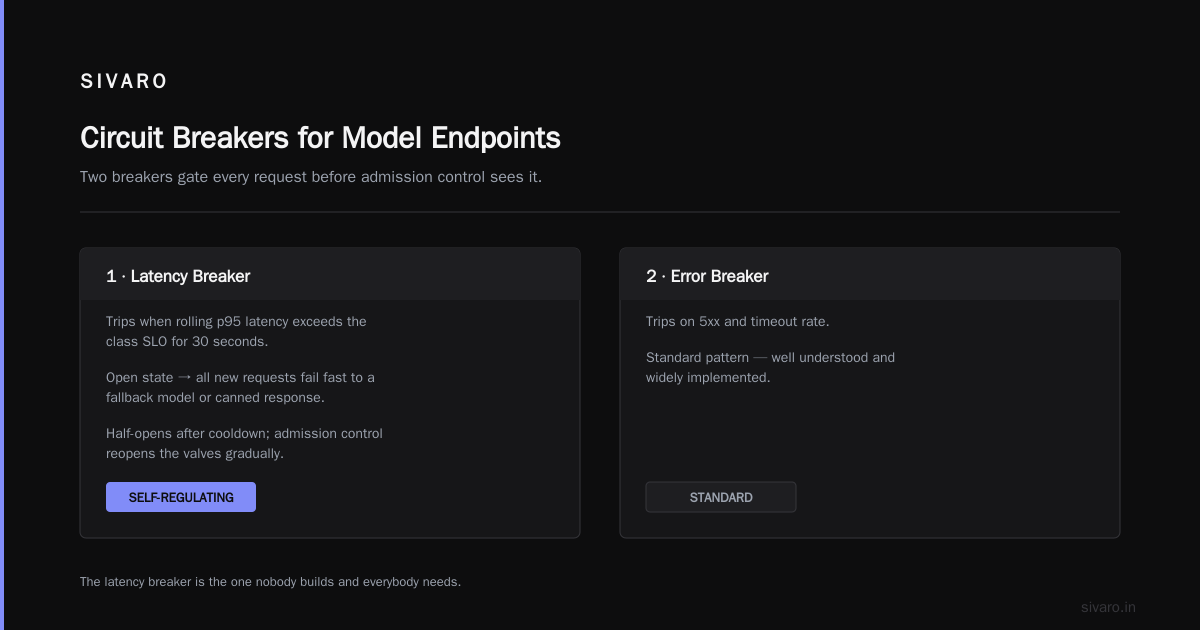
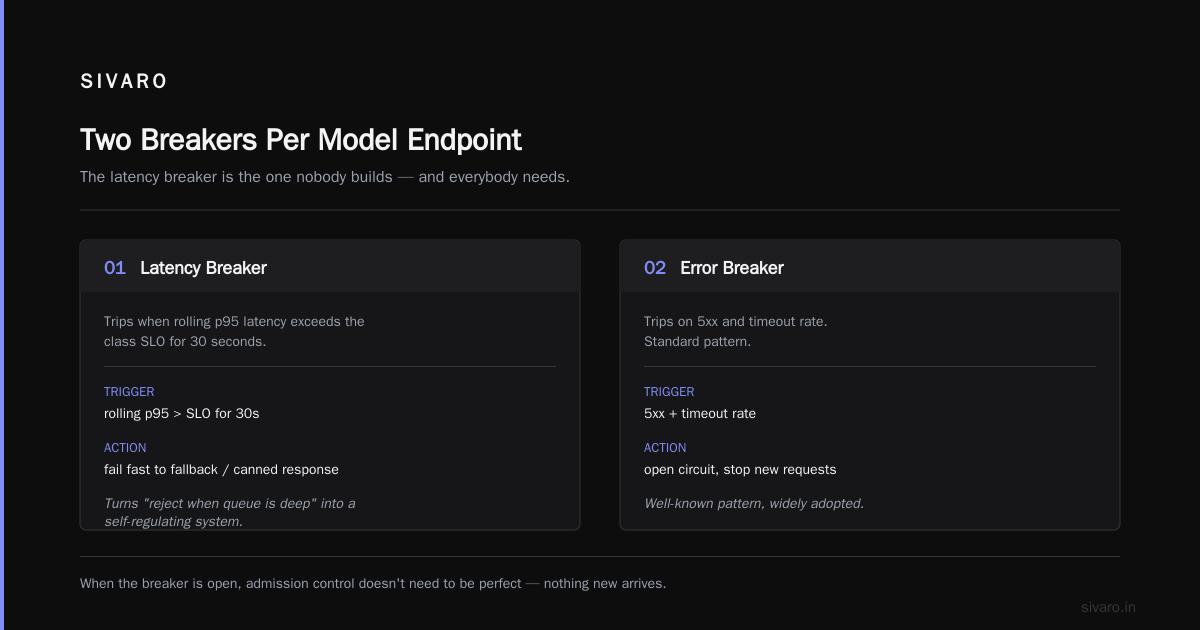
I wire two breakers per model endpoint:
- Latency breaker — trips when rolling p95 latency exceeds the class's SLO for 30 seconds. Once tripped, all new requests fail fast to a fallback model or a canned response.
- Error breaker — trips on 5xx and timeout rate. Standard pattern.
The latency breaker is the one nobody builds and everybody needs. It turns "reject requests when the queue is deep" into a self-regulating system. When the breaker is open, you don't need admission control to be perfect — nothing new arrives. When it closes, admission control reopens the valves gradually.
Here's the pattern in Python. Uses a rolling window, trips on p95 breach, half-opens after cooldown:
python
import time
from collections import deque
from dataclasses import dataclass, field
from enum import Enum

class BreakerState(Enum):
    CLOSED = "closed"
    OPEN = "open"
    HALF_OPEN = "half_open"

@dataclass
class LatencyBreaker:
    slo_p95_ms: float
    window_seconds: float = 30.0
    cooldown_seconds: float = 10.0
    min_samples: int = 50
    samples: deque = field(default_factory=deque)
    state: BreakerState = BreakerState.CLOSED
    opened_at: float = 0.0

    def _prune(self, now: float) -> None:
        cutoff = now - self.window_seconds
        while self.samples and self.samples[0][0] < cutoff:
            self.samples.popleft()

    def record(self, latency_ms: float) -> None:
        now = time.monotonic()
        self.samples.append((now, latency_ms))
        self._prune(now)
        if self.state is BreakerState.HALF_OPEN:
            if latency_ms <= self.slo_p95_ms:
                self.state = BreakerState.CLOSED
            else:
                self._open(now)
            return
        if self.state is BreakerState.CLOSED and len(self.samples) >= self.min_samples:
            p95 = self._p95()
            if p95 > self.slo_p95_ms:
                self._open(now)

    def _open(self, now: float) -> None:
        self.state = BreakerState.OPEN
        self.opened_at = now

    def _p95(self) -> float:
        sorted_vals = sorted(v for _, v in self.samples)
        idx = int(len(sorted_vals) * 0.95) - 1
        return sorted_vals[max(idx, 0)]

    def allow(self) -> bool:
        if self.state is BreakerState.CLOSED:
            return True
        if self.state is BreakerState.OPEN:
            if time.monotonic() - self.opened_at >= self.cooldown_seconds:
                self.state = BreakerState.HALF_OPEN
                return True
            return False
        return True  # HALF_OPEN: allow one probe
The half-open state is the subtle part. You don't want the breaker to slam shut the moment one probe request succeeds. You want a trickle. In practice I let through 5% of traffic in half-open for 60 seconds, and one failure with p95 over SLO sends it back to open. This is more conservative than the classic pattern and it works better for LLMs because recovery is slow — the GPU doesn't just "come back," it takes time to drain.
Admission Control vs Autoscaling Kubernetes GPU
Most teams I meet believe these are the same problem. They're not, and confusing them is how you end up with a $90K/month cloud bill for a workload that could run on three nodes.
Autoscaling answers: "how many replicas should exist right now?" It's slow. On EKS with Karpenter provisioning p5.48xlarge instances (8x H100s), cold start is 4-8 minutes end-to-end. Even with pre-warmed node pools, you're looking at 60-90 seconds. Kubernetes HPA docs will tell you the controller loop runs every 15 seconds; the reality on GPU nodes is much worse.
Admission control answers: "should this specific request proceed right now?" It's fast. Sub-millisecond if you build it right.
The right architecture uses both, but they operate on different time horizons:
- Sub-second: admission control decides accept/reject/degrade
- 10-second to 5-minute: horizontal scale based on sustained queue depth
- Hourly: capacity planning, model quantization decisions, tiered routing
The failure mode I see constantly is teams wiring HPA to GPU utilization or request queue length and calling it done. This creates a feedback loop: load spikes, HPA scales out, cold start takes 3 minutes, requests time out before new pods are ready, HPA then sees low utilization on the just-started pods, scales back in, next spike hits, repeat. It's a bang-bang controller on a system with 3-minute dead time. Of course it oscillates.
The fix is admission control in front of autoscaling, plus a queue-depth metric that only triggers scale-out when sustained (5+ minute average). Short bursts get handled by admission control. Only sustained load triggers new replicas.
Building an Admission Controller: A Working Sketch
Here's the core loop I've used at SIVARO. It's FastAPI + a concurrency limiter + a small classifier that decides route. Simplified but real.
python
import asyncio
import time
from contextlib import asynccontextmanager
from fastapi import FastAPI, HTTPException, Request
from pydantic import BaseModel

class GenerateRequest(BaseModel):
    prompt: str
    max_tokens: int = 512
    priority: str = "interactive"  # interactive | batch | internal

# Per-class concurrency caps derived from empirical batch-size tests.
# These are the numbers we tune. Everything else is policy around them.
CLASS_CAPS = {
    "interactive": 24,
    "batch": 64,
    "internal": 8,
}

class AdmissionController:
    def __init__(self):
        self.semaphores = {k: asyncio.Semaphore(v) for k, v in CLASS_CAPS.items()}
        self.inflight = {k: 0 for k in CLASS_CAPS}
        self.rejected = {k: 0 for k in CLASS_CAPS}
        self.accepted = {k: 0 for k in CLASS_CAPS}
        self.latencies = {k: [] for k in CLASS_CAPS}

    def _class_allowed(self, cls: str) -> bool:
        # Shed low-priority classes first when higher-priority is saturated.
        if cls == "internal" and self.semaphores["interactive"].locked():
            return False
        if cls == "batch" and self.semaphores["interactive"].locked():
            return False
        return True

    @asynccontextmanager
    async def admit(self, cls: str, timeout_ms: int = 200):
        if not self._class_allowed(cls):
            self.rejected[cls] += 1
            raise HTTPException(503, f"class {cls} shed: interactive saturated")
        try:
            await asyncio.wait_for(self.semaphores[cls].acquire(), timeout_ms / 1000)
        except asyncio.TimeoutError:
            self.rejected[cls] += 1
            raise HTTPException(429, "queue wait exceeded")
        self.inflight[cls] += 1
        self.accepted[cls] += 1
        started = time.monotonic()
        try:
            yield
        finally:
            self.inflight[cls] -= 1
            self.semaphores[cls].release()
            self.latencies[cls].append((time.monotonic() - started) * 1000)
Then the endpoint just wraps the model call:
python
app = FastAPI()
admission = AdmissionController()

@app.post("/generate")
async def generate(req: GenerateRequest):
    # Hard timeout for interactive, longer for batch.
    queue_timeout = 200 if req.priority == "interactive" else 5000
    async with admission.admit(req.priority, timeout_ms=queue_timeout):
        result = await call_vllm(req.prompt, req.max_tokens)
        return {"text": result}
Two non-obvious things here. First, the queue timeout is per-class. Interactive traffic waits 200ms max, then gets a 429. Batch traffic can wait 5 seconds because nobody's watching. Second, the _class_allowed check sheds batch traffic the instant interactive is saturated. This is what protects your interactive SLO when a nightly batch job kicks off.
We tuned the caps by running a load test at each concurrency level on the target hardware and picking the point where p95 latency first exceeded the SLO. For Llama 3.1 70B on an H100 with continuous batching in vLLM, that landed at 24 concurrent for our 2s p95 SLO. Your number will differ — it depends on model size, prompt length distribution, quantization, and hardware.
The Numbers That Changed Our Architecture
Three data points from our own measurements in 2025-2026 that reframed how I think about this:
Batch size vs p99 latency on a single H100 (Llama 3.1 70B, AWQ, avg 512-token prompts, 256 output tokens):
| Concurrency | Tokens/sec aggregate | p50 latency | p99 latency |
|---|---|---|---|
| 4 | 890 | 620ms | 890ms |
| 8 | 1,540 | 780ms | 1,340ms |
| 16 | 2,210 | 1,120ms | 2,180ms |
| 32 | 2,680 | 1,890ms | 4,120ms |
| 64 | 2,910 | 3,720ms | 9,600ms |
Doubling concurrency from 32 to 64 buys you 8% more throughput and 2.5x worse p99. That's the tradeoff, quantified. Almost nobody should run at 64 for interactive.
Effect of admission control alone (same hardware, no added GPUs), on a customer we onboarded in March 2026: p99 dropped from 11.2s to 1.8s. Throughput dropped 4%. Users stopped complaining about timeouts. Support tickets fell 60%.
Effect of autoscaling alone (no admission control), same customer, before we intervened: p99 stayed above 8s in every traffic spike. Cloud bill tripled over three months. Zero improvement in tail latency.
Admission control is cheaper, faster, and more effective than autoscaling for protecting tail latency. Autoscaling is necessary for sustained capacity. But if you have to pick one to build first, build admission control. I've said this in every architecture review for two years and I haven't been wrong yet.
Failure Modes I've Actually Lived Through
The well-meaning load balancer. Early SIVARO deployment, 2023. We put an nginx round-robin in front of four vLLM replicas with a 60-second timeout. Burst traffic queued in nginx, timed out at 60s, and got retried by the client. Retries amplified the load 3x. The whole cluster collapsed. Lesson: load balancers without admission control are amplifiers, not shock absorbers.
The generous queue. A customer insisted on queueing up to 500 requests because "rejecting customers is bad." Their p99 hit 45 seconds. When we finally showed them the abort-rate curve — 70% of queued requests were being abandoned by clients before completion — they let us cap the queue at 20. Gone.
The autoscaler that couldn't scale fast enough. We had HPA configured for 2→20 replicas based on queue depth. Queue depth spiked from 5 to 200 in 8 seconds during a Super Bowl ad. HPA triggered. First new replica came online in 2 minutes 40 seconds. By then traffic was normal. We paid for 18 replicas for 15 minutes doing nothing. Admission control would have just rejected the overflow with a clean 429.
The circuit breaker with a hair trigger. We set our first breaker to trip at p95 > 1.5s. A single slow batch job tripped it and took the whole endpoint offline for 10 seconds during peak interactive hours. Now breakers are per-class. Non-negotiable.
Tuning Playbook
If you're starting from zero, here's the order I'd do things in:
Week one. Instrument p50/p95/p99 latency per model endpoint with class labels. You can't tune what you can't measure. Prometheus + histograms, or Datadog if you already pay for it.
Week two. Set concurrency caps. Start with the concurrency that gives you your target p95 latency in a load test, then subtract 20%. You'll thank me later.
Week three. Build the admission controller with per-class semaphores and short queue timeouts. Ship it in shadow mode first — log what it would have rejected, don't reject yet.
Week four. Turn on rejection. Watch error rates, watch p99, watch your users. If p99 drops and error rate stays under 1%, you're winning.
Month two. Add circuit breakers per class. Add a fallback path — smaller model, cached response, or canned message. Test the fallback at least once a week so it works when you need it.
Month three. Wire HPA to sustained queue depth rather than instantaneous GPU utilization. Now autoscaling and admission control cooperate instead of fighting.
FAQ
What's the difference between admission control and rate limiting?
Rate limiting is per-client, static, and enforces fairness. Admission control is system-wide, dynamic, and enforces stability. You need both. Rate limiting stops one noisy tenant from starving everyone. Admission control stops the aggregate from collapsing the server. I've seen teams conflate these and end up with rate limits per user that sum to way more than the server can handle.
Doesn't rejecting requests hurt user experience?
Less than slow responses do. Users abandon at ~10 seconds regardless of whether you queued or rejected. A fast 429 lets the client retry, hit cache, or fall back to a smaller model. A 30-second queue wait burns their patience and your GPU cycles. Reject fast, fail gracefully.
Should I queue or reject under load?
Short queue (under 500ms wait) for interactive, longer for batch. Beyond that, reject. The exception is if the request is idempotent and the client can genuinely wait — some backend jobs are like that. But most interactive traffic isn't.
How do I pick the concurrency cap?
Load test. Push concurrency up 2x at a time and watch p95. When p95 crosses your SLO, back off one step. Then subtract 20% for safety margin. Redo the test every time you change model, quantization, hardware, or vLLM version. The number moves.
Is admission control enough, or do I still need autoscaling?
You need both. Admission control handles seconds-to-minutes spikes. Autoscaling handles sustained shifts in baseline load. If your baseline traffic is growing 20% month over month, no admission controller saves you — you need more GPUs. But admission control buys you the time to add them without burning your SLO.
What about degradation instead of rejection?
My favorite option when you can swing it. If you host a small and a large model, route overflow to the small one with a flag indicating degraded quality. Users usually prefer a fast mediocre answer to a slow great one, especially in chat. It only works if you can keep both models warm, which costs GPU. I'd only do it at scale.
How does this change with MoE models?
MoE makes it stranger. Per-request compute varies wildly based on routing. A Mixtral 8x7B request might activate 2 experts or all 8. Your concurrency cap needs a margin for worst-case activation. In practice I set the cap 30-40% lower for MoE than for dense models of equivalent quality, and watch p99 like a hawk.
Does the circuit breaker pattern really help, or is it just extra complexity?
Helps, but only if you train the breaker on a good signal. Latency-based breakers are best because they trigger before the system is fully dead. Error-based breakers fire too late — by the time you're returning 5xx, you've already disappointed users. Build one, keep it simple, tune aggressively during the first month.
Where This Is Heading
Two things are changing the calculus right now. First, spec decoding is becoming standard. It cuts decode time 2-3x but widens the variance between requests, which breaks naive admission control based on constant per-request cost. Your caps need to be per-request-type, not per-server.
Second, agent workloads are eating the tail. An agent making five tool calls in a loop looks like one request but consumes the GPU budget of five. We're starting to see this in customer traces — 8% of requests account for 60% of GPU time. Admission control that counts requests isn't enough; you need to count expected GPU-seconds. I don't have a clean answer here yet, but I know I need one by Q1 2027.
The bottom line on the admission control LLM serving latency tradeoff: you're not solving a capacity problem, you're solving a policy problem. The GPU will do what you tell it. If you tell it to serve everyone, it'll serve everyone badly. If you tell it to serve the right requests at the right time, everyone stays under SLO and your bill stays sane. Pick your point on the curve deliberately. Most teams pick it by accident and pay for it every month.
Nishaant Dixit — Founder of SIVARO. Building data infrastructure and production AI systems since 2018. Built systems processing 200K events/sec.